October 2025 Ocean SST Cools to Mean

The best context for understanding decadal temperature changes comes from the world’s sea surface temperatures (SST), for several reasons:

  • The ocean covers 71% of the globe and drives average temperatures;
  • SSTs have a constant water content, (unlike air temperatures), so give a better reading of heat content variations;
  • A major El Nino was the dominant climate feature in recent years.

Previously I used HadSST3 for these reports, but Hadley Centre has made HadSST4 the priority, and v.3 will no longer be updated. I’ve grown weary of waiting each month for HadSST4 updates, so the July and August reports were based on data from OISST2.1.  This dataset uses the same in situ sources as HadSST along with satellite indicators. Now however, the US government is shut down and updates to climate datasets are likely to be delayed.  Reminds of what hospitals do when their budgets are slashed: They close the Maternity Ward to get public attention.

So this October report is based again on HadSST 4, but with a twist. The data is slightly different in the new version, 4.2.0.0 replacing 4.1.1.0. Product page is here.

The Current Context

The chart below shows SST monthly anomalies as reported in HadSST 4.2 starting in 2015 through October 2025. A global cooling pattern is seen clearly in the Tropics since its peak in 2016, joined by NH and SH cycling downward since 2016, followed by rising temperatures in 2023 and 2024 and cooling in 2025.

Note that in 2015-2016 the Tropics and SH peaked in between two summer NH spikes.  That pattern repeated in 2019-2020 with a lesser Tropics peak and SH bump, but with higher NH spikes. By end of 2020, cooler SSTs in all regions took the Global anomaly well below the mean for this period.  A small warming was driven by NH summer peaks in 2021-22, but offset by cooling in SH and the tropics, By January 2023 the global anomaly was again below the mean.

Then in 2023-24 came an event resembling 2015-16 with a Tropical spike and two NH spikes alongside, all higher than 2015-16. There was also a coinciding rise in SH, and the Global anomaly was pulled up to 1.1°C in 2023, ~0.3° higher than the 2015 peak.  Then NH started down autumn 2023, followed by Tropics and SH descending 2024 to the present. During 2 years of cooling in SH and the Tropics, the Global anomaly came back down, led by Tropics cooling from its 1.3°C peak 2024/01, down to 0.6C in September this year. Note the smaller peak in NH in July 2025 now declining along with SH and the Global anomaly cooler as well. In October the Global anomaly nearly matched the mean for this period

Comment:

The climatists have seized on this unusual warming as proof their Zero Carbon agenda is needed, without addressing how impossible it would be for CO2 warming the air to raise ocean temperatures.  It is the ocean that warms the air, not the other way around.  Recently Steven Koonin had this to say about the phonomenon confirmed in the graph above:

El Nino is a phenomenon in the climate system that happens once every four or five years.  Heat builds up in the equatorial Pacific to the west of Indonesia and so on.  Then when enough of it builds up it surges across the Pacific and changes the currents and the winds.  As it surges toward South America it was discovered and named in the 19th century  It iswell understood at this point that the phenomenon has nothing to do with CO2.

Now people talk about changes in that phenomena as a result of CO2 but it’s there in the climate system already and when it happens it influences weather all over the world.   We feel it when it gets rainier in Southern California for example.  So for the last 3 years we have been in the opposite of an El Nino, a La Nina, part of the reason people think the West Coast has been in drought.

It has now shifted in the last months to an El Nino condition that warms the globe and is thought to contribute to this Spike we have seen. But there are other contributions as well.  One of the most surprising ones is that back in January of 2022 an enormous underwater volcano went off in Tonga and it put up a lot of water vapor into the upper atmosphere. It increased the upper atmosphere of water vapor by about 10 percent, and that’s a warming effect, and it may be that is contributing to why the spike is so high.

A longer view of SSTs

To enlarge, open image in new tab.

The graph above is noisy, but the density is needed to see the seasonal patterns in the oceanic fluctuations.  Previous posts focused on the rise and fall of the last El Nino starting in 2015.  This post adds a longer view, encompassing the significant 1998 El Nino and since.  The color schemes are retained for Global, Tropics, NH and SH anomalies.  Despite the longer time frame, I have kept the monthly data (rather than yearly averages) because of interesting shifts between January and July. 1995 is a reasonable (ENSO neutral) starting point prior to the first El Nino.

The sharp Tropical rise peaking in 1998 is dominant in the record, starting Jan. ’97 to pull up SSTs uniformly before returning to the same level Jan. ’99. There were strong cool periods before and after the 1998 El Nino event. Then SSTs in all regions returned to the mean in 2001-2.

SSTS fluctuate around the mean until 2007, when another, smaller ENSO event occurs. There is cooling 2007-8,  a lower peak warming in 2009-10, following by cooling in 2011-12.  Again SSTs are average 2013-14.

Now a different pattern appears.  The Tropics cooled sharply to Jan 11, then rise steadily for 4 years to Jan 15, at which point the most recent major El Nino takes off.  But this time in contrast to ’97-’99, the Northern Hemisphere produces peaks every summer pulling up the Global average.  In fact, these NH peaks appear every July starting in 2003, growing stronger to produce 3 massive highs in 2014, 15 and 16.  NH July 2017 was only slightly lower, and a fifth NH peak still lower in Sept. 2018.

The highest summer NH peaks came in 2019 and 2020, only this time the Tropics and SH were offsetting rather adding to the warming. (Note: these are high anomalies on top of the highest absolute temps in the NH.)  Since 2014 SH has played a moderating role, offsetting the NH warming pulses. After September 2020 temps dropped off down until February 2021.  In 2021-22 there were again summer NH spikes, but in 2022 moderated first by cooling Tropics and SH SSTs, then in October to January 2023 by deeper cooling in NH and Tropics.

Then in 2023 the Tropics flipped from below to well above average, while NH produced a summer peak extending into September higher than any previous year.  Despite El Nino driving the Tropics January 2024 anomaly higher than 1998 and 2016 peaks, following months cooled in all regions, and the Tropics continued cooling in April, May and June along with SH dropping.  After July and August NH warming again pulled the global anomaly higher, September through January 2025 resumed cooling in all regions, continuing February through April 2025, with little change in May,June and July despite upward bumps in NH. Now temps in all regions are cooling August and September 2025.

What to make of all this? The patterns suggest that in addition to El Ninos in the Pacific driving the Tropic SSTs, something else is going on in the NH.  The obvious culprit is the North Atlantic, since I have seen this sort of pulsing before.  After reading some papers by David Dilley, I confirmed his observation of Atlantic pulses into the Arctic every 8 to 10 years.

Contemporary AMO Observations

Through January 2023 I depended on the Kaplan AMO Index (not smoothed, not detrended) for N. Atlantic observations. But it is no longer being updated, and NOAA says they don’t know its future.  So I find that ERSSTv5 AMO dataset has current data.  It differs from Kaplan, which reported average absolute temps measured in N. Atlantic.  “ERSST5 AMO  follows Trenberth and Shea (2006) proposal to use the NA region EQ-60°N, 0°-80°W and subtract the global rise of SST 60°S-60°N to obtain a measure of the internal variability, arguing that the effect of external forcing on the North Atlantic should be similar to the effect on the other oceans.”  So the values represent SST anomaly differences between the N. Atlantic and the Global ocean.

The chart above confirms what Kaplan also showed.  As August is the hottest month for the N. Atlantic, its variability, high and low, drives the annual results for this basin.  Note also the peaks in 2010, lows after 2014, and a rise in 2021. Then in 2023 the peak reached 1.4C before declining to 0.9 last month.  An annual chart below is informative:

Note the difference between blue/green years, beige/brown, and purple/red years.  2010, 2021, 2022 all peaked strongly in August or September.  1998 and 2007 were mildly warm.  2016 and 2018 were matching or cooler than the global average.  2023 started out slightly warm, then rose steadily to an  extraordinary peak in July.  August to October were only slightly lower, but by December cooled by ~0.4C.

Then in 2024 the AMO anomaly started higher than any previous year, then leveled off for two months declining slightly into April.  Remarkably, May showed an upward leap putting this on a higher track than 2023, and rising slightly higher in June.  In July, August and September 2024 the anomaly declined, and despite a small rise in October, ended close to where it began.  Note 2025 started much lower than the previous year and headed sharply downward, well below the previous two years, then since April through September aligning with 2010. Now in October there was an unusual upward spike.

The pattern suggests the ocean may be demonstrating a stairstep pattern like that we have also seen in HadCRUT4.

The rose line is the average anomaly 1982-1996 inclusive, value 0.18.  The orange line the average 1982-2025, value 0.40 also for the period 1997-2012. The red line is 2015-2025, value 0.68. As noted above, these rising stages are driven by the combined warming in the Tropics and NH, including both Pacific and Atlantic basins.

Curiosity:  Solar Coincidence?

The news about our current solar cycle 25 is that the solar activity is hitting peak numbers now and higher  than expected 1-2 years in the future.  As livescience put it:  Solar maximum could hit us harder and sooner than we thought. How dangerous will the sun’s chaotic peak be?  Some charts from spaceweatherlive look familar to these sea surface temperature charts.

Summary

The oceans are driving the warming this century.  SSTs took a step up with the 1998 El Nino and have stayed there with help from the North Atlantic, and more recently the Pacific northern “Blob.”  The ocean surfaces are releasing a lot of energy, warming the air, but eventually will have a cooling effect.  The decline after 1937 was rapid by comparison, so one wonders: How long can the oceans keep this up? And is the sun adding forcing to this process?

uss-pearl-harbor-deploys-global-drifter-buoys-in-pacific-ocean

USS Pearl Harbor deploys Global Drifter Buoys in Pacific Ocean

UN Sinking Itself

As if the circus at the UN COP in Belem were not enough,

More than 80 people were arrested during operation against the Red Command in Rio de Janeiro. Reuters.

The United Nations weighed in once more—and, once more, the world rolled its eyes. Immediately after a police raid in Rio de Janeiro that claimed the lives of over one hundred, the UN’s Human Rights Office vehemently denounced Rio de Janeiro’s conservative governor, Cláudio Castro, for what it called a “deadly operation” of  “extreme, lethal consequences”. What it left out is that all of the victims were policemen or narcoterrorists. There were no civilian casualties. Not one.

It didn’t make any difference. This is an institution that has long lost its taste for facts. What drives it now is theatre—ritual condemnation on the altar of human rights, the last moral capital of a useless and toothless bureaucratic colossus with very little discernible use. The UN has its preferential villains: strong states asserting their sovereignty, governments that boldly police their own streets, and leaders that still believe law and order are the lifeblood of civilisation. The Brazilian federal government of left-wing President Lula da Silva, of course, had nothing to do with it; the raid was wholly the brainchild of Rio de Janeiro’s conservative leadership. And that is why, like Hungary when it strives to defend its borders or Poland under the previous PiS government when it tried to shield its sovereignty from wanton, undue EU interference, so too was Rio de Janeiro immediately badmouthed by these faux harbingers of virtue. One hopes that Castro will ignore the UN’s calls to surrender his city to criminal gangs and, instead, continue to hit them hard.

This latest, shameful episode comes to confirm, once again, the moral bankruptcy of the United Nations. The UN has—deservedly—become what it was meant not to become: a pulpit. It is now an international moral church of sorts whose priests sit in Geneva and New York and whose scripture is dictated by the bien-pensant Left. It makes a charade of the very notion of impartiality.

Indeed, in Brazil’s case, it barely seems to notice that Rio’s drug barons are able to control entire slums as feudal fiefdoms; it doesn’t pity the hundreds of thousands of ordinary, innocent people who live under the bloodthirsty tyranny of organised crime. It doesn’t care that this malignant tumour spreads its evil internationally, with the operatives entrenching themselves as a powerful presence in Portugal and elsewhere in Europe as well as poisoning increasing numbers of Europeans with their drugs. More than any other global institution, the UN has now degenerated into an international of wokery: Its nonsense on ‘systemic violence’ and ‘structural racism’ has replaced analysis or common sense.

Moral theatre has done away with moral clarity.

This charade isn’t even hypocritical anymore. Hypocrisy, after all, involves some perception of right and wrong—it might be ugly, but it is not oblivious. The UN, meanwhile, does not even pretend to be a servant of a moral order rooted in law anymore. It serves only the balance of its own internal politics. The bureaucracy survives by condemning only those who it is safe to condemn.

The irony is that the UN was established specifically to avoid this fate. It was meant as a forum for sovereign countries, not as an ultra-politicised court. But sovereignty has become a meaningless word for the UN, captured as it has been by latte-sipping liberal globalists. Those who currently populate the institution speak in the banal Esperanto of Western left-wing midwitery. They seldom have any meaningful political experience. They are alien to reality, and reality is alien to them.

The UN’s condemnation of Brazil is a perfect example of this pernicious catechism. The real Marx, whatever his faults, would have stood up to applaud the destruction of the vile lumpenproletarian hellholes of the Brazilian favela; he would have cheered for the liberation of working-class communities from the iron rule of the drug lords. Engels, similarly, would have condoned Hungary for protecting its working people from the incoming hordes of cheap, socially disruptive labour with which Merkel and those before and after have systematically asphyxiated Europe. The UN’s current mainstream sensitivity is not even classically left-wing; it betrays a mindset that is specifically and unequivocally drawn from modern bourgeois-bohème Western leftism.

Meanwhile, genuine atrocitiesthe mass slaughter of Christians in Nigeria or Syria, the abominable massacres in Sudan, the rampant gang rule and cannibalism in Haiti, with the UN still failing to fund the mission approved in 2023—continue unabated. They are referred to, if at all, as asterisks to reports written in the language of cowardice. The UN moral vocabulary has become utterly risible.

The price of all this corruption is irrelevance. No serious power finds the UN credible anymore. The Security Council is an opera of vetoes; its resolutions carry no weight at all. Peacekeeping missions fail, humanitarian aid organisations rot in corruption scandals, and the lofty words of the Charter are heard echoing through empty chambers.

If the UN is to survive the coming decades, it will not be through reform but through restoration. It must return to its founding principle: that of an assembly of equal, sovereign states bargaining over their mutual interests and concerns, not as a platform for empty virtue signaling. And if it can’t, it will wither away—perhaps not with a bang, but with a yawn of irrelevance.

And maybe, in the end, that would be the most ethical thing it could do.


Ending Government’s Addiction to Junk Science

In their American Thinker article Junk science and government,  S. Stanley Young and Warren Kindzierski describe the corruption problem and a solution pathway.  The article includes links to research studies exposing how pseudoscience is employed to promote governmental agendas in fields such as climate, environment, medicine and social policies. Excerpts in italics with my bolds and added images.

Science controversies have become left-right wars fought on the internet. These days everything exists, from run-of-the-mill issues such as (fake) climate change or extreme numbers of unsafe vaccines children need to receive — up to 80 by age 18, including boosters, and COVID vaccines saving lives (hardly, but anyhow), to the Tylenol-autism dustup.

Even people with life experience and common sense have problems judging such controversies; and the internet is where sound science competes with junk science.

The National Association of Scholars (NAS) spent the past few years examining the methods of four different fields of science that lead to irreproducible (false) evidence used by governments. Flawed methods are big part of what leads to false evidence and junk science. Guess where most of this junk originates? Government-funded academia.

Academic junk science has been allowed to run amuck for decades and with little or no policing from university administrations. Elite universities, e.g., Harvard, seem to be right in there among the infestation. They would have us think they are important for science innovation. They’re wrong: more often than not — key innovations come from private industries and industrial laboratories rather than from universities.

So where does junk science fit in? It works in favor of government policymakers who mostly spend their career on our dime trying to make their jobs more important. They do this by using junk science to create irresponsible polices and regulations that are costly, meaningless, or even harmful to us.

Government policies should be built on transparent and accountable scientific research. Policies (and regulations) developed from research should clear a high barrier of proof. They should be based on reproducible science. Unsurprisingly, too many government science policies fail here.

All this points to a policy crisis in government. The current situation is win/win for government bureaucrats and universities: agency propaganda is supported and universities get grants. The citizens — us — are the ones paying for the loss of freedom.

The road to fixing this mess has already started at the top — the White House, with a landmark executive order Restoring Gold Standard Science. This order is a return to foundational scientific principles in government — fostering discovery, innovation, and trust in science. To this end, we offer four reforms to help governments.

Source: NIH Publishes Plan to Drive Gold Standard Science, August 22, 2025

1. Cut the funding of junk science. Federal government agencies need to change their regulatory and funding practices to fix the irreproducibility crisis in academic science and the irresponsibility crisis in our government.

2. Sever the fraudulent relationship between government policymakers and academic junk scientists. Federal and state policymakers need to end the arbitrary procedures of using government-funded scientific research for regulation if it is irreproducible.

3. Fix the process fueling this train wreck. Federal and state policymakers need to change the teaching of undergraduate (and K‒12) science and math to educate properly a new generation of science professionals, policymakers, and informed citizens. They certainly should cover junk science and fossil fuel development, the latter which is linked to our prosperity.

4. Refocus policy institutes to dedicate themselves to sound science policy as a priority. These institutes need to be staffed with people who know the difference between sound and junk science, and the benefits of fossil fuels.

Previous administrations have allowed a cesspit of relationships between government policymakers and academic junk scientists, including radical activists disguised as scientists.

Government experts employed to judge scientific research and academics (whom mostly lean left) are naïve or sly practitioners of political groupthink. They are not our friends.

These reforms will go a long way in reversing the current situation of government bureaucrats and academics jointly using regulation based on junk science to advance corrupt, self-serving policy goals.

S. Stanley Young, PhD, is the CEO of CGStat in Raleigh, North Carolina and is Director of the National Association of Scholars’ Shifting Sands Project. Warren Kindzierski, PhD, is a retired college professor (public health) in St Albert, Alberta.

See Also

Why Federalized Science is Rotten

Government Funding Corrupts Science, How to Stop It

Woke and Green Fading Away

Philip Cross writes at Financial Post Woke and Green are departing the scene.  Excerpts in italics with my bolds and added image.

2025 may mark the end for such policies as unsubsidized EV sales
collapse and impatience with DEI rises

This year is shaping up as a turning point in restoring sanity to public policy. Nowhere is the change more evident than in attitudes to green energy policies, once the rallying cry for left-wing parties in North America. Support has collapsed for three pillars of green energy advocacy:

♦  building electric vehicles to eliminate our need for oil pipelines and refineries;

♦  using the financial clout of the Net-Zero Banking Alliance to force firms
to eliminate carbon emissions; and

♦  legally mandating the shift from fossil fuels to green energy.

This turning away from green energy policies is reflected in how industrial policy underpinning electric vehicles (EV) has been discredited over the past year. Companies are delaying or abandoning the building of EV assembly and battery plants, mainly because EV sales are slumping following withdrawal of the artificial stimulus of government subsidies in both Canada and the U.S. Walking away from these investments leaves governments on the hook for billions of dollars they rashly pledged in support of EV projects.

In Quebec, Northvolt stopped work on a $7-billion battery plant, electric bus manufacturer Lion Electric filed for bankruptcy, and the Ultium CAM consortium paused plans to expand production of materials for batteries to be used in GM vehicles, which in turn led the giant mining company Vale to cancel plans for a nickel sulfate plant to supply these batteries. In Ontario, Honda delayed $15 billion of investments to build EV assembly plants and supply them with batteries, while Ford postponed its EV assembly plant plans after its EV division posted losses of $12 billion over the past two and a half years. Just last week, GM stopped producing electric delivery vans at its Ingersoll plant due to slack demand that had “nothing to do with tariffs or trade,” according to GM Canada’s president.

As investment in EV and battery plants collapses into full retreat, the outlook for fossil fuel demand improves. The International Energy Agency has reversed course and now projects demand will rise by 2.5 million barrels a day between 2024 and 2030. The under-investment in petroleum refining resulting from our having bought into the narrative that oil was past peak pushed the industry’s capacity utilization rate to 94.1 per cent in July, the highest of any industry in Canada that month. The prospect of demand exceeding capacity spurred the industry to boost investment to over $3 billion last year, double its average over the previous two decades.

The shift in public attitudes to fossil fuels provoked an abrupt about-face in Prime Minister Mark Carney’s stance on energy policy. In 2021 Carney spearheaded the launch of the Net-Zero Banking Alliance, which proposed to use access to credit to push firms to adopt policies that eliminated greenhouse gas emissions. But last month, after the world’s largest banks left it, including Canada’s, the alliance shut down. Even as it did, Carney’s government revived the Keystone XL pipeline proposal to carry Canada’s bitumen to U.S. refineries looking to replace dwindling heavy oil shipments from Mexico and Venezuela.

The tide is also turning against climate-change activists in the legal world. Just last week, a U.S. federal court ruled against claims by a group of young people that the Trump administration’s gutting of green energy initiatives violated their human rights. The court concluded such an important policy issue should be resolved at the ballot box and not in the courts, a precedent we should all hope helps Ontario courts reach the same conclusion in a similar case brought by teenagers.

The setbacks for green energy policies are reflected in disarray among left-wing parties in Canada and the U.S. In the U.S., The New York Times reports, registration of Democratic voters has fallen by two million since last year’s elections, despite high disapproval of Trump’s economic policies. While the radical left rejoices in the candidacy of self-styled Democratic Socialist Zohran Mamdani for mayor of New York, more centrist Democrats, fearing his radical agenda will hurt the party in next year’s midterm elections, have been slow to endorse him. In Canada, the NDP lost official party status in this spring’s federal election as its vote share plumbed historic lows, revealing the folly of Leap manifesto leaders forcing out Thomas Mulcair as NDP leader in 2017 because they wanted more aggressive opposition to fossil fuels.

Policies such as the Green New Deal are not the left’s only vulnerability. Support for woke social movements such as DEI (“diversity, equity and inclusion”) has also become a liability. A fundamental problem associated with both the green and woke movements is that advocates are so convinced of the righteousness of their causes that they refuse to countenance debate.

Because neither developed arguments that resonated with the public,
that same public is not alarmed to see these policies dismantled.


UAH Ocean Stays Cool, SH Land Warms, October 2025

The post below updates the UAH record of air temperatures over land and ocean. Each month and year exposes again the growing disconnect between the real world and the Zero Carbon zealots.  It is as though the anti-hydrocarbon band wagon hopes to drown out the data contradicting their justification for the Great Energy Transition.  Yes, there was warming from an El Nino buildup coincidental with North Atlantic warming, but no basis to blame it on CO2.

As an overview consider how recent rapid cooling  completely overcame the warming from the last 3 El Ninos (1998, 2010 and 2016).  The UAH record shows that the effects of the last one were gone as of April 2021, again in November 2021, and in February and June 2022  At year end 2022 and continuing into 2023 global temp anomaly matched or went lower than average since 1995, an ENSO neutral year. (UAH baseline is now 1991-2020). Then there was an usual El Nino warming spike of uncertain cause, unrelated to steadily rising CO2, and now dropping steadily back toward normal values.

For reference I added an overlay of CO2 annual concentrations as measured at Mauna Loa.  While temperatures fluctuated up and down ending flat, CO2 went up steadily by ~65 ppm, an 18% increase.

Furthermore, going back to previous warmings prior to the satellite record shows that the entire rise of 0.8C since 1947 is due to oceanic, not human activity.

gmt-warming-events

The animation is an update of a previous analysis from Dr. Murry Salby.  These graphs use Hadcrut4 and include the 2016 El Nino warming event.  The exhibit shows since 1947 GMT warmed by 0.8 C, from 13.9 to 14.7, as estimated by Hadcrut4.  This resulted from three natural warming events involving ocean cycles. The most recent rise 2013-16 lifted temperatures by 0.2C.  Previously the 1997-98 El Nino produced a plateau increase of 0.4C.  Before that, a rise from 1977-81 added 0.2C to start the warming since 1947.

Importantly, the theory of human-caused global warming asserts that increasing CO2 in the atmosphere changes the baseline and causes systemic warming in our climate.  On the contrary, all of the warming since 1947 was episodic, coming from three brief events associated with oceanic cycles. And in 2024 we saw an amazing episode with a temperature spike driven by ocean air warming in all regions, along with rising NH land temperatures, now dropping well below its peak.

Chris Schoeneveld has produced a similar graph to the animation above, with a temperature series combining HadCRUT4 and UAH6. H/T WUWT

image-8

See Also Worst Threat: Greenhouse Gas or Quiet Sun?

October 2025 UAH Temps: Cool Ocean, Warm Land  banner-blog

With apologies to Paul Revere, this post is on the lookout for cooler weather with an eye on both the Land and the Sea.  While you heard a lot about 2020-21 temperatures matching 2016 as the highest ever, that spin ignores how fast the cooling set in.  The UAH data analyzed below shows that warming from the last El Nino had fully dissipated with chilly temperatures in all regions. After a warming blip in 2022, land and ocean temps dropped again with 2023 starting below the mean since 1995.  Spring and Summer 2023 saw a series of warmings, continuing into 2024 peaking in April, then cooling off to the present.

UAH has updated their TLT (temperatures in lower troposphere) dataset for October 2025. Due to one satellite drifting more than can be corrected, the dataset has been recalibrated and retitled as version 6.1 Graphs here contain this updated 6.1 data.  Posts on their reading of ocean air temps this month are ahead the update from HadSST4 or OISST2.1.  I posted recently on SSTs September 2025 Ocean SST Cooling These posts have a separate graph of land air temps because the comparisons and contrasts are interesting as we contemplate possible cooling in coming months and years.

Sometimes air temps over land diverge from ocean air changes. In July 2024 all oceans were unchanged except for Tropical warming, while all land regions rose slightly. In August we saw a warming leap in SH land, slight Land cooling elsewhere, a dip in Tropical Ocean temp and slightly elsewhere.  September showed a dramatic drop in SH land, overcome by a greater NH land increase. 2025 has shown a sharp contrast between land and sea, first with ocean air temps falling in January recovering in February.  Now in September and October SH land temps have spiked while ocean temps showed litle change.  As a result of larger ocean surface, Global temps remained cool.

Note:  UAH has shifted their baseline from 1981-2010 to 1991-2020 beginning with January 2021.   v6.1 data was recalibrated also starting with 2021. In the charts below, the trends and fluctuations remain the same but the anomaly values changed with the baseline reference shift.

Presently sea surface temperatures (SST) are the best available indicator of heat content gained or lost from earth’s climate system.  Enthalpy is the thermodynamic term for total heat content in a system, and humidity differences in air parcels affect enthalpy.  Measuring water temperature directly avoids distorted impressions from air measurements.  In addition, ocean covers 71% of the planet surface and thus dominates surface temperature estimates.  Eventually we will likely have reliable means of recording water temperatures at depth.

Recently, Dr. Ole Humlum reported from his research that air temperatures lag 2-3 months behind changes in SST.  Thus cooling oceans portend cooling land air temperatures to follow.  He also observed that changes in CO2 atmospheric concentrations lag behind SST by 11-12 months.  This latter point is addressed in a previous post Who to Blame for Rising CO2?

After a change in priorities, updates are now exclusive to HadSST4.  For comparison we can also look at lower troposphere temperatures (TLT) from UAHv6.1 which are now posted for October 2025.  The temperature record is derived from microwave sounding units (MSU) on board satellites like the one pictured above. Recently there was a change in UAH processing of satellite drift corrections, including dropping one platform which can no longer be corrected. The graphs below are taken from the revised and current dataset.

The UAH dataset includes temperature results for air above the oceans, and thus should be most comparable to the SSTs. There is the additional feature that ocean air temps avoid Urban Heat Islands (UHI).  The graph below shows monthly anomalies for ocean air temps since January 2015.

In 2021-22, SH and NH showed spikes up and down while the Tropics cooled dramatically, with some ups and downs, but hitting a new low in January 2023. At that point all regions were more or less in negative territory.

After sharp cooling everywhere in January 2023, there was a remarkable spiking of Tropical ocean temps from -0.5C up to + 1.2C in January 2024.  The rise was matched by other regions in 2024, such that the Global anomaly peaked at 0.86C in April. Since then all regions have cooled down sharply to a low of 0.27C in January.  In February 2025, SH rose from 0.1C to 0.4C pulling the Global ocean air anomaly up to 0.47C, where it stayed in March and April. In May drops in NH and Tropics pulled the air temps over oceans down despite an uptick in SH. At 0.43C, ocean air temps were similar to May 2020, albeit with higher SH anomalies. Now in September/October Global ocean temps are little changed with Tropics dropping again along with NH declining slightly..

Land Air Temperatures Tracking in Seesaw Pattern

We sometimes overlook that in climate temperature records, while the oceans are measured directly with SSTs, land temps are measured only indirectly.  The land temperature records at surface stations sample air temps at 2 meters above ground.  UAH gives tlt anomalies for air over land separately from ocean air temps.  The graph updated for October is below.

Here we have fresh evidence of the greater volatility of the Land temperatures, along with extraordinary departures by SH land.  The seesaw pattern in Land temps is similar to ocean temps 2021-22, except that SH is the outlier, hitting bottom in January 2023. Then exceptionally SH goes from -0.6C up to 1.4C in September 2023 and 1.8C in  August 2024, with a large drop in between.  In November, SH and the Tropics pulled the Global Land anomaly further down despite a bump in NH land temps. February showed a sharp drop in NH land air temps from 1.07C down to 0.56C, pulling the Global land anomaly downward from 0.9C to 0.6C. Some ups and downs followed with returns close to February values in August.  Now in October we see a remarkable spike in SH land temps, supported by NH and Tropics in September.

The Bigger Picture UAH Global Since 1980

The chart shows monthly Global Land and Ocean anomalies starting 01/1980 to present.  The average monthly anomaly is -0.0, 2for this period of more than four decades.  The graph shows the 1998 El Nino after which the mean resumed, and again after the smaller 2010 event. The 2016 El Nino matched 1998 peak and in addition NH after effects lasted longer, followed by the NH warming 2019-20.   An upward bump in 2021 was reversed with temps having returned close to the mean as of 2/2022.  March and April brought warmer Global temps, later reversed

With the sharp drops in Nov., Dec. and January 2023 temps, there was no increase over 1980. Then in 2023 the buildup to the October/November peak exceeded the sharp April peak of the El Nino 1998 event. It also surpassed the February peak in 2016. In 2024 March and April took the Global anomaly to a new peak of 0.94C.  The cool down started with May dropping to 0.9C, and in June a further decline to 0.8C.  October went down to 0.7C,  November and December dropped to 0.6C.In August Global Land and Ocean went down to 0.39C, then rose slightly to 0.53 in October.

The graph reminds of another chart showing the abrupt ejection of humid air from Hunga Tonga eruption.

TLTs include mixing above the oceans and probably some influence from nearby more volatile land temps.  Clearly NH and Global land temps have been dropping in a seesaw pattern, nearly 1C lower than the 2016 peak.  Since the ocean has 1000 times the heat capacity as the atmosphere, that cooling is a significant driving force.  TLT measures started the recent cooling later than SSTs from HadSST4, but are now showing the same pattern. Despite the three El Ninos, their warming had not persisted prior to 2023, and without them it would probably have cooled since 1995.  Of course, the future has not yet been written.

Cal Laws Compell PC Climate Speech, Exxon Sues for Free Speech

Tim O’Brien explains the climate lawfare in his PJ article Is California Attempting to ‘Suicide’ Big Oil and Write the Suicide Note? Excerpts in italics with my bolds and added images.

Sometimes big corporations are their own worst enemies. They say things and do things that at the moment sound good and perhaps win an immediate PR battle, but those same words or positions can come back to bite them later. Such is the case for ExxonMobil. 

Back in 2006, almost 20 years ago, the company’s then-CEO Rex Tillerson told the New York Times that a company report had acknowledged the link between the consumption of fossil fuels and rising global temperatures, saying, “We recognize that climate change is a serious issue.” He then added, “We recognize that greenhouse gas emissions are one of the factors affecting climate change.” 

This massive gesture of appeasement was a major concession, and it awarded a huge victory to climate alarmists. In that same article, the Times suggested that if Tillerson was successful, ExxonMobil would “no longer be the oil company that environmentalists love to hate.” 

Climate Activists storm the bastion of Exxon Mobil, here seen without their shareholder disguises.

How’d that work out? Did they back off of ExxonMobil and other big oil companies as a result? No, they ramped up the pressure so steadily and so heavily that over the years, “climate change” activists led ExxonMobil by the nose. It went full bore into “sustainability,” and it even supports the Paris Agreement, also known as the Paris Climate Accord. 

After years of incremental surrender to the left, the company now finds itself in the position of having to sue the state of California over a pair of 2023 “disclosure laws” that amount to the state mandating what companies can and cannot say about certain climate change matters. 

Last week, the company sued California in the U.S. District Court for the Eastern District of California on claims that Senate Bills 253 and 261 “trumpet California’s message.” The message in question, apparently, is that big oil and other major companies are “uniquely responsible for climate change.” In its lawsuit, Exxon Mobil said it considers this sort of message as “misleading.” The suit challenges both laws on grounds that they are First Amendment violations. The intent of the litigation is to stop these laws from going into effect in 2026. 

The climate alarmists and their entire sector are portraying the laws as requiring basic “climate-related transparency.” 

But if you dig into these laws, it reminds me of that old saying about free speech. It goes like this: “Communist China believes in free speech. So long as you say what the government likes, you can say whatever you want.” That pretty much sums up this situation.

More specifically, ExxonMobil contends that to comply, it would need to
rely on “frameworks that place disproportionate blame
on large companies like ExxonMobil.”

Senate Bill 253

Gov. “Slick” Newsom signed Senate Bill 253 (the Climate Corporate Data Accountability Act) into law in 2023. It requires big companies to disclose a wide range of emissions, and not just the stuff coming out of their industrial pipes and smoke stacks. They’d even have to report “direct and indirect emissions” that would include quantitative measurement of and a cost for employee business travel and product transport. 

I’ve seen some of this type of internal tracking and reporting up close, and it’s ridiculous. It’s all in line with ESG measurements and processes that are inconsistent at best. Just as often, it’s a scoring system built on “Wild A** Guesses.” 

Senate Bill 261

Senate Bill 261 (or the Climate-related Financial Risk Act ) gets even more pointedly at the First Amendment issues at play. This law requires businesses that generate more than $500 million per year to “disclose” the financial impacts and risks they face from climate change, and how they will respond. 

More to the point, ExxonMobil said that if it even tried to comply with this law, it would have to guess on things it can’t even know about in advance. Essentially, it would have to try to predict the future and put those predictions on its own website. 

At the same time, the suit points out that Exxon doesn’t even have
any crude oil or natural gas exploration, production, manufacturing,
transport or refining operations in California. 

On the First Amendment issue, in ExxonMobil’s case, the company is expected to argue that both laws require companies to speak publicly in specific ways. The laws don’t simply mandate that the company disclose factual data on past activities and results, but rather that it must speculate in ways it cannot reasonably and responsibly do. 

This is “compelled speech.” While the First Amendment protects the right to speak, it also protects the right not to have the government force you to speak, or to incorporate the government’s desired message. This is known as the “compelled speech doctrine.” While it is usually described as it pertains to individual rights, there is some history of commercial businesses running into this same issue.

What all of this amounts to is it seems that as industries go, California is attempting to “suicide” Big Oil, and it even wants to write the suicide note for the industry.

World Dodged UN Climate Bullet, thanks to US

Matthew Boyle breaks the news at Breitbart Mike Waltz Reveals How Trump Killed ‘Global Green Tax’ That Would Have Created ‘U.N. Climate Slush Fund’ at 11th Hour.  Excerpts in italics with my bolds and added images.

NEW YORK — U.S. Ambassador to the United Nations Mike Waltz told Breitbart News exclusively of how President Donald Trump and his cabinet rallied at the 11th hour to thwart globalists from creating a “global green tax” that he argued would have created a “U.N. climate slush fund.”

“They were this close to mandating that we basically have a Green New Deal in our global shipping fleet,” Waltz told Breitbart News on the floor of the U.N. General Assembly in the interview taped on Thursday, Oct. 23. “Eighty percent of our economy is based on trade. It would have been devastating. In fact, it would have added a billion dollars a month to the cost of sending our goods around the world or receiving goods. We got fired up as a cabinet — the EU, Brazil, and others thought this thing was a done deal. We got everybody involved, including the president. He came in off the top ropes, and we defeated that vote. I think we just saved the American consumer a massive, massive — what would have been the first U.N. tax in global history just this past week. So that’s the kind of fighting that we’re doing in the types of these organizations, and the kind of wins that we have to deliver for the American people.”

Waltz further explained that the tax that would have been created would have targeted U.S. ships and forced them either to pay billions in global taxes or go through retrofitting in China to use European-backed power sources — but ultimately this has been stopped. He does expect the globalists who pushed this effort to try again, but he said next time the Trump administration will be even more prepared and will stop it again.

“If we had coal fired, gas fired, oil fired ships, this global organization was going to impose a fine on those shipping companies, of course, and that would have been to the tune of a billion dollars a month globally that would have been passed on to the consumers, obviously,” Waltz said. “That money then would have would have formed a U.N.-run green climate slush fund to the tune of $12 to $15 billion a year that would have turned around and done more and more of this. It really would have been the first global green tax and I think we would have felt it through inflation. We would have felt it on our consumer shelves and it would have been yet another assault on the American oil and gas industry.

Published by European Maritime Safety Agency

“We said there will be consequences if you do this and we laid out what those consequences were. Now, we were accused of being diplomatic gangsters and bullies and what have you. But look, it was they who are being the climate bullies and we’re not going to allow them to do that to our shipping fleet. If it had happened, here was the real secret. The EU was subsidizing all the biofuels that they wanted to push to our ships and the only place we could retrofit our ships were in Chinese ports and shipyards. So this would have been a win for the EU, a win for China, a loss for the United States. We said, ‘We’re not going to have it,’ and we got in there and won.”

So, are they trying again? Of course they’re going to try again. As we came at this, frankly, a little bit last-minute, we won, but we delayed the vote until next year. We’re going to make our position crystal clear, and I don’t think this thing is going to get through now. This is just the tip of the iceberg. It’s what’s happening in these over 80 organizations around the world. What it really amounts to is a climate ideology that is nonsensical. It’s an ideology that just doesn’t make sense. For example, in AI [artificial intelligence], a big piece of that is power. You can’t power AI through wind and solar — you just can’t — and we already know the President’s problems with wind. We already know that the vast majority of solar panels are made where? In China.

But we need an all-of-the-above solution. We need nuclear, we need gas, we need oil, we need coal, and those other renewable forms of energy in order to win. But what we find is even when we reach, say, some kind of trade deal with a country or with the EU, then they try to back door these regulations in favor of them and against us through these international organizations that are often under the U.N. umbrella. That’s why we need fighters in here. I have Tammy Bruce who will be going to the Senate to be the Deputy Ambassador here. We have myself, and we have other members of the team that 100 percent believe in the President’s America first agenda. We’re going to start fighting and blocking and tackling in these organizations.”

Addendum on Biofuels, the worst energy choice, disqualified for “All of the Above”

Put simply, power density is just how much stuff it takes to get your energy; how much land or other physical resources. And we measure it by how many watts you can get per square meter, or liter, or kilogram – which, if you’re like us…probably means nothing to you.

So let’s put this in tangible terms. Just about the worst energy source America has by the standards of power density are biofuels, things like corn-based ethanol. Biofuels only provide less than 3% of America’s energy needs–and yet, because of the amount of corn that has to be grown to produce it … they require more land than every other energy source in the country combined. Lots of resources going in, not much energy coming out–which means they’re never going to be able to be a serious fuel source.  Moreover, it cannibalizes arable land needed for food.

Value of Decarbonizing Pledges? Net Zero.

There are two reasons why Bill Gates and hundreds of Corporations and many countries are backtracking on commitments to decarbonize.  One is disbelieving the false advertising that the planet is in danger and can be saved by Net Zero efforts. Second is sobering up to the fact that decarbonizing the world is an impossible fantasy.  This post includes content from Gary Abernathy on the first point and some quotes from Vaclav Smil’s recent paper on the second.

  1.  Abernathy writes at Real Clear Energy In practice, ‘Net Zero’ Was Exactly How Much Such Pledges Were Worth.  Excerpts in italics with my bolds and added images.

The public “net zero” pledges by countless corporate and political entities in recent years were always baffling. How could the United States or much of the industrialized world reach “net zero” emissions without destroying modern living?

As a reminder, “net zero” is a term coined to illustrate a goal of “eliminating greenhouse gas emissions produced by human activities, which is accomplished by decreasing global emissions and abating them from the atmosphere,” as defined by Net0.com, a company that describes itself as “the market leader in AI-First Sustainability, enabling governments and enterprises worldwide to enhance their environmental performance and decarbonize profitably.”

Net0 posits that “the global scientific community agrees that to mitigate the most severe impacts of climate change, we must reduce worldwide net human-generated carbon dioxide emissions by approximately 45 percent from their 2010 levels by the year 2030 and achieve net zero emissions by around 2050.”

In a political atmosphere shaming anyone who didn’t join the climate cult – led in the U.S. by the Biden administration and globally by the U.N. – attempting to outdo each other for the most aggressive “net zero” policy was all the rage.

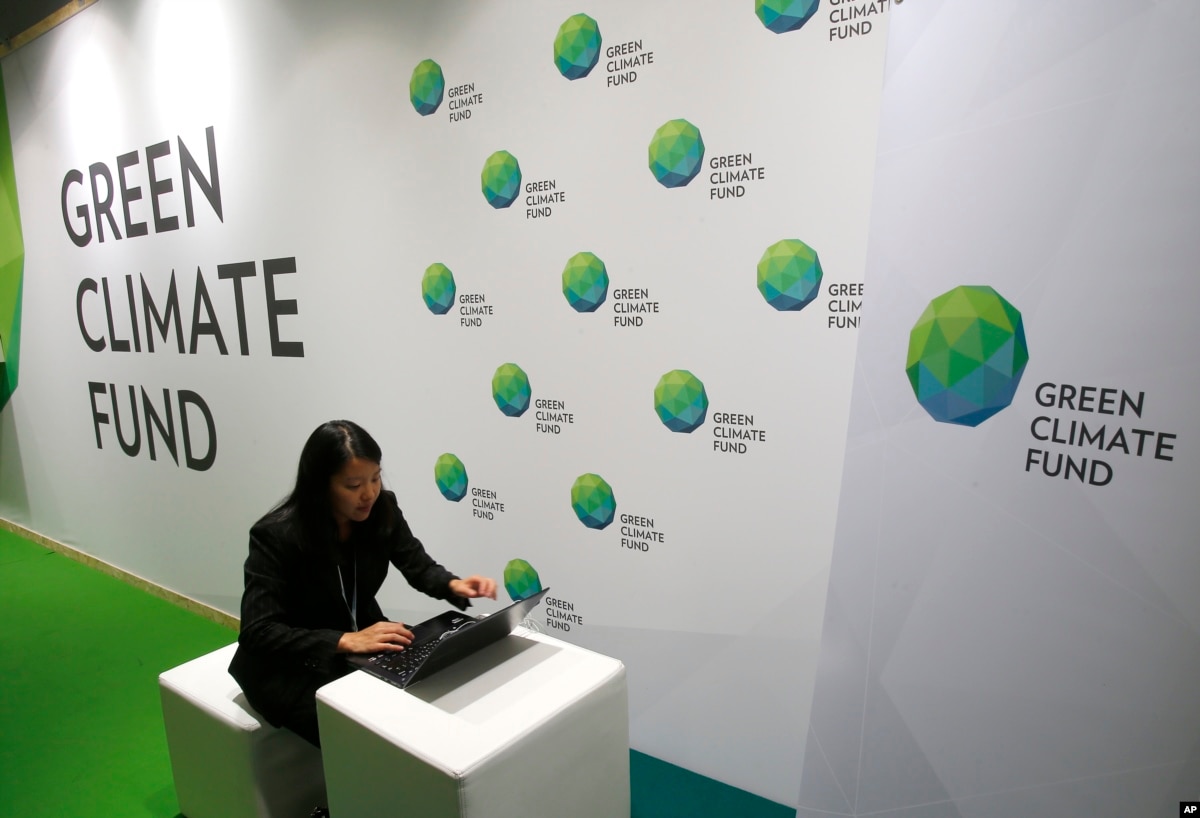
“As of June 2024, 107 countries… had adopted net-zero pledges either in law, in a policy document such as a national climate action plan or a long-term strategy, or in an announcement by a high-level government official,” boasted the United Nations.

More than 9,000 companies, over 1,000 cities, more than 1,000 educational institutions, and over 600 financial institutions have joined the Race to Zero, pledging to take rigorous, immediate action to halve global emissions by 2030.”

But as politicians know, promises and actions are often unrelated. Most people endowed with even a modicum of common sense and a grade-school understanding of basic science knew that meeting “net zero” goals would require a reduction in the use of our most affordable, effective and reliable energy sources to a degree that would devastate modern economies.

The fact that “net zero” pledges were nothing but a cruel joke was made clear last month in a story by NPR headlined,Leaders promised to cut climate pollution, then doubled down on fossil fuels.” Most thinking people were as surprised by that headline as by discovering wet water, hot fire or flying birds. It was not necessary to read further. “Of course,” they said to themselves, moving on to the next story.

But there are, sadly, climate cult converts who, in their shock, likely needed more details.

They discovered: “The world is producing too much coal, oil and natural gas to meet the targets set 10 years ago under the Paris Agreement, in which countries agreed to limit climate pollution and avoid the worst effects of global warming,” NPR reported.  The story said:

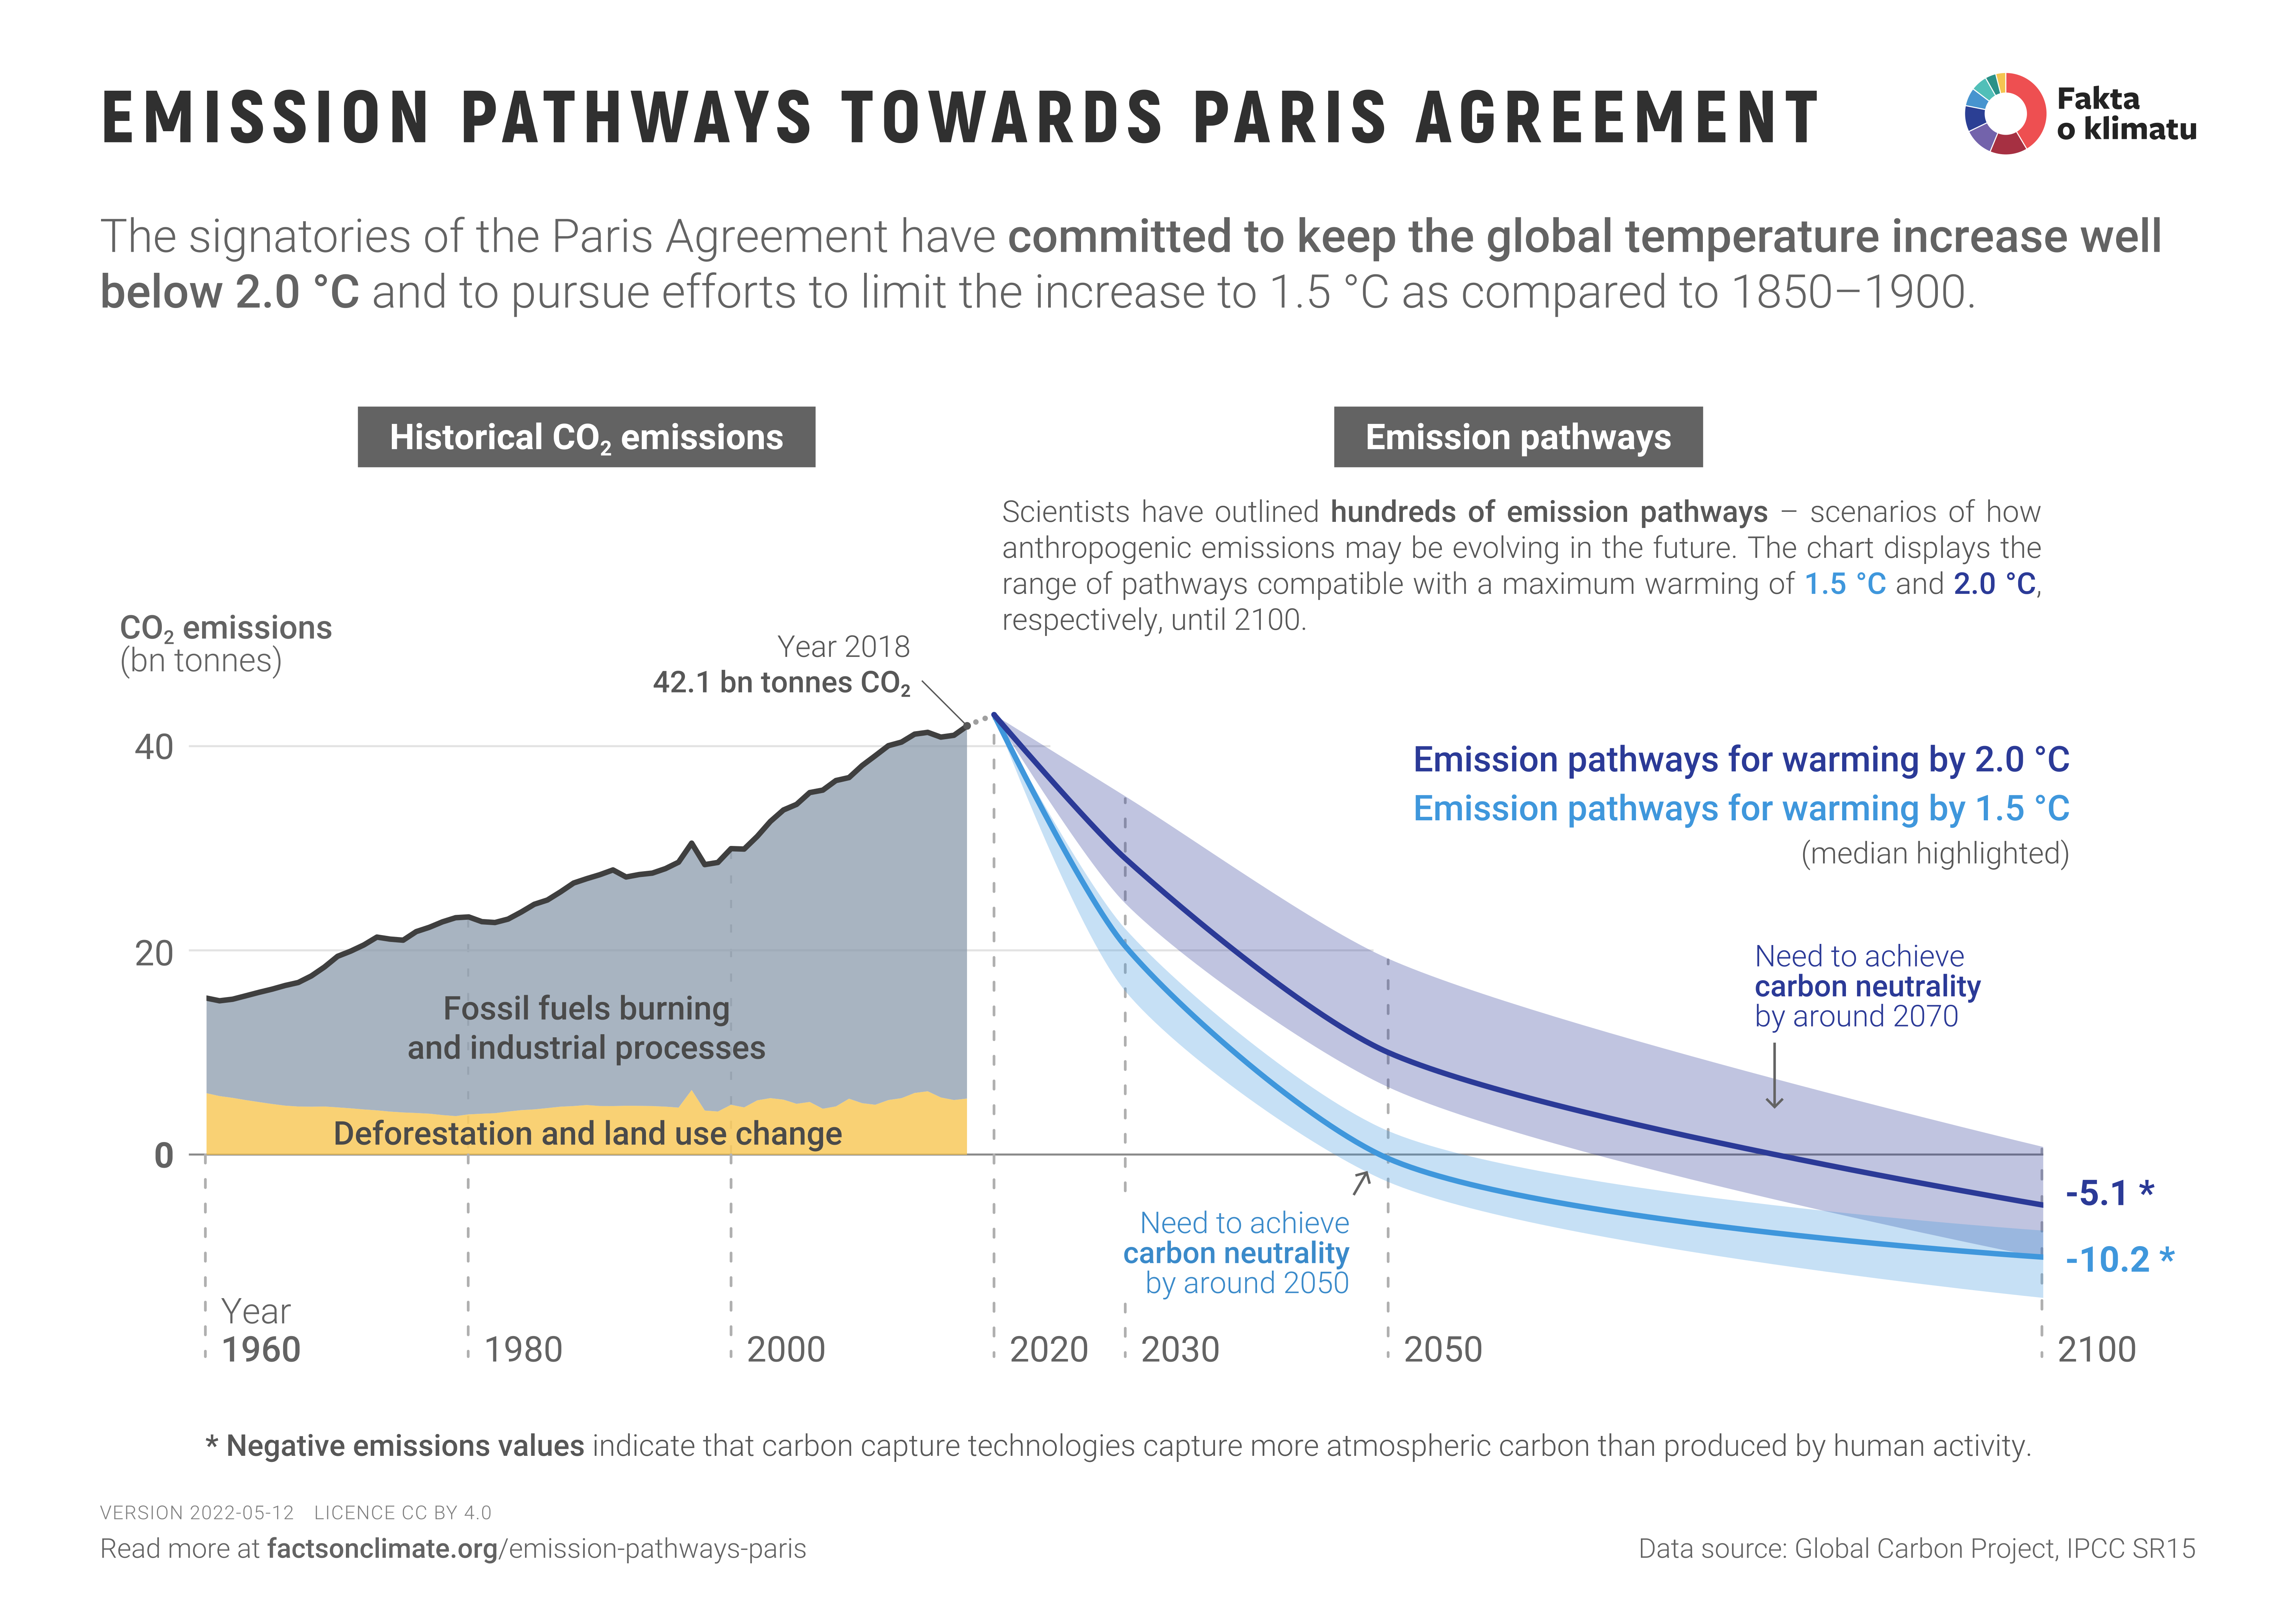
“A new report, led by the nonprofit research group Stockholm Environment Institute, shows countries plan to produce more than twice the amount of fossil fuels in 2030 than would be consistent with limiting global heating to 1.5 degrees Celsius (2.7 degrees Fahrenheit).”

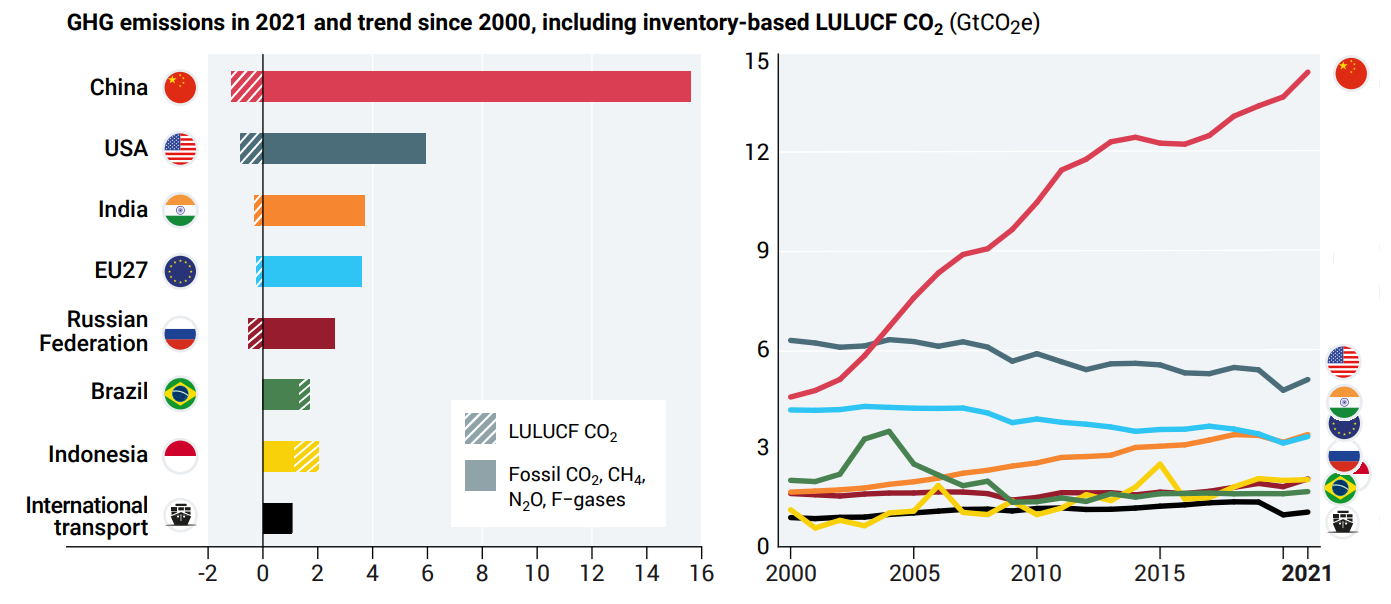
For the true believers, here’s the real punch to the gut: “The SEI report shows the 20 most polluting countries, including China, the U.S. and India, actually plan to produce even more fossil fuels than they did two years ago, when the report was last updated.”

Of course, as he did in his first term, President Trump is pulling the U.S. out of the Paris Agreement as he unleashes American industry and works to ensure energy affordability, independence and security for the nation. Legislation to roll back taxpayer subsidies for “renewables” and return to “reliables” has already been passed or introduced in various states and is soon likely to be fortified at the federal level.

After wasting billions of tax dollars on wind and solar subsidies that could have been directed toward schools, healthcare or other real needs, the fever is finally breaking. The world is slowly but surely awakening from the delusions of climate zealots who insisted that we were on the verge of catastrophe with constantly worsening weather disasters.

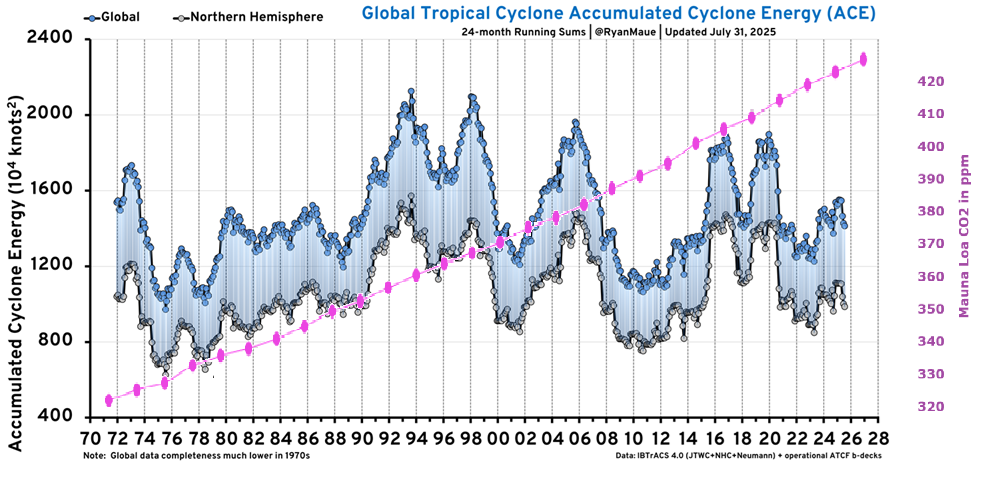
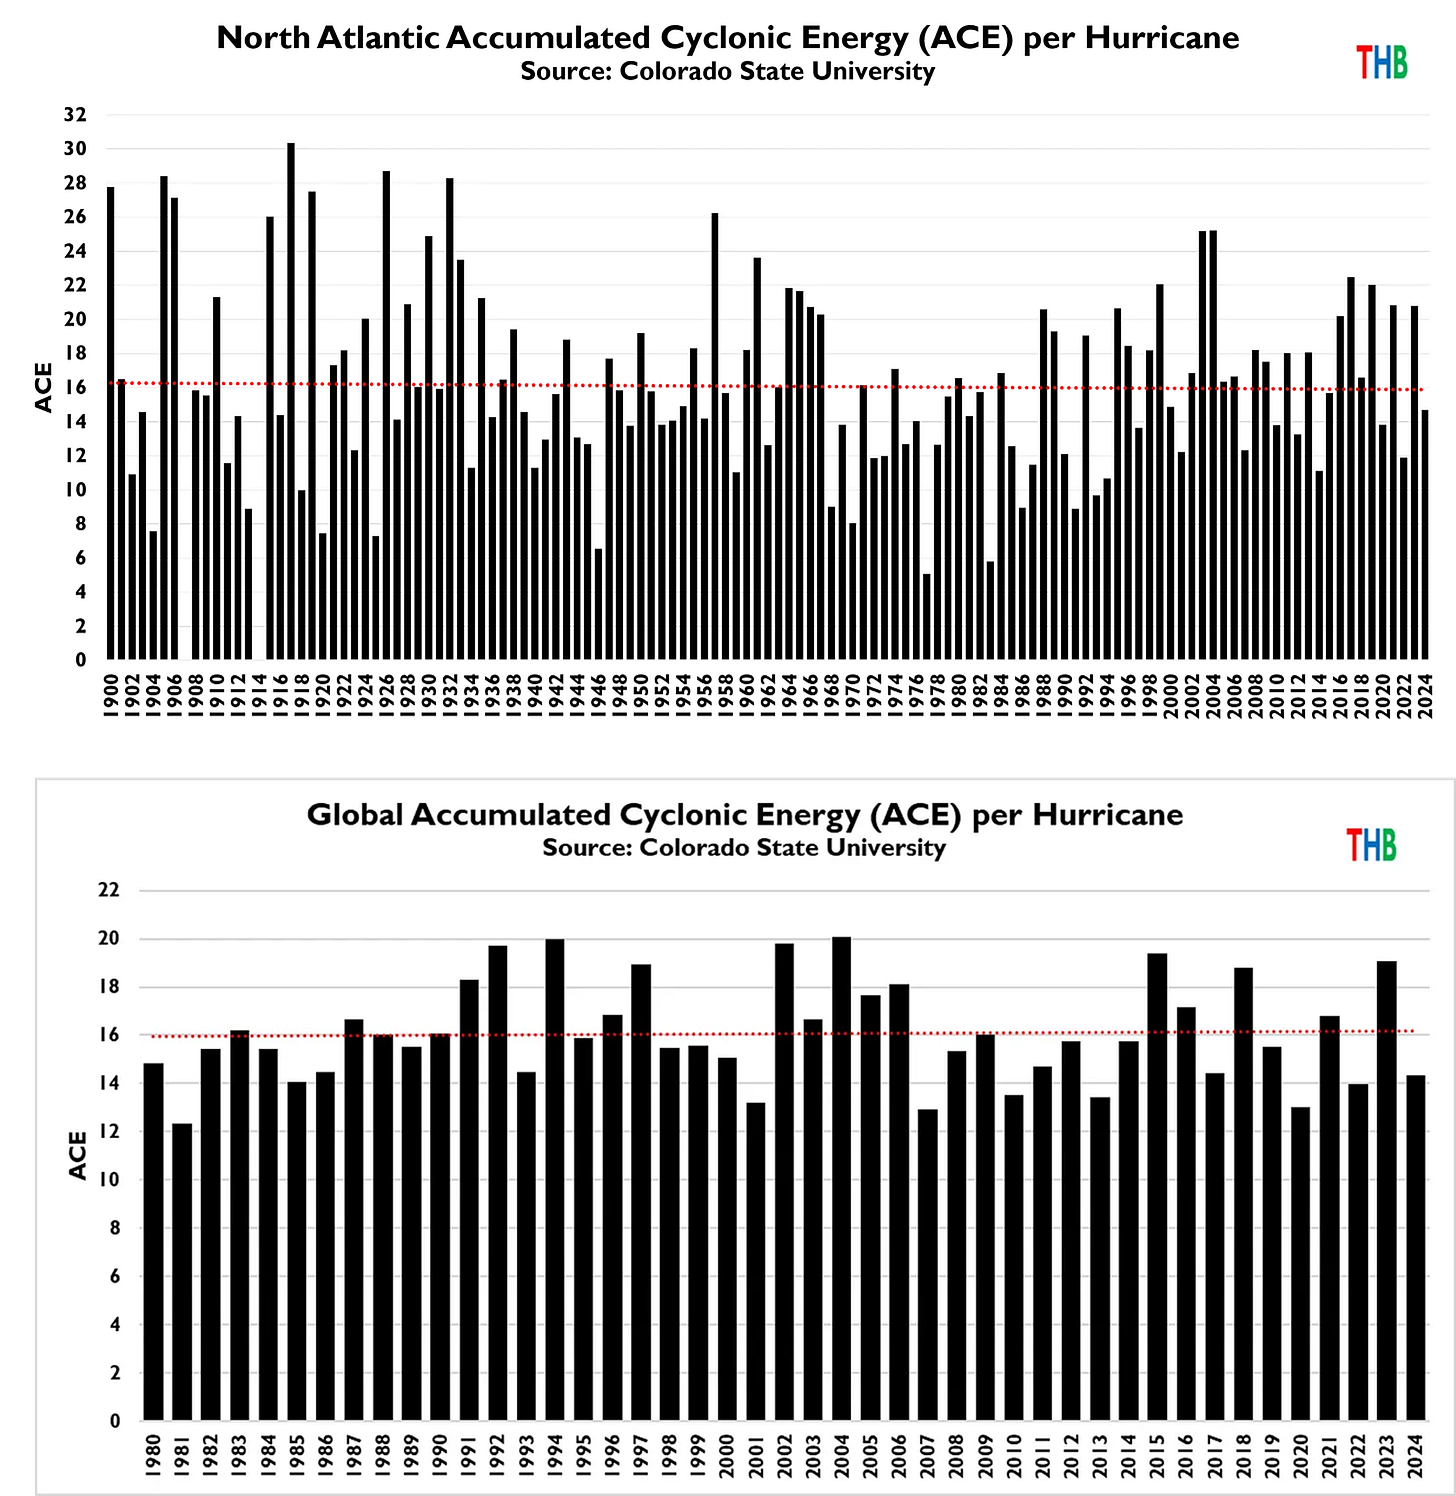
Just last May, for example, NOAA the National Oceanic and Atmospheric Administration predicted an “above-normal 2025 Atlantic hurricane season.” And just a few months earlier, PBS NewsHour reported on a study showing that “human-caused climate change made Atlantic hurricanes about 18 miles per hour (29 kilometers per hour) stronger in the last six years.”

The message was clear. More hurricanes.
Stronger hurricanes. This year’s reality so far?

“The 2025 Atlantic hurricane season is the first time in 10 years that a hurricane has not made landfall in the United States through the end of September,” according to American Press. While “hurricane season” extends through November, September is usually the busiest month.

The weather is – and has always been – unpredictable. Severe weather events like hurricanes, tornadoes, monsoons, floods, blizzards and drought have always been with us, and always will. The attempt to demonize humankind for the frequency and severity of the weather has been politically motived and economically disastrous.

“Net zero” pledges are being revealed for the false promises they most often were, designed mainly to win plaudits from the Lecturing Left. For leaders grounded in facts, real-world needs have always meant that no one is easing off the gas.

2. Vaclav Smil’s paper is at Fraser Institute Halfway between Kyoto and 2050.  Overview and keynote section are reprinted below with my bolds and added images.

      Contents
Executive Summary
Introduction
1. Carbon in the Biosphere
2. Energy Transitions
3. Our Record So Far
4. What It Would Take to Reverse the Past Emission Trend
5. The Task Ahead: Zero Carbon Electricity and Hydrogen
6. Costs, Politics, and Demand
7. Realities versus Wishful Thinking
8. Closing Thoughts
Executive Summary

♦  This essay evaluates past carbon emission reduction and the feasibility of eliminating fossil fuels to achieve net-zero carbon by 2050.

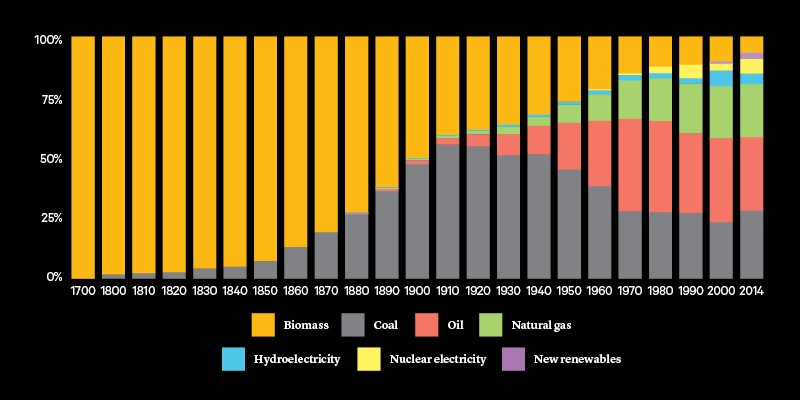
♦  Despite international agreements, government spending and regulations, and technological advancements, global fossil fuel consumption surged by 55 percent between 1997 and 2023.  And the share of fossil fuels in global energy consumption has only decreased from nearly 86 percent in 1997 to approximately 82 percent in 2022.

♦  The first global energy transition, from traditional biomass fuels such as wood and charcoal to fossil fuels, started more than two centuries ago and unfolded gradually.

♦  That transition remains incomplete, as billions of people still rely on traditional biomass energies for cooking and heating.

♦  The scale of today’s energy transition requires approximately 700 exajoules of new non-carbon energies by 2050, which needs about 38,000 projects the size of BC’s Site C or 39,000 equivalents of Muskrat Falls.

♦  Converting energy-intensive processes (e.g., iron smelting, cement, and plastics) to non-fossil alternatives requires solutions not yet available for largescale use.

♦  The energy transition imposes unprecedented demands for minerals including copper and lithium, which require substantial time to locate and develop mines.

♦  To achieve net-zero carbon, affluent countries will incur costs of at least 20 percent of their annual GDP.

♦  While global cooperation is essential to achieve decarbonization by 2050, major emitters such as the United States, China, and Russia have conflicting interests.

♦  To eliminate carbon emissions by 2050, governments face unprecedented technical, economic and political challenges, making rapid and inexpensive transition impossible.

7. Realities versus Wishful Thinking

Since the world began to focus on the need to end the combustion of fossil fuels, we have not made the slightest progress in the goal of absolute global decarbonization: emission declines in many affluent countries were far smaller than the increased consumption of coal and hydrocarbons in the rest of the world, a trend that has also reflected the continuing deindustrialization in Europe and North America and the rising shares of carbon-intensive industrial production originating in Asia. As a result, by 2023 the absolute reliance on fossil carbon rose by 54 percent worldwide since the Kyoto commitment. Moreover, a significant part of emission declines in many affluent countries has been due to their deindustrialization, to transferring some of their carbon-intensive industries abroad, above all to China.

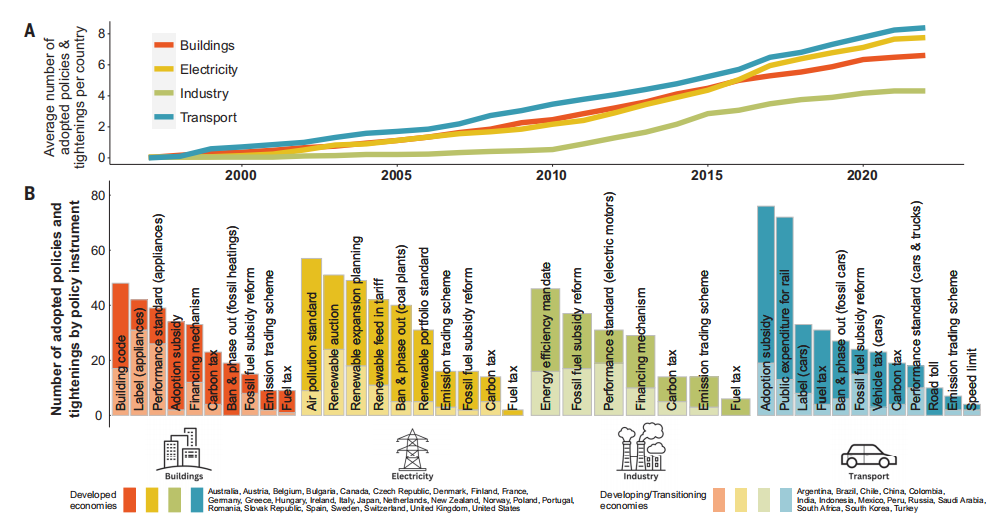
A recent international analysis of 1500 climate policies around the world concluded that 63 or 4% of them were successful in reducing emissions.

Denmark, with half of its electricity now coming from wind, is often pointed out as a particular decarbonization success: since 1995 it cut its energy-related emissions by 56 percent (compared to the EU average of about 22 percent)—but, unlike its neighbours, the country does not produce any major metals (aluminum, copper, iron, or steel), it does not make any float glass or paper, does not synthesize any ammonia, and it does not even assemble any cars. All these products are energy-intensive, and transferring the emissions associated with their production to other countries creates an undeservedly green reputation for the country doing the transferring.

Given the fact that we have yet to reach the global carbon emission peak (or a plateau) and considering the necessarily gradual progress of several key technical solutions for decarbonization (from large-scale electricity storage to mass-scale hydrogen use), we cannot expect the world economy to become carbon free by 2050. The goal may be desirable, but it remains unrealistic. The latest International Energy Agency World Energy Outlook report confirms that conclusion. While it projects that energy-related CO2 emissions will peak in 2025, and that the demand for all fossil fuels will peak by 2030, it also anticipates that only coal consumption will decline significantly by 2050 (though it will still be about half of the 2023 level), and that the demand for crude oil and natural gas will see only marginal changes by 2050 with oil consumption still around 4 billion tons and natural gas use still above 4 trillion cubic meters a year (IEA, 2023d).

Wishful thinking or claiming otherwise should not be used or defended by saying that doing so represents “aspirational” goals. Responsible analyses must acknowledge existing energy, material, engineering, managerial, economic, and political realities. An impartial assessment of those resources indicates that it is extremely unlikely that the global energy system will be rid of all fossil carbon by 2050. Sensible policies and their vigorous pursuit will determine the actual degree of that dissociation, which might be as high as 60 or 65 percent. More and more people are recognizing these realities, and fewer are swayed by the incessant stream of miraculously downward-bending decarbonization scenarios so dear to demand modelers.

Long-term global energy forecasts offering numbers for overall demand or supply and for shares contributed by specific sources or conversions are beyond our capability: the system is too complex and too open to unforeseen but profound perturbations for such specificity. However, skepticism in constructing long-term estimates will lessen the extent of inevitable errors. Here is an example of a realistic 2023 forecast done by Norwegian risk management company DNV that has been echoed recently by other realistic assessments. After noting that global energy-related emissions are still climbing (but might peak in 2024 when the transition would effectively begin) it concludes that by 2050 we will move from the present roughly 80 percent fossil/20 percent non-fossil split to a 48 percent/52 percent ratio by 2050, with primary energy from fossil fuels declining by nearly two-thirds but still remaining at about 314 EJ by 2050—in other words, about as high as it was in 1995 (DNV, 2023).

Again, that is what any serious student of global energy transitions would expect. Individual components change at different speeds and notably rapid transformations are possible, but the overall historical pattern quantified in terms of primary energies is one of gradual changes. Unfortunately, modern forecasting in general and the anticipation of energy advances in particular have an unmistakable tendency toward excessive optimism, exaggeration, and outright hype (Smil, 2023b). During the 1970s many people believed that by the year 2000 all electricity would come not just from fission, but from fast breeder reactors, and soon afterwards came the promises of “soft energy” taking over (Smil, 2000).

Belief in near-miraculous tomorrows never goes away. Even now we can read declarations claiming that the world can rely solely on wind and PV by 2030 (Global100REStrategyGroup, 2023). And then there are repeated claims that all energy needs (from airplanes to steel smelting) can be supplied by cheap green hydrogen or by affordable nuclear fusion. What does this all accomplish besides filling print and screens with unrealizable claims? Instead, we should devote our efforts to charting realistic futures that consider our technical capabilities, our material supplies, our economic possibilities, and our social necessities—and then devise practical ways to achieve them. We can always strive to surpass them—a far better goal than setting ourselves up for repeated failures by clinging to unrealistic targets and impractical visions.
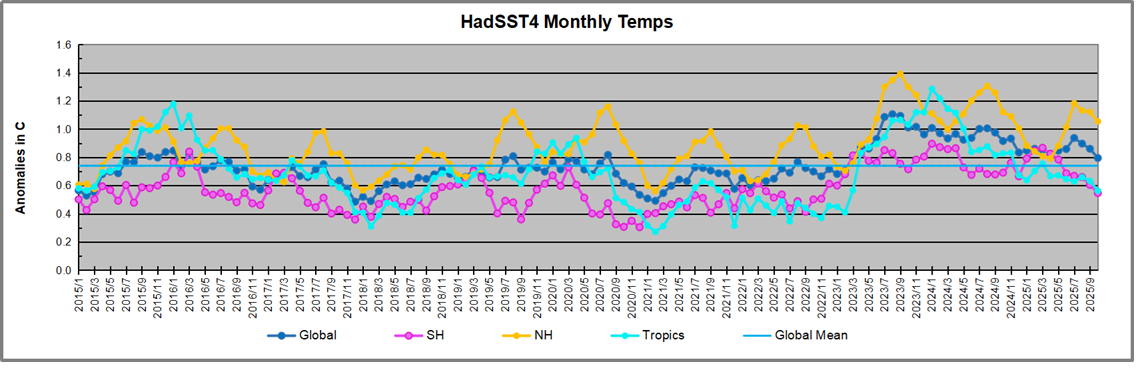
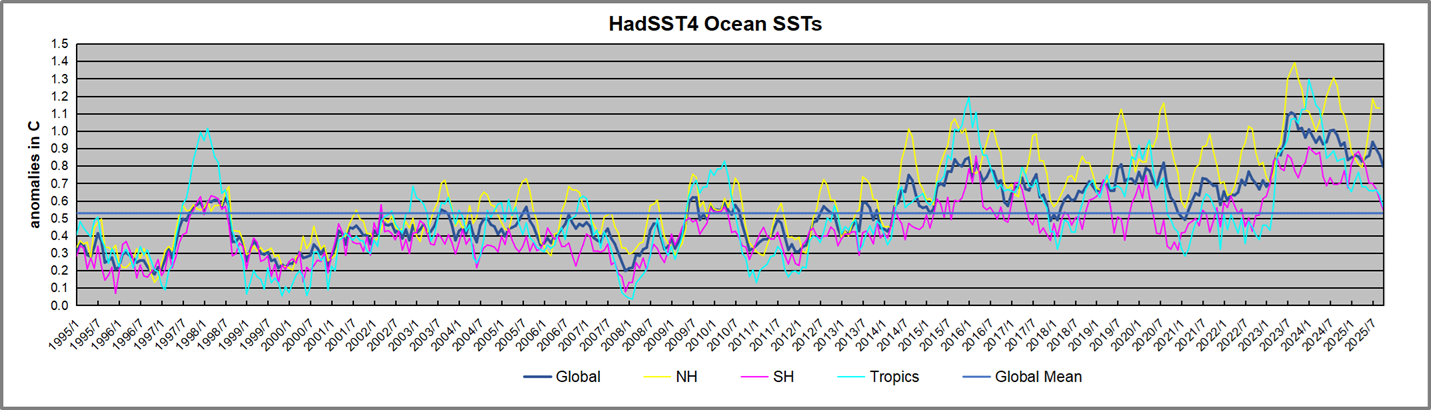
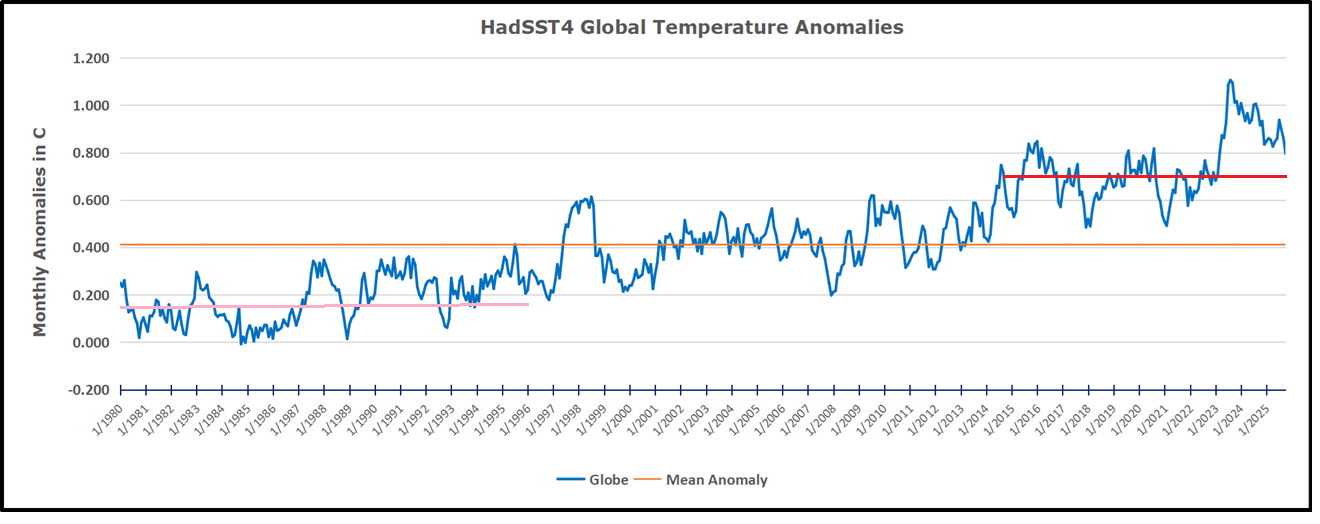
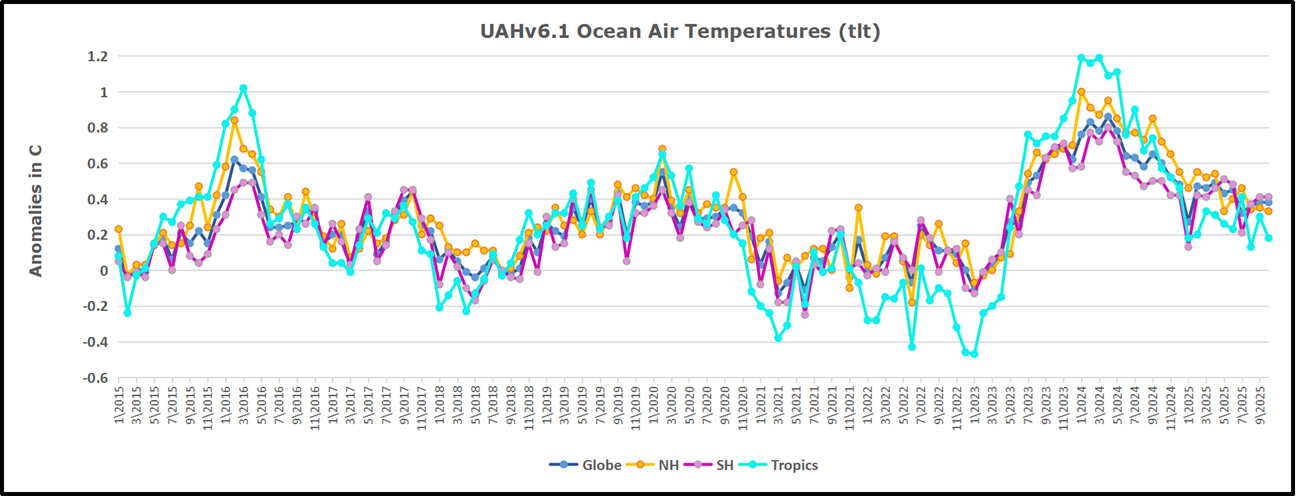
 

US Nuclear Power Revival

Duggan Flanakin writes at Real Clear Energy Data Centers, Trump Spark U.S. Nuclear Revival.  Excerpts in italics with my bolds and added images.

With a strong push from the Trump White House, for the first time since Three Mile Island, the nuclear energy industry in the U.S. is bullish about its future. It’s about time, given that the average existing U.S. nuclear power plant was built based on 1980s technology.

A major reason for the virtual standstill in nuclear energy development in the U.S. was the Nuclear Regulatory Commission’s near-maniacal effort to reassure a skittish public that they would not issue permits to any nuclear power plant that had the potential for public harm.

The shot heard round the world signaling a change in U.S. nuclear energy policy was the summary firing of NRC Commissioner Christopher Hanson, whose divinity school background may have contributed to a perception he viewed his job as more a gatekeeper for regulatory control than a partner in building a U.S. nuclear future.  As Senate Environment and Public Works Committee chair Shelley Moore Capito (R, WV) said,

“For decades, the NRC took too long, cost too much, and did not have a predictable and efficient process to approve new licenses or modernize outdated regulations.” 

Newly installed NRC Chair David Wright has called the Trump directives not “just regulatory reform” but a “cultural transformation that positions the NRC to be a forward-leaning, risk-informed regulator for the future.” The agency’s internal culture is being reshaped into a more efficient and modern agency without sacrificing public safety, Wright said.

Several MEPs (mainly Greens) hold up anti-nuclear posters at the debate.

But it’s not just the NRC that is being transformed. Under presidents from Carter to Biden, nuclear was largely relegated to the closet as the primary focus was the media-driven “green energy” crusade. Wind and solar permits were issued without the cleanup requirements and prepayments mandatory for nuclear and fossil fuel facilities. Nuclear was deemed “dirty.”

The first Trump term was so mangled by political infighting (both intra-party and cross-party) that any real nuclear energy agenda lay buried among the lawsuits. In the interim, however, artificial intelligence made giant leaps and the demand for electric power for fast-growing data centers was exploding. Wind and solar cannot be relied upon by entities dependent upon 24/7/365 power – and nuclear is still viewed as the “cleaner” option vis-à-vis natural gas.

Even before Trump’s reelection, tech giants were busily signing nuclear energy deals to power their data centers. Last September the owner of the long-shuttered Three Mile Island Unit 1 nuclear power plant announced plans to restart operations in 2027, thanks to a 20-year power purchase agreement with Microsoft for a nearby AI data center.

Last October Amazon and Google both announced they would be investing in small modular reactors for AI data centers. Two months later Meta said it planned to follow suit. The amazing thing is the uncertainty that the SMR manufacturers will be able to deliver as quickly and as affordably as the tech giants demand. The simple reason? They have no track record yet. But energy demand is so high that waiting is not an option.

In the last few weeks, what was already a fast train picked up even more speed. On October 16 the U.S. Army unveiled its next-generation nuclear power Janus Program for the deployment of small modular reactors to support national defense installations and critical missions. Commercial microreactor manufacturers will partner with the Army’s Defense Innovation Unit with a goal of an operating reactor by September 30, 2028.

On October 26, Hyundai Engineering & Construction announced a basic design contract with Fermi America to construct four large nuclear reactors on a 8.1-square-mile property outside Amarillo, Texas. The Hyundai-designed AP1000 nuclear reactors will generate 4 GW for the HyperGrid complex, the world’s largest integrated energy and AI campus. The 11-GW project also includes 2 GW from small modular reactors, 4 GW from gas combined cycle plants, and 1 GW from solar and battery storage systems.

The integrated license application for the $500 billion project, the brainchild of former Energy Secretary Rick Perry and Fermi co-founder Toby Neugebauer, is currently under expedited review by the NRC. Meanwhile, Hyundai E&C is working on design tasks and preparations for the main construction phase, with finalization anticipated for an engineering, procurement, and construction (EPC) contract by spring 2026.

On October 28, Westinghouse Electric Co. joined Cameco Corporation and Brookfield Asset Management in a new strategic partnership with the U.S. government to accelerate the deployment of nuclear power. The government has committed to construction of at least $80 billion of new reactors using Westinghouse’s nuclear reactor technology to reinvigorate the U.S. nuclear power industrial base.

The government says this partnership will facilitate the growth and future of the U.S. nuclear power industry and the supporting supply chain. The entire project, which will deploy two-unit Westinghouse AP1000 reactors, is expected to create more than 100,000 construction jobs and support or sustain 45,000 manufacturing and engineering jobs across 43 states.

The AP300 SMR is a single-loop, 300-MWe pressurized water reactor that utilizes identical systems to the larger AP1000 reactor.

These are only a sampling of the active and planned contracts for nuclear power plant construction that have sprung out of the unplowed ground with the change in philosophy at the NRC and the White House. All systems are brightly lit green – but obstacles remain in the road.

Even with greatly shortened licensing timeframes, it will take time to complete site designs, obtain permits and licenses, and begin delivering much needed electricity to tech giants and other customers. Yet the biggest problem may be finding enough nuclear fuel at affordable prices to meet the mushrooming demand.

One option, says Curio CEO Ed McGinnis, is recognizing that spent nuclear fuel (including that from nuclear weapons) can safely be turned into fresh usable nuclear fuel and valuable rare metals and materials (like rhodium, palladium, krypton-85, and americium-241).

The Department of Energy’s Advanced Research Projects Agency-Energy (ARPA-E) recent research and development in the advanced reactor technology space. Source: DOE

U.S. production of uranium oxide in 2024 jumped exponentially to 677,000 pounds from just 50,000 pounds in 2023, and exploration and development activities in 2023 were the highest in a decade. On a down note, anti-nuclear activists have been waging a campaign to shut down the White Mesa Mill in Utah that processes uranium ore – and in the U.S. today only about 5% of nuclear fuel has been processed domestically.

The nuclear fuel conundrum is but one of the obstacles in the path of the massive U.S. nuclear power industry growth that is also a vital component of the growth of AI data centers and other emerging electricity-hungry technologies that are shaping our future. But all systems are go – and that is the giant step that had to be taken first.

Placing Melissa in History

Climatic media has fallen in love with Melissa, many of them blaming “climate change”, i.e. CO2 for her strength and destructive power.  No surprise that Imperial College London (who foisted its covid pandemic models upon us) reports that its IRIS model confirms a “rapid attribution” claim.  No doubt there will be more such yada yada at Belem COP to stir up the faithful.

For the rest of us, let’s remember the saying attributed to George Santayana: “Those who cannot remember the past are condemned to repeat it.”  For example, Melissa belongs to a class of stong Atlantic hurricanes going back almost a century.  Here’s a table of them along with peak sustained winds and the CO2 levels at the time.

Peak Wind CO2 Level
Hurricane Year mph ppm
“Cuba” 1932 175 308
“Labor Day” 1935 185 310
Janet 1955 175 314
Camille 1969 175 325
Anita 1977 175 334
David 1979 175 337
Allen 1980 190 339
Gilbert 1988 185 352
Andrew 1992 175 356
Mitch 1998 180 367
Wilma 2005 185 380
Rita 2005 180 380
Katrina 2005 175 380
Dean 2007 175 384
Felix 2007 175 384
Irma 2017 180 407
Maria 2017 175 407
Dorian 2019 185 411
Milton 2024 180 425
Melissa 2025 185 428

Note that all twenty hurricanes had winds ranging between 175 to 190 mph, going back to 1932.  Meanwhile CO2 has increased from 308 ppm to 428 (2025 ytd).  Note also the absence of such storms in the decade 2007 to 2017 despite CO2 adding 23 ppm in that period. The correlation between high wind speeds and CO2 concentrations is an insignificant 0.18.

Then there is the Global Accumulated Cyclone Energy (ACE) report that includes the effects of both minor and major storms, combining strength and frequency.

I added an overlay of CO2 to illustrate how unlikely is a link between CO2 and storms.  Finally from Roger Pielke Jr. a chart showing ACE strength per hurricane:

The charts show that 16 is the average ACE per hurricane, in North Atlantic since 1900 and Globally since 1980.  The trend is not upward, and in North Atlantic appears currently lower than the past.

See Also:

Devious Climate Attribution Studies