Arctic Shipping Update: NSR Freezes in 10 Days

The previous post below sounded the alarm about ice halting Arctic shipping early.  October 14, the two Northern Sea Route choke points are in place:  Chukchi (bottom left) blocking entrance to Bering sea, and Laptev (upper left) stopping traffic to European seas. By yesterday  Laptev and East Siberian seas are completely covered, each over 95% of last March max extents. Chukchi is at 50% with its coastline covered. Kara (top left) is also adding ice rapidly. Less obviously Canadian Archipelago (lower center) doubled in 10 days up to 300k km2.

The graph below shows October ice extents on average and for some notable years.

The October gain in ice extents averages ~3.5M km2 up to 8.6M km2.  It is the month adding the most ice each year.  2024 has recovered more slowly than usual or than 2023, tracking along with 2007. The re-freezing has accelerated in the last 10 days.

Ice-strengthened supramax Kumpula (Arc 4) on the NSR being escorted by nuclear icebreaker Vaygach. (Source: Courtesy of ESL Shipping)

The report comes from Malte Humpert at gCaptain  Early Winter Ice Halts Arctic Shipping Traffic Weeks Ahead of Schedule.  Excerpts in italics with my bolds.

The summer shipping window on Russia’s Northern Sea Route is coming to a rapid close weeks ahead of schedule. A number of vessels and convoys are rushing to complete their transits before the route shuts down in the next three weeks.

Source: Northern Sea Route Information Office

Unlike the last couple of summers when Russia’s Arctic coastal waterways were fully clear of sea ice, residual winter ice persisted in the eastern section this year. This has resulted in the early onset of ice formation especially in the Laptev, East Siberian, and Chukchi Seas.

NSRIO: Ice is still present in the eastern sector of the NSR preventing free passage of ships without ice class. The nuclear icebreaker Sibir has been operating in the East Siberian and Chukchi Seas since the end of June together with the nuclear icebreaker Vaygach, which has been in the area since mid-July. In several areas of the Chukchi and East Siberian Seas heavy ice conditions are still observed, which directly affects the admission of low ice class vessels to these areas. The western part of the NSR is mostly ice-free. Above is a map of ice conditions as of August 7, 2024.

Russia’s Northern Sea Route Administration announced that vessels with no ice class will have to vacate the waterway by October 15, around 2-3 weeks ahead of schedule. For vessels with light and medium ice classifications the navigation season will end on October 20 and October 31 respectively.

The last permitted start of convoys heading east will be October 10, leaving just one more week for vessels to begin their Arctic transit.

This year’s early shutdown comes three years after narrowly avoiding a major incident three years ago. In October 2021 Russian authorities reacted too late to begin closing down the NSR as winter sea ice drifted into the main shipping channel and trapped two dozen vessels for more than a month. A 30 centimeter or one foot thick ice layer had formed by the end of October across hundreds of miles of Arctic Ocean.
 
Several icebreakers, including the powerful nuclear vessel Yamal, rushed to the scene from Murmansk over 3,000 nautical miles away to help free the stranded vessels. Over the course of more than 6 weeks several icebreakers worked to break the vessels free and escort them to safety out of the eastern section of the Northern Sea Route. The situation did not fully resolve until the end of December when the last vessels were freed.

Vessels stuck in thick winter sea ice in November 2021 awaiting rescue. (Source: Rosatomflot)

Currently a number of container ships, oil tankers, bulk carriers
and LNG tankers are passing through the route.

In the Far East two LNG carriers and two oil tankers, including the Suezmax tanker Sai Baba, are currently passing through the waters adjacent to the Bering Strait. They are staying clear of multi-year ice around Wrangel Island which has persisted and troubled shipping all summer. A nuclear icebreaker had remained on standby for much of the summer keeping the shipping lane open.

Select container ships, crude oil tankers, and bulk and LNG carriers currently on the NSR. (Source: Shipatlas)

Further west along the route, the first-ever conventional Panamax container ship in the Arctic is about halfway through its transit. The vessel had originally intended to also conduct its return voyage via the Arctic, but will now likely have to return to Asia via the Suez Canal or South Africa route.

A massive Capesize bulk carrier without any ice class, Dodo, is also rushing to complete its eastbound voyage to Caofeidian, China.


Arctic Shipping Update: NSR Flash Freezing

The previous post below sounded the alarm about ice halting Arctic shipping early.  Now the two choke points are blocked nine days later. Chukchi sea (left) is blocking entrance to Bering sea.  Laptev (right) is blocking traffic into European Barents and Kara seas.

Ice-strengthened supramax Kumpula (Arc 4) on the NSR being escorted by nuclear icebreaker Vaygach. (Source: Courtesy of ESL Shipping)

The report comes from Malte Humpert at gCaptain  Early Winter Ice Halts Arctic Shipping Traffic Weeks Ahead of Schedule.  Excerpts in italics with my bolds.

The summer shipping window on Russia’s Northern Sea Route is coming to a rapid close weeks ahead of schedule. A number of vessels and convoys are rushing to complete their transits before the route shuts down in the next three weeks.

Source: Northern Sea Route Information Office

Unlike the last couple of summers when Russia’s Arctic coastal waterways were fully clear of sea ice, residual winter ice persisted in the eastern section this year. This has resulted in the early onset of ice formation especially in the Laptev, East Siberian, and Chukchi Seas.

NSRIO: Ice is still present in the eastern sector of the NSR preventing free passage of ships without ice class. The nuclear icebreaker Sibir has been operating in the East Siberian and Chukchi Seas since the end of June together with the nuclear icebreaker Vaygach, which has been in the area since mid-July. In several areas of the Chukchi and East Siberian Seas heavy ice conditions are still observed, which directly affects the admission of low ice class vessels to these areas. The western part of the NSR is mostly ice-free. Above is a map of ice conditions as of August 7, 2024.

Russia’s Northern Sea Route Administration announced that vessels with no ice class will have to vacate the waterway by October 15, around 2-3 weeks ahead of schedule. For vessels with light and medium ice classifications the navigation season will end on October 20 and October 31 respectively.

The last permitted start of convoys heading east will be October 10, leaving just one more week for vessels to begin their Arctic transit.

This year’s early shutdown comes three years after narrowly avoiding a major incident three years ago. In October 2021 Russian authorities reacted too late to begin closing down the NSR as winter sea ice drifted into the main shipping channel and trapped two dozen vessels for more than a month. A 30 centimeter or one foot thick ice layer had formed by the end of October across hundreds of miles of Arctic Ocean.
 
Several icebreakers, including the powerful nuclear vessel Yamal, rushed to the scene from Murmansk over 3,000 nautical miles away to help free the stranded vessels. Over the course of more than 6 weeks several icebreakers worked to break the vessels free and escort them to safety out of the eastern section of the Northern Sea Route. The situation did not fully resolve until the end of December when the last vessels were freed.

Vessels stuck in thick winter sea ice in November 2021 awaiting rescue. (Source: Rosatomflot)

Currently a number of container ships, oil tankers, bulk carriers
and LNG tankers are passing through the route.

In the Far East two LNG carriers and two oil tankers, including the Suezmax tanker Sai Baba, are currently passing through the waters adjacent to the Bering Strait. They are staying clear of multi-year ice around Wrangel Island which has persisted and troubled shipping all summer. A nuclear icebreaker had remained on standby for much of the summer keeping the shipping lane open.

Select container ships, crude oil tankers, and bulk and LNG carriers currently on the NSR. (Source: Shipatlas)

Further west along the route, the first-ever conventional Panamax container ship in the Arctic is about halfway through its transit. The vessel had originally intended to also conduct its return voyage via the Arctic, but will now likely have to return to Asia via the Suez Canal or South Africa route.

A massive Capesize bulk carrier without any ice class, Dodo, is also rushing to complete its eastbound voyage to Caofeidian, China.

Here’s ice activity in last week in the NSR from Chukchi Sea in the east (left side), and threatening in Laptev Sea (right).

Arctic Ice In Perspective 2024

With Arctic ice melting season winding down, warmists again stoked fears about ice disappearing in the North. In fact, the pattern of Arctic ice seen in historical perspective is not alarming. People are over-thinking and over-analyzing Arctic Ice extents, and getting wrapped around the axle (or should I say axis).  So let’s keep it simple and we can all readily understand what is happening up North.

I have noticed at some other blogs people complain about my monthly Arctic ice updates focusing on extents starting in 2007. This post will show why that time period is entirely reasonable as a subject for analysis. I will use the ever popular NOAA dataset derived from satellite passive microwave sensors.  It sometimes understates the ice extents, but everyone refers to it and it is complete from 1981 to present.  Here’s what NOAA reports (in M km2):

We are frequently told that only the March maximums and the September minimums matter, since the other months are only transitional between the two.  So the graph above shows the mean ice extent, averaging the two months March and September.  The data comes from Sea Ice Index (SII).

If I were adding this to the Ice House of Mirrors, the name would be The X-Ray Ice Mirror, because it looks into the structure of the time series.   For even more clarity and simplicity, here is the table:

NOAA NH Annual Average Ice Extents (in M km2).  Sea Ice Index v3.0 (here)

Year Average Change Rate of Change
1981 11.385    
1997 11.077 -0.308 -0.019 per year
2007 9.405 -1.672 -0.167 per year
2024 9.626  +0.221 +0.013 per year

The satellites involve rocket science, but this does not.  There was a small loss of ice extent over the first 16 years, then a dramatic downturn for 10 years, 9 times the rate as before. That was followed by the current 17-year plateau with a slight gain comparable to the beginning loss.  All the fuss is over that middle period, and we know what caused it.  A lot of multi-year ice was flushed out through the Fram Strait, leaving behind more easily melted younger ice. The effects from that natural occurrence bottomed out in 2007.

Kwok et al say this about the Variability of Fram Strait ice flux:

The average winter area flux over the 18-year record (1978–1996) is 670,000 km2, ;7% of the area of the Arctic Ocean. The winter area flux ranges from a minimum of 450,000 km2 in 1984 to a maximum of 906,000 km2 in 1995. . .The average winter volume flux over the winters of October 1990 through May 1995 is 1745 km3 ranging from a low of 1375 km3 in the 1990 flux to a high of 2791 km3 in 1994.

https://www.researchgate.net/publication/261010602/download

Conclusion:

Some complain it is too soon to say Arctic Ice is recovering, or that 2007 is a true change point.  The same people were quick to jump on a declining period after 1996 as evidence of a “Death Spiral.”

Footnote:

No one knows what will happen to Arctic ice.

Except maybe the polar bears.

And they are not talking.

Except, of course, to the admen from Coca-Cola


Arctic Shipping Ends Early Due to Growing Ice

Ice-strengthened supramax Kumpula (Arc 4) on the NSR being escorted by nuclear icebreaker Vaygach. (Source: Courtesy of ESL Shipping)

The report comes from Malte Humpert at gCaptain  Early Winter Ice Halts Arctic Shipping Traffic Weeks Ahead of Schedule.  Excerpts in italics with my bolds.

The summer shipping window on Russia’s Northern Sea Route is coming to a rapid close weeks ahead of schedule. A number of vessels and convoys are rushing to complete their transits before the route shuts down in the next three weeks.

Source: Northern Sea Route Information Office

Unlike the last couple of summers when Russia’s Arctic coastal waterways were fully clear of sea ice, residual winter ice persisted in the eastern section this year. This has resulted in the early onset of ice formation especially in the Laptev, East Siberian, and Chukchi Seas.

NSRIO: Ice is still present in the eastern sector of the NSR preventing free passage of ships without ice class. The nuclear icebreaker Sibir has been operating in the East Siberian and Chukchi Seas since the end of June together with the nuclear icebreaker Vaygach, which has been in the area since mid-July. In several areas of the Chukchi and East Siberian Seas heavy ice conditions are still observed, which directly affects the admission of low ice class vessels to these areas. The western part of the NSR is mostly ice-free. Above is a map of ice conditions as of August 7, 2024.

Russia’s Northern Sea Route Administration announced that vessels with no ice class will have to vacate the waterway by October 15, around 2-3 weeks ahead of schedule. For vessels with light and medium ice classifications the navigation season will end on October 20 and October 31 respectively.

The last permitted start of convoys heading east will be October 10, leaving just one more week for vessels to begin their Arctic transit.

This year’s early shutdown comes three years after narrowly avoiding a major incident three years ago. In October 2021 Russian authorities reacted too late to begin closing down the NSR as winter sea ice drifted into the main shipping channel and trapped two dozen vessels for more than a month. A 30 centimeter or one foot thick ice layer had formed by the end of October across hundreds of miles of Arctic Ocean.
 
Several icebreakers, including the powerful nuclear vessel Yamal, rushed to the scene from Murmansk over 3,000 nautical miles away to help free the stranded vessels. Over the course of more than 6 weeks several icebreakers worked to break the vessels free and escort them to safety out of the eastern section of the Northern Sea Route. The situation did not fully resolve until the end of December when the last vessels were freed.

Vessels stuck in thick winter sea ice in November 2021 awaiting rescue. (Source: Rosatomflot)

Currently a number of container ships, oil tankers, bulk carriers
and LNG tankers are passing through the route.

In the Far East two LNG carriers and two oil tankers, including the Suezmax tanker Sai Baba, are currently passing through the waters adjacent to the Bering Strait. They are staying clear of multi-year ice around Wrangel Island which has persisted and troubled shipping all summer. A nuclear icebreaker had remained on standby for much of the summer keeping the shipping lane open.

Select container ships, crude oil tankers, and bulk and LNG carriers currently on the NSR. (Source: Shipatlas)

Further west along the route, the first-ever conventional Panamax container ship in the Arctic is about halfway through its transit. The vessel had originally intended to also conduct its return voyage via the Arctic, but will now likely have to return to Asia via the Suez Canal or South Africa route.

A massive Capesize bulk carrier without any ice class, Dodo, is also rushing to complete its eastbound voyage to Caofeidian, China.

Here’s ice activity in last week in the NSR from Chukchi Sea in the east (left side), and threatening in Laptev Sea (right).

18 yr. Plateau September Arctic Ice 2024

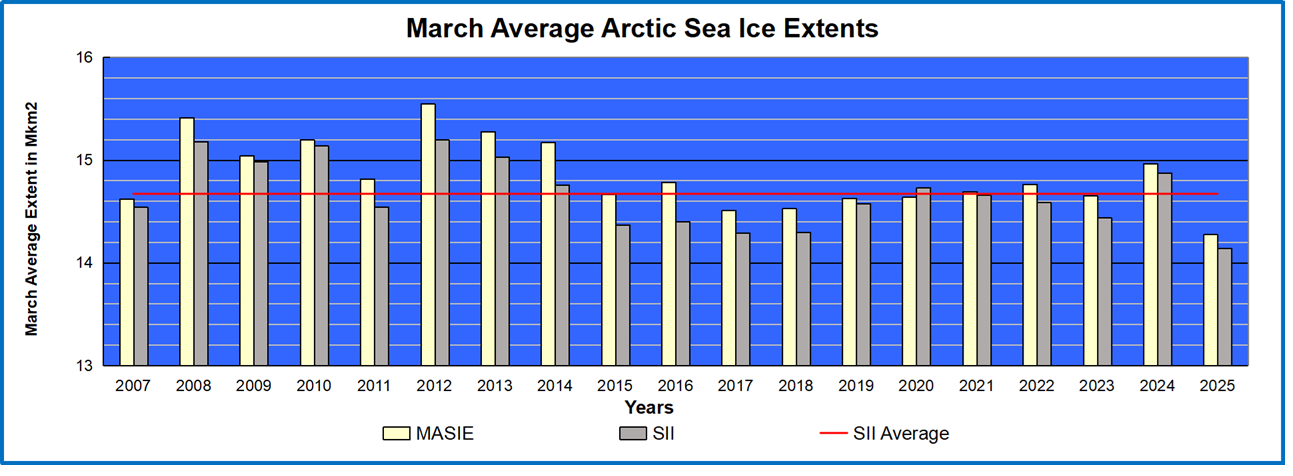
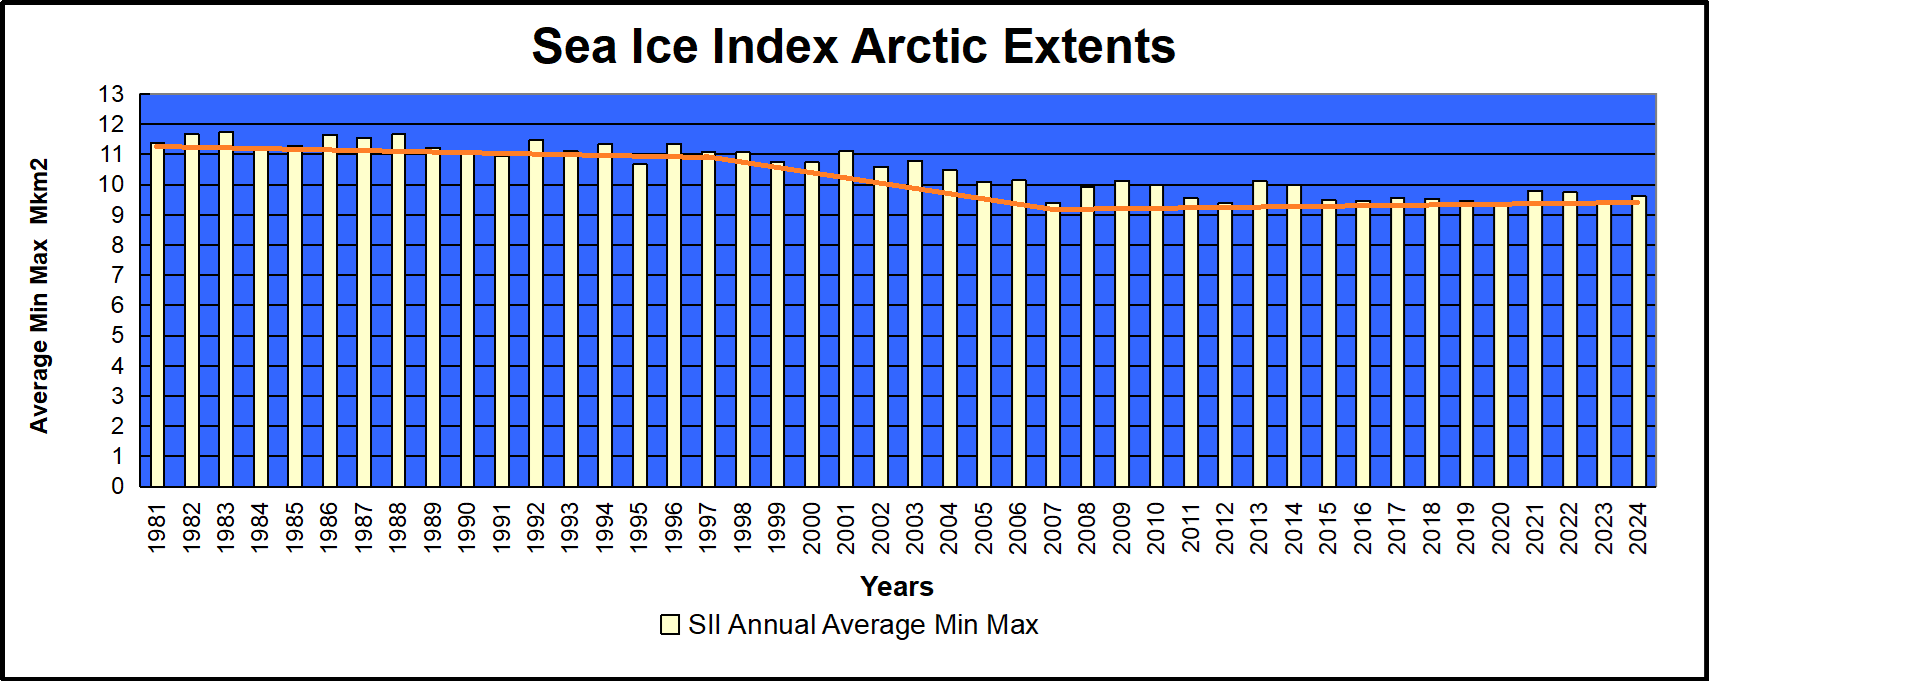
September daily extents are now fully reported and the 2024 September monthly results can be compared with those of the previous 17 years.  MASIE showed 2024 at 4.6M km2  and SII was slightly lower, reaching 4.4M for the month.  Analysis below shows that the 2024 annual Minimum month was 75k km2 lower than the 18 year average, and was 256 km2 greater than 2007.  The 18 yr. trendlines are virtually flat and matching the averages of 4.6M km2 for the period since 2007.

In August, 4.27M km2 was the median estimate (range 4.11 to 4.54) for the September monthly average extent from the SIPN (Sea Ice Prediction Network) who use the reports from SII (Sea Ice Index), the NASA team satellite product from passive microwave sensors. The SII actual ice extent average was ~100k km2 higher than estimated.

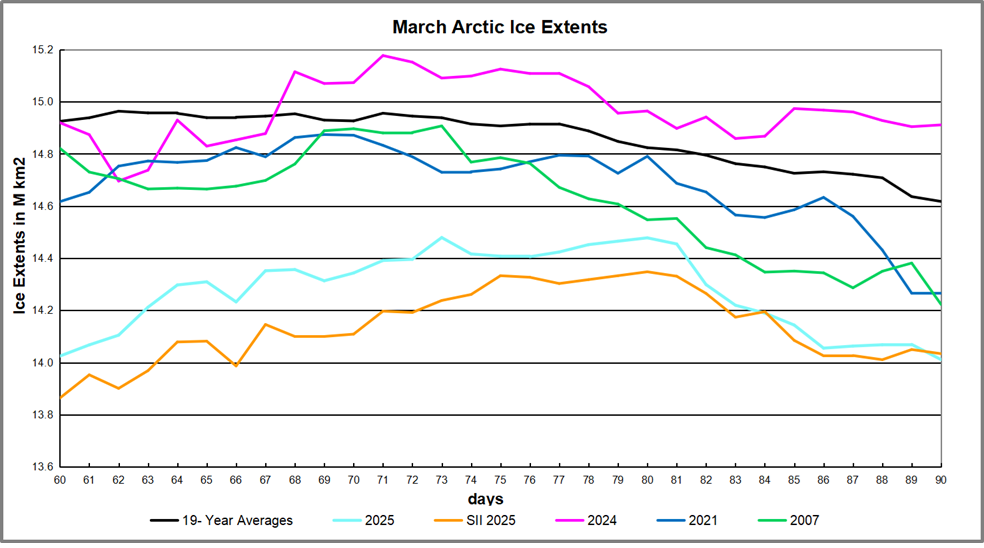
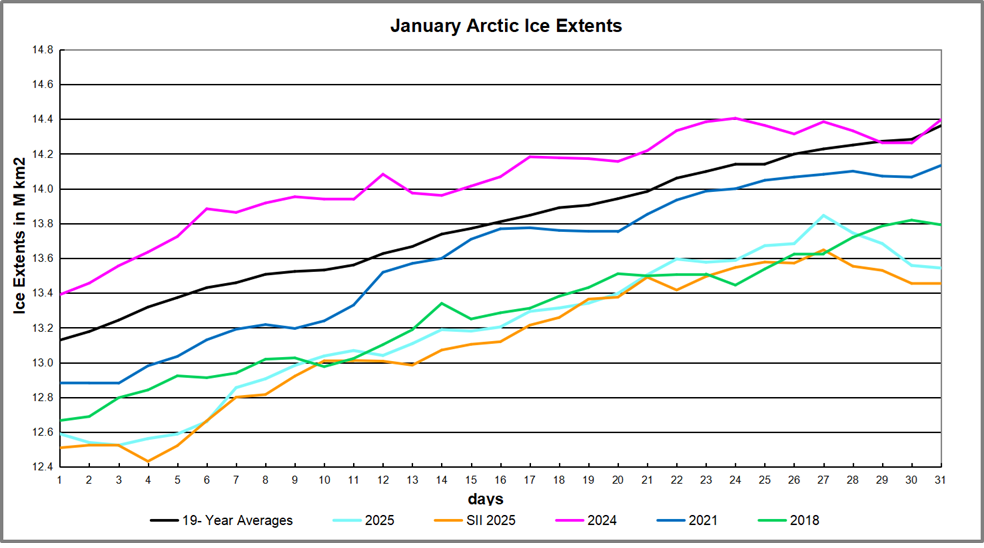
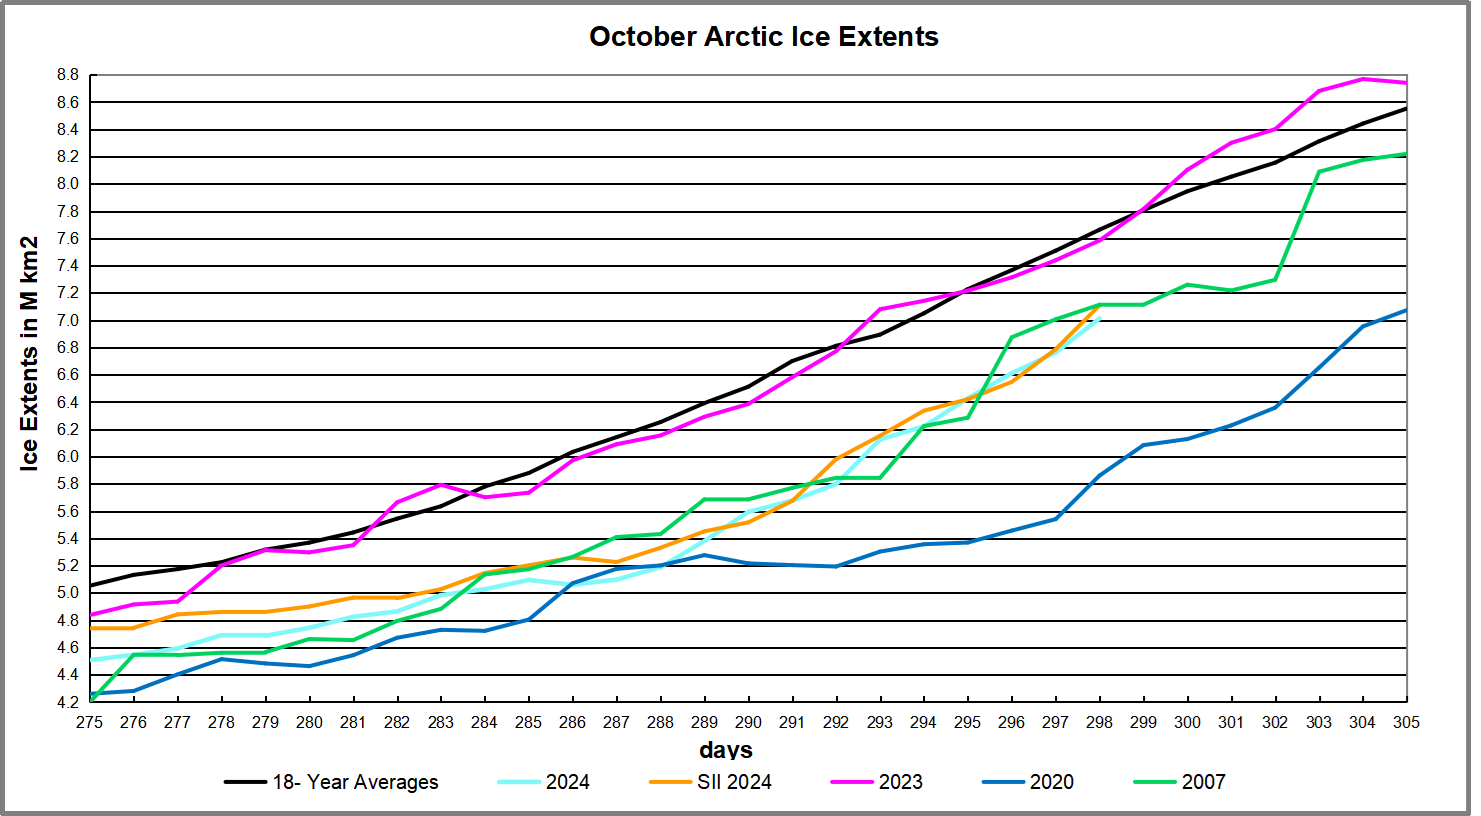
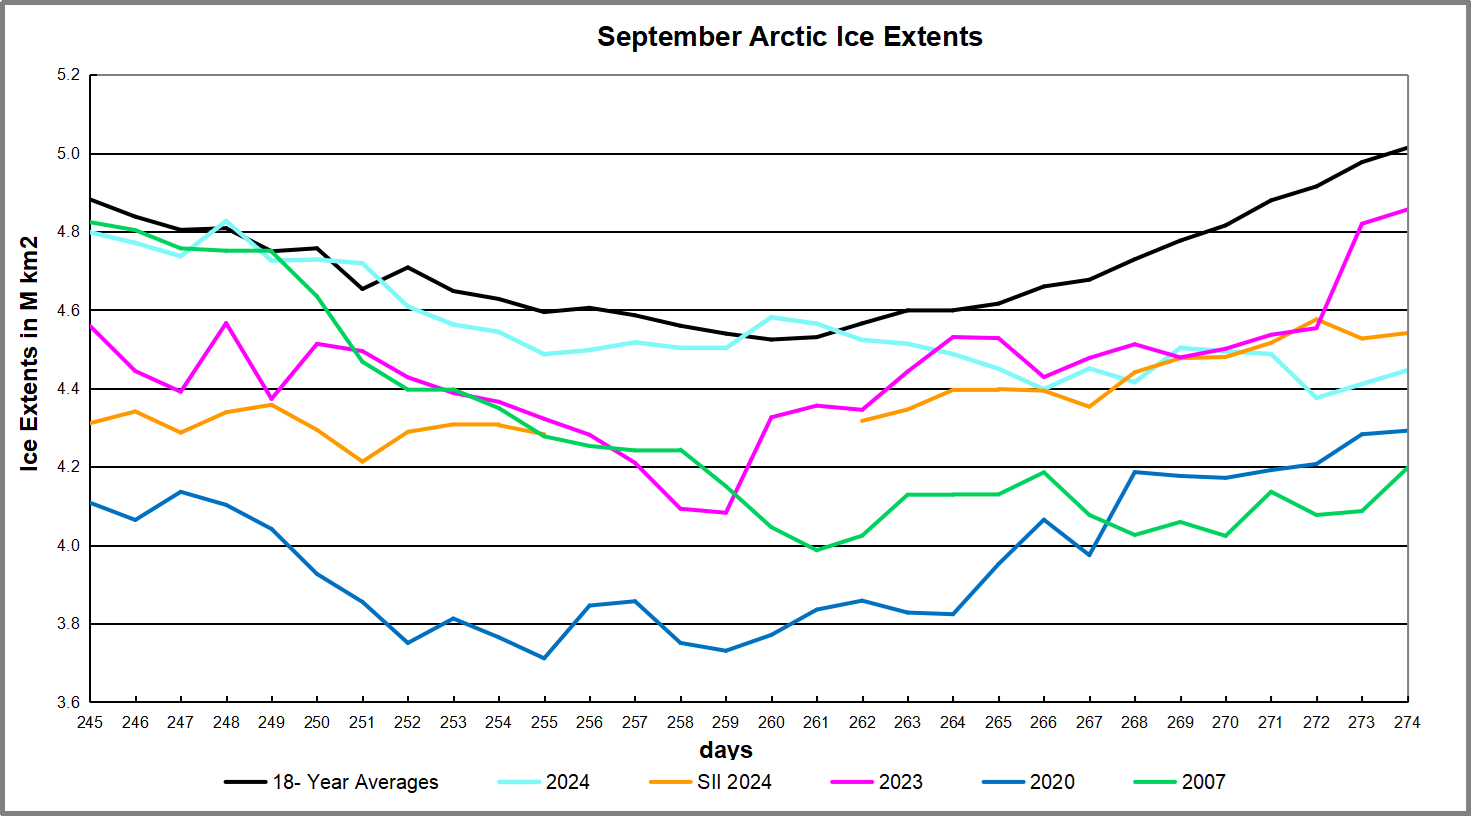
The graph below shows September comparisons through day 274 (Sept. 30).

The graph has some unusual things to note. The typical September is shown by the black line, which reaches the daily minimum on day 260 and ends the month ~100k km2 higher than the beginning. 2024 was unusual by matching average the first half, appearing on day 255 to hit minimum, then going above average on day 260.  Surprisingly, the last two weeks MASIE showed a steady loss of ice extent down to a minimum on day 272, and recovering the last two days.  Instead of a slight gain, MASIE showed September 2024 losing ~400k km2 by month end.

2007 also started matching average, but went down steeply losing more than half a wadham below average on day 261, then recovering slightly but ending ~800k km2 below average on day 274.

The orange line shows SII starting much lower than MASIE, then the dataset is missing six days mid month. Finally, ice extents rise above MASIE by the end, reaching ~200k km2 above the SII month beginning. I calculated the monthly average for SII from the data provided, though the official number may differ once it is reported.

The table shows ice extents in the regions for 2024, 18 year averages and 2007 for day 274. Averages refer to 2006 through 2023 inclusive.

Region 2024274 Day 274 Ave 2024-Ave. 2007274 2024-2007
 (0) Northern_Hemisphere 4446117 5013499 -567382 4196873 249243
 (1) Beaufort_Sea 280737 564271 -283534 503548 -222811
 (2) Chukchi_Sea 350261 214302 135958 1065 349196
 (3) East_Siberian_Sea 320409 307838 12571 311 320098
 (4) Laptev_Sea 207220 169745 37475 237446 -30226
 (5) Kara_Sea 339 39310 -38971 15857 -15518
 (6) Barents_Sea 0 15734 -15734 4851 -4851
 (7) Greenland_Sea 163963 250200 -86237 353210 -189247
 (8) Baffin_Bay_Gulf_of_St._Lawrence 38141 57714 -19573 51770 -13629
 (9) Canadian_Archipelago 112998 388756 -275757 302221 -189223
 (10) Hudson_Bay 0 3062 -3062 1936 -1936
 (11) Central_Arctic 2968286 3001441 -33155 2723382.15 244904

The major deficits are in Beaufort, Greenland sea and Canadian Archipelago. Only Chukchi shows an offsetting surplus.  Overall, the NH ice extent is 567k km2 or 11% below average.

Summary

Earlier observations showed that Arctic ice extents were low in the 1940s, grew thereafter up to a peak in 1977, before declining.  That decline was gentle until 1996 which started a decade of multi-year ice loss through the Fram Strait.  There was also a major earthquake under the north pole in that period.  In any case, the effects and the decline ceased in 2007, 30 years after the previous peak.  Now we have a plateau in ice extents, which could be the precursor of a growing phase of the quasi-60 year Arctic ice oscillation.

Background 

A commenter previously asked, where do they get their data? The answer is primarily from NIC’s Interactive Multisensor Snow and Ice Mapping System (IMS). From the documentation, the multiple sources feeding IMS are:

Platform(s) AQUA, DMSP, DMSP 5D-3/F17, GOES-10, GOES-11, GOES-13, GOES-9, METEOSAT, MSG, MTSAT-1R, MTSAT-2, NOAA-14, NOAA-15, NOAA-16, NOAA-17, NOAA-18, NOAA-N, RADARSAT-2, SUOMI-NPP, TERRA

Sensor(s): AMSU-A, ATMS, AVHRR, GOES I-M IMAGER, MODIS, MTSAT 1R Imager, MTSAT 2 Imager, MVIRI, SAR, SEVIRI, SSM/I, SSMIS, VIIRS

Summary: IMS Daily Northern Hemisphere Snow and Ice Analysis

The National Oceanic and Atmospheric Administration / National Environmental Satellite, Data, and Information Service (NOAA/NESDIS) has an extensive history of monitoring snow and ice coverage.Accurate monitoring of global snow/ice cover is a key component in the study of climate and global change as well as daily weather forecasting.

The Polar and Geostationary Operational Environmental Satellite programs (POES/GOES) operated by NESDIS provide invaluable visible and infrared spectral data in support of these efforts. Clear-sky imagery from both the POES and the GOES sensors show snow/ice boundaries very well; however, the visible and infrared techniques may suffer from persistent cloud cover near the snowline, making observations difficult (Ramsay, 1995). The microwave products (DMSP and AMSR-E) are unobstructed by clouds and thus can be used as another observational platform in most regions. Synthetic Aperture Radar (SAR) imagery also provides all-weather, near daily capacities to discriminate sea and lake ice. With several other derived snow/ice products of varying accuracy, such as those from NCEP and the NWS NOHRSC, it is highly desirable for analysts to be able to interactively compare and contrast the products so that a more accurate composite map can be produced.

The Satellite Analysis Branch (SAB) of NESDIS first began generating Northern Hemisphere Weekly Snow and Ice Cover analysis charts derived from the visible satellite imagery in November, 1966. The spatial and temporal resolutions of the analysis (190 km and 7 days, respectively) remained unchanged for the product’s 33-year lifespan.

As a result of increasing customer needs and expectations, it was decided that an efficient, interactive workstation application should be constructed which would enable SAB to produce snow/ice analyses at a higher resolution and on a daily basis (~25 km / 1024 x 1024 grid and once per day) using a consolidated array of new as well as existing satellite and surface imagery products. The Daily Northern Hemisphere Snow and Ice Cover chart has been produced since February, 1997 by SAB meteorologists on the IMS.

Another large resolution improvement began in early 2004, when improved technology allowed the SAB to begin creation of a daily ~4 km (6144×6144) grid. At this time, both the ~4 km and ~24 km products are available from NSIDC with a slight delay. Near real-time gridded data is available in ASCII format by request.

In March 2008, the product was migrated from SAB to the National Ice Center (NIC) of NESDIS. The production system and methodology was preserved during the migration. Improved access to DMSP, SAR, and modeled data sources is expected as a short-term from the migration, with longer term plans of twice daily production, GRIB2 output format, a Southern Hemisphere analysis, and an expanded suite of integrated snow and ice variable on horizon.

http://www.natice.noaa.gov/ims/ims_1.html

Footnote

Some people unhappy with the higher amounts of ice extent shown by MASIE continue to claim that Sea Ice Index is the only dataset that can be used. This is false in fact and in logic. Why should anyone accept that the highest quality picture of ice day to day has no shelf life, that one year’s charts can not be compared with another year?

MASIE is rigorous, reliable, serves as calibration for satellite products, and continues the long and honorable tradition of naval ice charting using modern technologies. More on this at my post Support MASIE Arctic Ice Dataset


2024 Arctic Ice Abounds at Average Daily Minimum

The annual competition between ice and water in the Arctic ocean has reached the maximum for water, which typically occurs mid September.  After that, diminishing energy from the slowly setting sun allows oceanic cooling causing ice to regenerate. Those interested in the dynamics of Arctic sea ice can read numerous posts here.  This post provides a look at mid September from 2007 to yesterday as a context for understanding this year’s annual minimum.

The image above shows Arctic ice extents on day 260 (lowest annual daily extent on average) from 2007 to 2024 yesterday.  Obviously, the regions vary as locations for ice, discussed in more detail later on. The animation shows the ice deficits in years 2007, 2012, 2016, and 2020, as well as surplus years like 2010, 2014, 2022 and 2024.

Note that for climate purposes the annual minimum is measured by the September monthly average ice extent, since the daily extents vary and will go briefly lowest on or about day 260. In a typical year the overall ice extent will end September slightly higher than at the beginning.  2024 September ice extent averaged 4.6M over the first 16 days, and is likely to end the month with at least that amount for the entire month. For comparison, the 17 year average for Sept. 1-16 is 4.7M.

The melting season to mid September shows 2024 tracked lower than average but ended the period slightly above.

The graph above shows September daily ice extents for 2024 compared to 18 year averages, and some years of note. Day 260 has been the lowest daily ice extent on average for the last 18 years.

The black line shows on average Arctic ice extents during September decline 358k km2 down to 4.5M Km2 by day 260. The average increase from now on is 490k km2 up to 5.0M km2 end of September.  2024  tracked a little lower than the 18-year average in the second week reaching a low of 4.49M km2 on day 255, before going above average on day 260.

SII was reporting deficits as high as 0.5M km2 (half a Wadham) compared to  MASIE early in September.  For some reason, apparently data access issues, that dataset has not been updated for the last five days.  2023 bottomed out at 4.1M while 2007 daily minimum hit 4.0M, ended ~ 0.5M km2 in deficit to average and 535k km2 less than MASIE on day 260.  2020 ice on day 260 was ~740k km2 in deficit to average.

The main deficit to average is in CAA with a smaller loss in Chukchi, overcome by surpluses almost everywhere, especially in Central Arctic along with Laptev and Greenland seas. And as discussed below, the marginal basins have little ice left to lose.

The Bigger Picture 

We are close to the annual Arctic ice extent minimum, which typically occurs on or about day 260 (mid September). Some take any year’s slightly lower minimum as proof that Arctic ice is dying, but the image above shows the Arctic heart is beating clear and strong.

Over this decade, the Arctic ice minimum has not declined, but since 2007 looks like fluctuations around a plateau. By mid-September, all the peripheral seas have turned to water, and the residual ice shows up in a few places. The table below indicates where we can expect to find ice this September. Numbers are area units of Mkm2 (millions of square kilometers).

Day 260 17 year
Arctic Regions 2007 2010 2014 2016 2018 2020 2021 2022 2023 Average 2024
Central Arctic Sea 2.67 3.16 2.98 2.92 2.91 2.50 2.95 3.08 2.96 2.92 2.95
BCE 0.50 1.08 1.38 0.52 1.16 0.65 1.55 0.99 0.50 0.88 1.02
LKB 0.29 0.24 0.19 0.28 0.02 0.00 0.13 0.20 0.39 0.18 0.16
Greenland & CAA 0.56 0.41 0.55 0.45 0.41 0.59 0.50 0.43 0.44 0.47 0.39
B&H Bays 0.03 0.03 0.02 0.03 0.05 0.02 0.04 0.02 0.04 0.04 0.05
NH Total 4.05 4.91 5.13 4.20 4.56 3.76 5.17 4.73 4.33 4.49 4.58

The table includes some early years of note along with the last 4 years compared to the 17 year average for five contiguous arctic regions. BCE (Beaufort, Chukchi and East Siberian) on the Asian side are quite variable as the largest source of ice other than the Central Arctic itself.   Greenland Sea and CAA (Canadian Arctic Archipelago) together hold almost 0.5M km2 of ice at annual minimum, fairly consistently.  LKB are the European seas of Laptev, Kara and Barents, a smaller source of ice, but a difference maker some years, as Laptev was in 2016 and 2023.  Baffin and Hudson Bays are inconsequential as of day 260.

2024 extent of 4.58 is 1.3% over average, mainly due to surpluses in Chukchi and East Siberian seas.

For context, note that the average maximum has been 15M, so on average the extent shrinks to 30% of the March high (31% in 2022) before growing back the following winter.  In this context, it is foolhardy to project any summer minimum forward to proclaim the end of Arctic ice.

Resources:  Climate Compilation II Arctic Sea Ice

2024 Arctic Ice Beats 2007 by Half a Wadham

The graph above shows September daily ice extents for 2024 compared to 18 year averages, and some years of note. Day 260 has been the lowest daily ice extent on average for the last 18 years.

The black line shows on average Arctic ice extents during September decline 358k km2 down to 4.5M Km2 by day 260. The average increase from now on is 490k km2 up to 5.0M km2 end of September.  2024  tracked a little lower than the 18-year average in the second week reaching a low of 4.49M km2 on day 255, before going above average on day 260. 

SII was reporting deficits as high as 0.5M km2 (half a Wadham) compared to  MASIE early in September.  For some reason, that dataset has not been updated for the last five days.  2023 bottomed out at 4.1M while 2007 daily minimum hit 4.0M, ended ~ 0.5M km2 in deficit to average and 535k km2 less than MASIE on day 260.  2020 ice on day 260 was ~740k km2 in deficit to average.

Why is this important?  All the claims of global climate emergency depend on dangerously higher temperatures, lower sea ice, and rising sea levels.  The lack of additional warming prior to 2023 El Nino is documented in a post UAH June 2024: Oceans Lead Cool Down.

The lack of acceleration in sea levels along coastlines has been discussed also.  See Observed vs. Imagined Sea Levels 2023 Update.

Also, a longer term perspective is informative:

post-glacial_sea_levelThe table below shows the distribution of Sea Ice on day 260 across the Arctic Regions, on average, this year and 2007. At this point in the year, Bering and Okhotsk seas are open water and thus dropped from the table.

Region 2024260 Day 260 ave 2024-Ave. 2007260 2024-2007
 (0) Northern_Hemisphere 4581327 4524401 56926 4045776 535551
 (1) Beaufort_Sea 304967 491931 -186963 481384 -176416
 (2) Chukchi_Sea 360456 167361 193095 22527 337929
 (3) East_Siberian_Sea 353456 252958 100498 311 353145
 (4) Laptev_Sea 160792 135574 25218 235869 -75076
 (5) Kara_Sea 0 31612 -31612 44067 -44067
 (6) Barents_Sea 0 14610 -14610 7420 -7420
 (7) Greenland_Sea 165965 191196 -25230 333181 -167216
 (8) Baffin_Bay_Gulf_of_St._Lawrence 53126 29745 23381 26703 26423
 (9) Canadian_Archipelago 228869 274428 -45559 225526 3344
 (10) Hudson_Bay 1692 4595 -2903 2270 -578
 (11) Central_Arctic 2950861 2929452 21409 2665243.87 285617

The overall surplus to average is 57k km2, (1.3%).  The major deficit is in Beaufort, offset by large surpluses in Chukchi and East Siberian seas. 

bathymetric_map_arctic_ocean

Illustration by Eleanor Lutz shows Earth’s seasonal climate changes. If played in full screen, the four corners present views from top, bottom and sides. It is a visual representation of scientific datasets measuring ice and snow extents.

There is no charge for content on this site, nor for subscribers to receive email notifications of postings.


September Outlook Arctic Ice 2024

Figure 1. Distribution of SIO contributors for August estimates of September 2024 pan-Arctic sea-ice extent. No Heuristic methods were submitted in August. “Sun” is a public/citizen contribution. Image courtesy of Matthew Fisher, NSIDC.

2024: August Report from Sea Ice Prediction Network

The August 2024 Outlook received 24 pan-Arctic contributions (Figure 1). This year’s median
forecasted value for pan-Arctic September sea-ice extent is 4.27 million square kilometers with
an interquartile range of 4.11 to 4.54 million square kilometers. This is lower than the 2022 (4.83
million square kilometers) and 2023 (4.60 million square kilometers) August median forecasts
for September. . .This reflects relatively rapid ice loss during the month of July, resulting in August
Outlooks revising estimates downward. The lowest sea-ice extent forecast is 3.71 million square
kilometers, from the RASM@NPS submission); the highest sea-ice extent forecast is 5.23
million square kilometers, submitted by BCCR.

These are predictions for the September 2024 monthly average ice extent as reported by NOAA Sea Ice Index (SII). This post provides a look at the 2024 Year To Date (YTD) based on monthly averages comparing MASIE and SII datasets. (18 year average is 2006 to 2023 inclusive).

The graph puts 2024 into recent historical perspective. Note how 2024 was slightly above the 18-year average for the first 5 months, then tracked slightly lower to average through August. The outlier 2012 provided the highest March maximum as well as the lowest September minimum, coinciding with the Great Arctic Cyclone that year.  2007 began the period with the lowest minimum except for 2012.  SII 2024 started slightly higher than MASIE the first 3 months, then ran the same as MASIE until dropping in August 400k km2 below MASIE 2024 and also lower than 2007 and 2012.

The table below provides the monthly Arctic ice extent averages for comparisons (all are M km2)

Monthly MASIE 2024 SII 2024 MASIE -SII MASIE 2024-18 YR AVE SII 2024-18 YR AVE MASIE 2024-2007
Jan 14.055 13.917 0.139 0.280 0.333 0.293
Feb 14.772 14.605 0.167 0.096 0.152 0.121
Mar 14.966 14.873 0.093 0.111 0.199 0.344
Apr 14.113 14.131 -0.018 0.021 0.118 0.418
May 12.577 12.783 -0.207 -0.038 0.123 0.150
June 10.744 10.895 -0.151 -0.072 0.024 -0.082
July 8.181 7.884 0.297 -0.107 -0.160 0.188
Aug 5.617 5.214 0.404 -0.267 -0.423 0.033

The first two data columns are the 2024 YTD shown by MASIE and SII, with the MASIE surpluses in column three.  Column four shows MASIE 2024 compared to MASIE 18 year averages, while column five shows SII 2024 compared to SII 18 year averages.  YTD August MASIE and SII are below their averages, SII by nearly half a Wadham. The last column shows MASIE 2024 holding surpluses over 2007 most of the months, and nearly the same in August.

Summary

The experts involved in SIPN are expecting SII 2024 September to be much lower than 2023 and 2022, based largely on the large deficits SII is showing in July and August. The way MASIE is going, this September looks to be lower than its average, but much higher than SII.  While the daily minimum for the year occurs mid September, ice extent on September 30 is typically slightly higher than on September 1.

Footnote:

Some people unhappy with the higher amounts of ice extent shown by MASIE continue to claim that Sea Ice Index is the only dataset that can be used. This is false in fact and in logic. Why should anyone accept that the highest quality picture of ice day to day has no shelf life, that one year’s charts can not be compared with another year? Researchers do this, including Walt Meier in charge of Sea Ice Index. That said, I understand his interest in directing people to use his product rather than one he does not control. As I have said before:

MASIE is rigorous, reliable, serves as calibration for satellite products, and continues the long and honorable tradition of naval ice charting using modern technologies. More on this at my post Support MASIE Arctic Ice Dataset

MASIE: “high-resolution, accurate charts of ice conditions”
Walt Meier, NSIDC, October 2015 article in Annals of Glaciology.

August 2024 Arctic Ice, NOAA Missing Nearly Half a Wadham

The images above come from AARI (Arctic and Antarctic Research Institute) St. Petersburg, Russia. Note how the location of remaining ice at late August varies greatly from year to year.  The marginal seas are open water, including the Pacific basins, Canadian Bays (Hudson and Baffin), and the Atlantic basins for the most part.  Note ice extent fluctuations especially in Eurasian seas (lower right) and in Can-Am seas (upper right).  Notice the much greater ice extent in 2021 compared to 2018. As discussed later on, some regions retain considerable ice at the annual minimum, with differences year to year. [Note: Images prior to 2009 are in a different format.  AARI Charts are (here)

The annual competition between ice and water in the Arctic ocean is approaching the maximum for water, which typically occurs mid September.  After that, diminishing energy from the slowly setting sun allows oceanic cooling causing ice to regenerate. Those interested in the dynamics of Arctic sea ice can read numerous posts here.  This post provides a look at end of August from 2007 to yesterday as a context for anticipating this year’s annual minimum.  Note that for climate purposes the annual minimum is measured by the September monthly average ice extent, since the daily extents vary and will go briefly lowest on or about day 260. In a typical year the overall ice extent will end September slightly higher than at the beginning.

The melting season mid July to mid August shows 2024 melted at nearly the average rate, while retaining more ice extent at the end than some other recent years of note.

Firstly note that on average August shows ice declining 1.8M km2 down to 4.9M km2.  2024 started 288k km2 below average and on day 244 was only 98k km2 or 2% in deficit to average. The extents in Sea Ice Index in orange  were considerably lower during August, meaning that SII August 2024 monthly average will be ~400k km2 lower than MASIE., nearly half a Wadham.

The table for day 244 shows how large how the ice is distributed across the various seas comprising the Arctic Ocean.

Region 2024244 Day 244 ave 2024-Ave. 2007244 2024-2007
 (0) Northern_Hemisphere 4802455 4900416 -97962 4525136 277319
 (1) Beaufort_Sea 331017 568911 -237894 629454 -298437
 (2) Chukchi_Sea 508350 261504 246846 96232 412118
 (3) East_Siberian_Sea 476831 342187 134644 196 476635
 (4) Laptev_Sea 209967 163938 46029 245578 -35612
 (5) Kara_Sea 253 47999 -47746 74307 -74054
 (6) Barents_Sea 0 15867 -15867 11061 -11061
 (7) Greenland_Sea 101048 171695 -70647 288223 -187174
 (8) Baffin_Bay_Gulf_of_St._Lawrence 51428 26156 25272 32804 18624
 (9) Canadian_Archipelago 224943 301460 -76516 234389 -9445
 (10) Hudson_Bay 3868 19658 -15790 28401 -24533
 (11) Central_Arctic 2893622 2980244 -86622 2883200.58 10421

The largest deficit to average is in Beaufort Sea, followed by smaller losses in Greenland Sea, CAA and Central Arctic.   Hudson Bay and Barents Sea are mostly open water. The offsetting surpluses are in Chukchi, East Siberian and Laptev seas.

For context, note that the average maximum has been 15M, so on average the extent shrinks to 30% of the March high before growing back the following winter. Presently 2024 is at 32% of last March maximum.  In this context, it is foolhardy to project any summer minimum forward to proclaim the end of Arctic ice.

Resources:  Climate Compilation II Arctic Sea Ice

Mid August 2024 Normal Arctic Ice Melt in Progress


The graph above shows Mid July to Mid August daily ice extents for 2024 compared to 18 year averages, and some years of note.

The black line shows on average Arctic ice extents during this period decline 2.4M km2 down to 5.8M Km2 by day 229.  2024 tracked somewhat lower than the 18-year average in late July, then in August drew near to average before slipping into deficit the last 5 days. In the end, 2024 is presently close to 2023 and 2007, ~200k km2 below the 18 year MASIE average.

Remarkably, SII is showing much larger deficits to average than MASIE does. This period began with SII having a gap of 400k km2 less ice extent than MASIE, then increased that deficit as high as 700k km2, before reporting a gap of 537k km2 on day 229, a difference of half a Wadham. The effect will be for SII to report much lower monthly averages for ice extents during July and August, prior to the annual minimum occurring in September.

Why is this important?  All the claims of global climate emergency depend on dangerously higher temperatures, lower sea ice, and rising sea levels.  The lack of additional warming prior to 2023 El Nino is documented in a post UAH June 2024: Oceans Lead Cool Down.

The lack of acceleration in sea levels along coastlines has been discussed also.  See Observed vs. Imagined Sea Levels 2023 Update.

Also, a longer term perspective is informative:

post-glacial_sea_levelThe table below shows the distribution of Sea Ice on day 229 across the Arctic Regions, on average, this year and 2007. At this point in the year, Bering and Okhotsk seas are open water and thus dropped from the table.

Region 2024229 Day 229 Ave 2024-Ave. 2007229 2024-2007
 (0) Northern_Hemisphere 5623262 5828731 -205469 5673531 -50270
 (1) Beaufort_Sea 591190 698788 -107598 767181 -175991
 (2) Chukchi_Sea 554701 425156 129544 253092 301609
 (3) East_Siberian_Sea 641562 535416 106146 154536 487026
 (4) Laptev_Sea 268971 240911 28059 284910 -15939
 (5) Kara_Sea 14414 96702 -82288 201203 -186789
 (6) Barents_Sea 0 21833 -21833 17229 -17229
 (7) Greenland_Sea 120478 216573 -96095 310070 -189591
 (8) Baffin_Bay_Gulf_of_St._Lawrence 46366 53298 -6932 75105 -28739
 (9) Canadian_Archipelago 319281 399712 -80431 382407 -63126
 (10) Hudson_Bay 33319 58874 -25555 89354 -56034
 (11) Central_Arctic 3031923 3080445 -48523 3137188.82 -105266

The overall deficit to average is 205k km2, (3.5%).  The major deficits are in  Beaufort, Kara, Greenland Sea and CAA (Canadian Archipelago), partly offset by surpluses in Chukchi and East Siberian.

For more on the differences between MASIE and SII see this post:

Support MASIE Arctic Ice Dataset

bathymetric_map_arctic_ocean

Illustration by Eleanor Lutz shows Earth’s seasonal climate changes. If played in full screen, the four corners present views from top, bottom and sides. It is a visual representation of scientific datasets measuring ice and snow extents.

There is no charge for content on this site, nor for subscribers to receive email notifications of postings.