Revisiting “Pause Deniers Busted”


The original post and updates were done in October 2015.  Now Radford Neal has done a complete deconstruction of the published paper in his post (here): Critique of ‘Debunking the climate hiatus’, by Rajaratnam, Romano, Tsiang, and Diffenbaugh .  Neal says:

Climatic Change appears to be a reputable refereed journal, which is published by Springer, and which is cited in the latest IPCC report. The paper was touted in popular accounts as showing that the whole hiatus thing was mistaken — for instance, by Stanford University itself.

You might therefore be surprised that, as I will discuss below, this paper is completely wrong. Nothing in it is correct. It fails in every imaginable respect.

Original post and updates October 3 and 30 below

With Paris COP drawing near, the lack of warming this century is inconvenient and undermines the cause.

As Dr. Judith Curry said, “I have been expecting to start seeing papers on the ‘hiatus is over.’ Instead I am seeing papers on ‘the hiatus never happened.’”

One that was trumpeted came out of my Alma Mater, Stanford.  They garnered the expected headlines from the usual places:

Global Warming “Hiatus” Never Happened: Eos

There never was any global warming “pause.”:  Washington Post

The text is here: Debunking the climate hiatus

http://download.springer.com/static/pdf/969/art%253A10.1007%252Fs10584-015-1495-y.pdf?originUrl=http%3A%2F%2Flink.springer.com%2Farticle%2F10.1007

The write up has statistical razzle-dazzle and lots of opaque sentences, but let’s not get lost in the weeds.

Let’s not talk about the multiple tamperings to the land records they chose to study.  Let’s even overlook their including the bogus upward adjustments to the SSTs by Karl et al.  Bob Tisdale dissected that here: https://bobtisdale.wordpress.com/2015/06/04/noaancdcs-new-pause-buster-paper-a-laughable-attempt-to-create-warming-by-adjusting-past-data/

We don’t need to get into the technicalities of why they stopped with 2013 data, the suitability of the tests applied or their interpretations of the results.

Here’s what you need to know about this study:

They ignored the satellite records (RSS and UAH), the gold standard of temperature measurements, because the absence of warming there is undeniable.

For the land and ocean datasets they analyzed, they ignored the huge divergence between observations and the predictions (projections) from climate models.

Conclusion:

Natural variability in the climate system has neutralized any warming from increased CO2 this century, and also offset most, if not all of the secular rise in temperature since the Little Ice Age.  The models did not forecast this; they can only project warming, and do so at rates several times higher than observations.  The models fail for three reasons:  high sensitivity to CO2; positive feedback from water vapor; and lack of thermal inertia by the oceans.

For more on climate models and temperature projections:
https://rclutz.wordpress.com/2015/03/24/temperatures-according-to-climate-models/

The Stanford football team was impressive beating highly-rated Southern Cal on their home field last Saturday.  The work of the research team, however, looks like pandering rather than science.  They need to up their game: No cookies.

Update October 3

I found the time to look into the details of this paper and the statistical trick comes to light.

They took as the null hypothesis: “Temperatures are not rising.”  After applying several statistical tests, they conclude that the statement is not supported by the data, so we cannot say with certainty temperatures are not rising.

And what about the other null hypothesis: “Temperatures are rising.”  Silence.

I suspect they didn’t want to admit that the same statistical tests would also disprove that statement.

A reasonable person concludes: When you can not say for sure that temperatures are not rising, or that they are rising, that would surely indicate a plateau in temperatures.

Update October 30–Another classic from Josh

The Climate Story (Illustrated)

The captions and most comments below come from Mike van Biezen in his recent essay published at the Daily Wire (here). To illustrate his points, I added images collected from various internet addresses. Michael van Biezen teaches physics and earth sciences at Loyola Marymount University, Los Angeles, and his many lectures are available on Youtube at his website (here).

Temperature records from around the world do not support the assumption that today’s temperatures are unusual.

giss-annual-temps4

Global Mean Temperature from land and ocean expressed in absolute degrees F.

Satellite temperature data do not support the assumption that temperatures are rising rapidly.

john-christy-climate-change-chart-0a201a1637955761

The world experienced a significant cooling trend between 1940 and 1980. CO2 levels do not correlate consistently with temperatures.

Urban heat island effect skews the temperature data of a significant number of weather stations.

There is a natural inverse relationship between global temperatures and atmospheric CO2 levels.

Higher temperatures increase atmospheric CO2 levels and lower temperatures decrease atmospheric CO2 levels, not the other way around.

The CO2 cannot, from a scientific perspective, be the cause of significant global temperature changes

The H2O molecule which is much more prevalent in the Earth’s atmosphere, and which is a bend molecule, has many more vibrational modes, and absorbs many more frequencies emitted by the Earth, including to some extent the radiation absorbed by CO2. It turns out that between water vapor and CO2, nearly all of the radiation that can be absorbed by CO2 is already being absorbed.

Many periods during our recent history show that a warmer climate was prevalent long before the industrial revolution.

Glaciers have been melting for more than 150 years.

“Data adjustment” is used to continue the perception of global warming.

The Moral of The Climate Story:

Global warming alarm is not supported by temperature data.

Post-Truth Climatism

This particular realization started by clicking on an article discussing how fact-checking has become irrelevant in today’s politics.
The Limits of Fact-Checking: Calling Trump (and others) out for their lies doesn’t seem to make a difference. What’s going on? (Politico here).

Trump is exhibited as the primary example: the more his comments are rated as lies, even pants-on-fire lies, the more popular he becomes. But other politicians, including Hillary, are also cited for saying false things and refusing to renounce them.

A further analysis by Michael Kinsley ( here) suggests that a candidate or an elected leader and his followers know they are playing a game, and winning depends on having the more compelling narrative, never mind the “truth.” In fact, these falsehoods are not even concerned with any “truth,” they are just making up stuff that sounds good to an audience. In other words, they are not lying, they are bullshitting. Insiders know it and are OK with it, while much of the public is naive and therefore gullible.

As it happens Harry Frankfurt of Princeton gets to the heart of the matter in his provocative essay, On Bullshit, he says:

It is impossible for someone to lie unless he thinks he knows the truth. Producing bullshit requires no such conviction.

Someone who lies and someone who tells the truth are playing on opposite sides, so to speak, in the same game.

The bullshitter ignores these demands altogether. He does not reject the authority of the truth, as the liar does, and oppose himself to it. He pays no attention to it at all. By virtue of this, bullshit is a greater enemy of the truth than lies are.

Now the parallel with climatism is obvious. The Paris COP was striking in the sheer volume of claims that were stated as truths without any attempt to provide proof or even admit the need for any. Climatism is now unconnected to facts, evidence or logical argument. It explains why both political and climate fact-checkers are widely ignored.

Frankfurt warns:

The bullshitter may not deceive us, or even intend to do so, either about the facts or about what he takes the facts to be. What he does necessarily attempt to deceive us about is his enterprise. His only indispensably distinctive characteristic is that in a certain way he misrepresents what he is up to.
This is the crux of the distinction between him and the liar.

I believe Science Matters because actual scientific understanding does inform us about the future and what we need to do to prepare. But in the present environment, bullshitting is the order of the day, and we live in the twilight of Post-Truth discourse.

More from Frankfurt:

The contemporary proliferation of bullshit also has deeper sources, in various forms of skepticism which deny that we can have any reliable access to an objective reality and which therefore reject the possibility of knowing how things truly are. These “anti-realist” doctrines undermine confidence in the value of disinterested efforts to determine what is true and what is false, and even in the intelligibility of the notion of objective inquiry.

For more on the degradation of objective truth (AKA the Revenge of the Humanities) see:

https://rclutz.wordpress.com/2015/11/05/objection-asserting-facts-not-in-evidence/

https://rclutz.wordpress.com/2015/07/06/warmists-and-rococo-marxists/


Talking Climate


One thing revealed by the recent US Senate hearing was the importance of the two basic arguments forming the alarmist position:

1. “Ninety-seven percent of scientists agree: climate change is real, man-made and dangerous.” (Obama tweet)

2. “There are multiple lines of evidence that show the climate system is changing.” (Dept. of the Environment, Australia)

These two zingers must be met by equally brief, pointed replies.

97% Agreement

I concede that most climate scientists think there is a problem, but 97% of all scientists is an exaggeration.

The first claim of 97% came from a survey sample of 77 climate scientists who said “Yes” to 2 statements: “It has warmed since 1850.”; “Human activity has contributed to the warming.” That survey questionnaire was deliberately not sent to those known to be skeptical: scientists not employed by government or universities; astronomers; solar scientists; physicists; meteorologists.

dz97_consensus_myth

More inclusive surveys with more pointed questions show much more diverse opinions. Most scientists agree it has warmed since 1850, the end of the Little Ice Age. Geologists have evidence that the earth was warmer than now during the Medieval Warm Period, more warm during the Roman Warm Period, warmer still in the Minoan period. So the overall trend is a cooling over the last 11,500 years.

Most agree that human land use, such as making dams, farming, building cities, airports and highways, all affect the climate in those locations. The idea that rising CO2 is causing dangerous warming is controversial, with dissenters a large minority.

Multiple Lines of Evidence Climate is Changing

All of the measures are “glass half-empty, glass half-full.” And no one has evidence separating human and natural climate changes.  (Quotes below from Australia Dept. of Environment here)

Example 1: Air Temperatures
Air temperatures have increased globally, by around 0.85 degrees Celsius since 1880, with most of the warming occurring since the 1970s. All three major global surface temperature records show that the Earth’s atmosphere has warmed since 1880.

This is true and unsurprising emerging from the Little Ice Age. Over the last 150 years there has been a steady increase overlaid with a sine wave of 30-year warming and cooling periods.  From 1979 to 1998 the warming coincided with the rising rate of CO2, but the correlation is not seen in the periods before and since those two decades.

Example 2: Sea Levels
Global sea levels have risen at an average rate of 1.8 millimetres per year over 1961 to 2003. This rate risen to around 3.2 millimetres per year from 1993 to 2012.

Sea levels have been rising with the Little Ice Age recovery, and tidal guages show no increase in the rate in recent years. The 3.2 mm comes from the GRACE satellite system which is still being calibrated and not yet reliable, according to researchers.

Example 3: Extreme Weather
Extreme weather events include heatwaves, bushfires, tropical cyclones, cold snaps, extreme rainfall and droughts.  There is increasing evidence that the frequency and intensity of many extreme weather events  are changing.

The number and strength of extreme weather events by any statistical measure have been unusually benign in recent decades. The IPCC concluded that no causal link is proven between warming and extreme weather

Example 4: Rainfall Patterns
Rainfall patterns are changing around the world. Research shows the global water cycle is intensifying with a warming climate, which means wet areas are likely to get wetter and dry regions are likely to be drier in response to climate change.

Global rainfall varies about 5% from one year to another, so if it is drier in one place, it is wetter somewhere else. The IPCC working group said there is currently no way of predicting which places will get more or less rainfall long term.

The other notions of ocean acidification, Arctic Ice melting, etc. are likewise inconclusive and subject to interpretation, as other posts here and elsewhere point out.

Conclusion:

We simply do not know our climate system well enough to predict what will happen. Our ignorance should not be an excuse for fear and irrational actions.

Future periods are likely to be colder as well as warmer, and cold is the greater threat to human life and prosperity. To prepare for the future we should invest in robust infrastructure and ensuring reliable affordable energy. We should also focus on real and present environmental problems such as actual air pollution which kills thousands of people every day.

Animal Farm & Climate Change


Animal Farm2

George Orwell’s Animal Farm is a masterpiece of a simple story suggesting so many realities of societies. Among many things, it shows how a basic dichotomy mobilizes people (or creatures) for social or political action. The image above expresses the heart of the story whereby some animals took power over the others out of fear of humans.

Consider another dichotomy:    Producers Good, Parasites Bad.

Bumper Sticker

Bumper Sticker

People who are astounded by Donald Trump’s candidacy are overlooking how widely and deeply felt is this distinction between those who produce and those who take, and not only in the Tea Party but far beyond. The power arises from the emotional investment in the branding, no matter how illogical or mistaken it may be. Those who don’t feel it, don’t “get it.” Add in the envy of someone so rich he can say anything unbounded by Political Correctness, and Trump becomes a force to be reckoned with. It remains to be seen whether his followers are voters beyond being fans.

As for Climate Change, it seems to me at its heart lie two intertwined dichotomies:
                            Carbon Pollution Bad, Clean Air Good
                         Runaway Warming Bad, Stable Climate Good

The first notion is that carbon dioxide is a pollutant making the air dirty. Since CO2 is neither visible nor toxic (plants depend on it), it requires a second assertion that more CO2 causes runaway warming upsetting the stability of our climate system. That is, by adding CO2 from burning fossil fuels, we are destabilizing the climate system and bad things will happen as a result. Interestingly, at demonstrations the negative side is quite explicit, but the affirmative side requires some interpretation.

Some of us are astounded that sentient carbon-based life forms could be so disparaging of their own composition, but there is more than a whiff of anti-humanity in this movement. And the idea that we humans can fix the climate in a favorable state boggles the mind.

How all this plays out can be seen in an excellent interview with Bill Gates. Of course, he is a very lucid person and a genuine philanthropist of the first order. He has educated himself deeply on the history of energy as shown by this:

Share of Fuels in the Global Energy Mix Across Modern History

Gates goes on to say this:

What’s amazing is how our intense energy usage is one and the same as modern civilization. That is, for all the great things that happened in terms of human lifestyle, life span, and growing food before 1800, civilization didn’t change dramatically until we started using coal in the U.K. in the 1800s. Coal replaced wood. But the wave of wood to coal is about a 50- or 60-year wave.

If it was just about economics, if we had no global warming to think about, the slowly-but-surely pace of these transitions would be okay. If you look at one of these forecasts, they all say about the same thing: What you look at is a picture that’s pretty gradual, with natural gas continuing to gain at the expense of both coal and oil. But, you know, 1-percent-a year-type change. If you look at that from a greenhouse-gas point of view—if you look at forecasts—every single year we’ll be emitting more greenhouse gases than the previous year.

The title of the article is We Need an Energy Miracle because Bill Gates is one who worries about global warming. He has accepted at face value the dichotomies of climate change, and so those blinders shape his investment plans and priorities.

He actually has a lot in common with Bjorn Lomborg, who supports the Gates energy innovation initiative. But Lomborg sees things more clearly (here responding to comments by Arnold Swartzenegger):

Power generation, traffic and industry – which is mostly fossil fuel driven and likely what you were thinking about – in total cause 854,000 air pollution deaths. Added to the 560,000 deaths from indoor air pollution caused by coal, this constitute only 20% of total air pollution deaths or about 3,900 deaths each day.

This matters for two reasons. First, it is disingenuous to link the world’s biggest environmental problem of air pollution to climate. It is a question of poverty (most indoor air pollution) and lack of technology (scrubbing pollution from smokestacks and catalytic converters) – not about global warming and CO₂. Second, costs and benefits matter.[vi] Tackling indoor air pollution turns out to be very cheap and effective, whereas tackling outdoor air pollution is more expensive and less effective. Your favorite policy of cutting CO₂ is of course even more costly and has a tiny effect even in a hundred years.

Conclusion
It is likely that future periods will be both colder and warmer than the present. Preparing for that means investing in robust infrastructure and in reliable affordable energy.

I agree with Lomborg. It’s important to make an energy transition and take the time to do it right. So far we are wasting time and money on the illusion that we can ensure favorable weather by reducing fossil fuel emissions.

A Teenager Looks at Climate Change

Teenager's View

This is a guest post by my grandson, William Desormeaux age 17, consisting of an English translation of his essay in French to fulfill a philosophy class requirement.  The words and thoughts are entirely his own, based on his own research.  I added the images.

For a few decades, many people have given their opinions about climate change. Some are concerned by this phenomenon, while others try to prove that these changes do not actually have impact. The first group can be called warming alarmists and the second warming skeptics. For other individuals who are not part of these groups, the following question arises: Should we act against climate change? In my opinion, alarmists exaggerate much too much on the problems. In fact, the conditions of the Earth have already been worse, humans are not actually responsible for these changes and measured results contain errors.

carbon_dioxide

First, I do not believe that we should act against climate change because the situation of the Earth, in respect of carbon dioxide has already been much worse. Indeed, according to Ian Plimer, Professor of geology at the University of Adelaide, several millennia ago, Earth had a rate of carbon dioxide 1000 times higher.1 Carbon dioxide is a greenhouse gas and alarmists say that it is bad for the environment. It is true that it has an impact on our planet. On the other hand, when we look at the statistics of Ian Plimer, we realize that the Earth has already included much more of this gas and survived. Moreover, plant life depends on carbon dioxide and grows bigger and faster in higher concentrations than we have today. In short, although the concentration of greenhouse gases increases, it remains that it has been much higher without damage caused to our planet.

Greenhouse gases diagram

Secondly, in the same vein, I am not convinced that we actually have the possibility of acting against climate change since we are not responsible. Indeed, again according to Ian Plimer, human activities are responsible for only 3% of carbon dioxide emissions in the atmosphere.2 If we take a moment to analyze these figures, we can quickly see that even if we succeed in halving our emission of carbon dioxide in the atmosphere, there would still remain 98.5% of the gas that “pollutes our planet”. Further, I consider that all the sacrifices that we should take just to halve our emissions will do nothing to save the Earth. So, 98.5% means that climate changes are part of a natural cycle, and we shouldn’t be overly preoccupied about this issue.

tucson_arizona-labelled

Thirdly, the results recorded by meteorological stations are not completely reliable. Indeed, according to Anthony Watts, Chief Meteorologist of KPAY-AM radio, 89% of stations recording temperatures do not respect National Weather service standards.3 This statistic shows that some results used by alarmists are erroneous. It is easy for people to believe that the temperature is rising when different weather stations do not meet standards. For example, some of these stations have been found in the middle of parking lots, an area where heat is absorbed. So, in this way, the displayed temperatures are higher than they should be. Thus results promoted by alarmists are not typical since there are only 11% of stations that are adequate. Finally, I do not believe that action must be taken against climate change since published temperatures are misleading. In this way, it is easy to make global warming look worse than it is.

marysvilleca_ushcn_site_small

In conclusion, I am convinced that we should not take action against climate change. Several experts like Mr. Plimer and Mr. Anthony Watts have convinced me that these changes have already been worse, that they are not the fault of humans and that they are exaggerated by alarmists due to poor data collection. In addition, I believe skeptics’ thoughts are less taken into account by the population since they are less disclosed by the media. Among other things, it’s much more interesting for them to mention that a phenomenon such as climate warming may disrupt our lives than to share with readers that everything is normal. Finally, although I myself pay attention to my planet, by recycling and taking public transit frequently, I’m not convinced that it is crucial to act against climate change.

1 http://pcc15.org/the-ten-questions/question-1/
2 http://pcc15.org/the-ten-questions/question-1/
3 http://pcc15.org/the-ten-questions/question-10/


To My Grandson: On Greenhouse Gases

This post is in response to questions from my grandson with a homework assignment regarding global warming.

How do Greenhouses function?

A greenhouse is typically made of glass walls and ceiling, which allows the sun to warm the surface (land and plants) which then warms the air. Warmer air rises but is unable to leave the enclosure. Thus the air temperature inside is warmer than outside. The action of air to move heat away from warmer objects is called “convection”, and greenhouses function by preventing convection. The greenhouse effect is also seen in a car left in the sun with the windows closed. Once the air is again allowed to circulate, the outside temperature is restored inside.

What are “Greenhouse Gases?”

99% of the atmosphere is N2 and O2, diatomic molecules (2 atoms), and they are unaffected by radiation in the Infrared (IR) range. Some molecules, principally H2O and Co2 are triatomic (3 atoms) and do absorb and emit radiation in the IR range. The correct term for these gases is “IR active gases,” rather than “greenhouse gases.”

And people are not always forthcoming about the proportions, even forgetting to mention H2O is the predominant IR active gas (9 to 1). This diagram shows the reality:

Why compare IR active gases to greenhouses?

The earth’s surface is constantly warmed by the sun and then warms the air in contact with it (“conduction”). And except for enclosures, the air is free to rise and be replaced by descending cooler air, which is warmed in turn. Convection operates to move surface heat upward toward space. No gas impedes this process.

The notion of ”greenhouse gases” is a claim that IR active gases form a radiative ceiling which delays the rising heat and makes the atmosphere and surface warmer as a result. Some have claimed that this radiative effect causes the surface to be at an average temperature of +15C, compared to -18C without IR active gases. This notion ignores important scientific factors operating in our climate system.

My understanding of how and why earth is warmer than the radiative balance temperature of -18C.

The build up of heat at the surface is caused by a delay in heat transport from surface to space. Surrounded by the nearly absolute cold of space, our planet’s heat must move in that direction, which involves pushing it through the atmosphere. And there is an additional delay within the oceans from the overturning required to bring energy to the surface for cooling. The oceans are a massive thermal energy storage place (1000 times the atmosphere’s heat capacity) which moderates swings in energy and ensures that earth temperature fluctuations are small.

The Difference between climate on the Earth and the Moon

The intensity of solar energy is the same for the Earth and Moon, yet the dark side of the earth is much warmer than the dark side of the moon. And the bright side of the earth is much cooler than the bright side of the moon. Why are the two climates so different?


Earth’s oceans and atmosphere make the difference. Incoming sunlight is reduced by gases able to absorb IR and also by reflection from clouds and non-black surfaces. The earth’s surface is heated by sunlight, much of it stored and distributed by the oceans (71% of the planet surface). The atmosphere delays the upward passage of heat, and like a blanket slows the cooling allowing a buildup of temperature at the surface until there is a balance of heat radiating to space from the sky to match the solar energy coming in.

How the Atmosphere Processes Heat

There are 3 ways that heat (Infrared or IR radiation) passes from the surface to space.

1) A small amount of the radiation leaves directly, because all gases in our air are transparent to IR of 10-14 microns (sometimes called the “atmospheric window.” This pathway moves at the speed of light, so no delay of cooling occurs.

2) Some radiation is absorbed and re-emitted by IR active gases up to the tropopause. Calculations of the free mean path for CO2 show that energy passes from surface to tropopause in less than 5 milliseconds. This is almost speed of light, so delay is negligible. H2O is so variable across the globe that its total effects are not measurable. In arid places, like deserts, we see that CO2 by itself does not prevent the loss of the day’s heat after sundown.

3) The bulk gases of the atmosphere, O2 and N2, are warmed by conduction and convection from the surface. They also gain energy by collisions with IR active gases, some of that IR coming from the surface, and some absorbed directly from the sun. Latent heat from water is also added to the bulk gases. O2 and N2 are slow to shed this heat, and indeed must pass it back to IR active gases at the top of the troposphere for radiation into space.

In a parcel of air each molecule of CO2 is surrounded by 2500 other molecules, mostly O2 and N2. In the lower atmosphere, the air is dense and CO2 molecules energized by IR lose it to surrounding gases, slightly warming the entire parcel. Higher in the atmosphere, the air is thinner, and CO2 molecules can emit IR and lose energy relative to surrounding gases, who replace the energy lost.

This third pathway has a significant delay of cooling, and is the reason for our mild surface temperature, averaging about 15C. Yes, earth’s atmosphere produces a buildup of heat at the surface. The bulk gases, O2 and N2, trap heat near the surface, while IR active gases, mainly H20 and CO2, provide the radiative cooling at the top of the atmosphere. Near the top of the atmosphere you will find the -18C temperature.

Summary

It is wrong to claim that IR active gases somehow “trap” heat when they immediately emit any energy absorbed, if not already lost colliding with another molecule. No, it is the bulk gases, N2 and O2, making up the mass of the atmosphere, together with the ocean delaying the cooling and giving us the mild and remarkably stable temperatures that we enjoy.

More on climate theory here:

https://rclutz.wordpress.com/2015/04/25/on-climate-theories-response-to-david-a/

https://rclutz.wordpress.com/2015/04/21/the-climate-water-wheel/

https://rclutz.wordpress.com/2015/10/26/what-is-climate-is-it-changing/

Inside Barents Ice Crystal Ball

On a previous post (here), I linked to a recent study positing that variations in Barents Sea ice extent are predictive of Arctic extent for at least 1-2 years later. In other words, they concluded based upon measurements of ice extent and ocean heat transfers: As winter ice extent goes in Barents Sea, so goes annual ice extent across the Arctic ocean. The physical cause is changing fluxes of warm North Atlantic water penetrating through the Barents Sea into the rest of the Arctic. They acknowledge that other factors, especially winds are also in play, but believe that the ocean influx (also affected by winds) makes the largest influence. The full study is here.

Arctic Ice Dynamics

Here’s how researchers are connecting the dots:
NAO (North Atlantic Oscillation)► BSO(Heat transport by Atlantic Water (AW) through Barents Sea Opening)► Winter ice extent in Barents Sea► Winter ice extent in Arctic Ocean► Annual ice extents in Barents and Arctic Ocean.

A key scientist in this work is Randi Ingvaldsen of Geophysical Institute, University of Bergen, Institute of Marine Research. Several of her published articles are part of her doctoral thesis available here.  It comprises an informative look into the extensive body of research in this area.

The Barents Sea climate fluctuates between warm and cold periods. By comparing decade by decade we found that although the 1990s had high temperatures, both the 1930s and the 1950s were warmer. This indicates that the warming of the 1990s may very well be related to natural variability rather than anthropogenic effects.

The above results indicate a positive correlation between the NAO winter index and the area occupied by AW, a result clearly evident when investigating the total area across the BSO occupied by AW (Figure 6d). Earlier investigations have shown a positive correlation between the NAO winter index and the mean AW temperature in the BSO (also evident in
Figure 6e). This means that both the temperature and the extent of AW increase with increasing NAO winter index (Figure 6 a and d-e), although with different lags.

In summary, this preliminary investigation has shown that both the mean temperature and lateral extent of AW in the BSO is positively correlated to the strength of the Icelandic low, although with lags.

The extensive bibliography in the linked studies shows that these results are built upon the efforts of many researchers over decades. There are many references to empirical research efforts in recent times (e.g. an array of moorings in the NE Barents Sea):

The pathway and transformation of water from the Norwegian Sea across the Barents Sea and through the St. Anna Trough are documented from hydrographic and current measurements of the 1990s. . .The westward flow originates in the Fram Strait branch of Atlantic Water at the Eurasian continental slope, while the eastward flow constitutes the Barents Sea branch, continuing from the western Barents Sea opening.

In earlier decades, the Atlantic Water advected from Fram Strait was colder by almost 1 K as compared to the 1990s, while the dense Barents Sea water was colder by up 1 K only in a thin layer at the bottom and the salinity varied significantly. However, also with the resulting higher densities, deep Eurasian Basin water properties were met only in the 1970s. The very low salinities of the Great Salinity Anomaly in 1980 were not discovered in the outflow data. We conclude that the thermal variability of inflowing Atlantic water is damped in the Barents Sea, while the salinity variation is strongly modified through the freshwater conditions and ice growth in the convective area off Novaya Zemlya.

http://www.sciencedirect.com/science/article/pii/S0967063702001255

The evidence says Arctic ice varies from a variety of natural factors:


Based on these observational data, Polyakov et al. (2003) concluded that the “examination of records of fast ice thickness and ice extent from four Arctic marginal seas (Kara, Laptev, East Siberian, and Chukchi) indicates that long-term trends are small and generally statistically insignificant, while trends for shorter records are not indicative of the long-term tendencies due to strong low-frequency variability in these time series, which places a strong limitation on our ability to resolve long-term trends”. “Correlation analysis shows that dynamical forcing (wind or surface currents) is at least of the same order of importance as thermodynamical forcing for the ice extent variability in the Laptev, East Siberian, and Chukchi Seas. Source: http://www.climate4you.com/

Conclusion:

As with everything else in the climate system, Arctic ice dynamics are complex and our understanding is growing but still incomplete. And like the rest of the climate system, the more we learn, the more evident it is that fossil fuel emissions have little to do with it. We should take seriously other ways humans impact the climate system, be it from our use of the seas, as Dr. Bernaerts points out, or from using the land, as Dr. Pielke has documented.

There’s no denying climate change. Climate is changing: Not much; Not quickly; And not lately. (Credit: David Siegel here)

Footnote November 16:  

Some additional reflections:

This line of Arctic ice research is interesting because it challenges typical thinking about northern climates such as Barents.

Firstly, it goes beyond simplistic, value-laden notions, such as “less Arctic ice is a bad thing” (popular), or “less Arctic ice is a good thing” (not popular). These researchers are not making those judgments but are asking a purely scientific question: Why? Why is there more ice some years and less ice other years? And they know that any explanation is tested by how well it predicts future ice extents.

Secondly, this line of research requires a shift in focus from the summer melts in August-September, to pay more attention to the action in the winter, especially December-April. The proposed mechanism of heat transfer by means of Atlantic water happens almost entirely in that time frame, when most people leave the Arctic alone in the dark.

Finally, there is humility in making the predictions, recognizing the complexity of the situation, and how effects lag in time.  Certainly, the lack of ice in Barents this last April is a basis for thinking extents there and across the Arctic will be down next April. But there happens to be a cold Blob of surface water in the North Atlantic presently, and that may affect the result. That is the way of science:  make predictions, make observations and adapt the theory accordingly.

Objection: Asserting Facts Not in Evidence!

In recent weeks climate activists have turned to the courts to advance their cause. An assembly of international supreme court judges discussed issuing a ruling to establish consensus science as legal fact. The UN proposed agreement for Paris COP includes an International Climate Tribunal “to oversee, control and sanction the fulfilment [sic] of and compliance with the obligations” under the agreement. A letter was sent to US justice officials appealing for RICO law to be used to silence dissenters from consensus climate science. And a plan hatched long ago was activated to catch Exxon in a tobacco-style litigation. More on the latter is here.

Noting these events, Judith Curry had a discussion about the role of the courts regarding climate science. It seems to me that any legal proceeding would bog down at the first testimony by a consensus witness, since any opposing counsel brighter than a fence post should repeatedly object: “Objection, asserting facts not in evidence.” (Probably wishful thinking on my part.)

A separate event yesterday attracted my attention to the topic of climate evidence. At his swearing-in as Canadian Prime Minister, Justin Trudeau appointed a Minister of the Environment and Climate Change portfolio. In his general comments, not specific to that department, he said his government would deliver “evidence-based policy”. Naturally I am wondering what that could mean regarding climate policies.

What does “Evidence-Based” mean?

Robert Sutton has written extensively on the notion of evidence-based management, and says this in the Harvard Business Review here.

We’ve just suggested no less than six substitutes that managers, like doctors, often use for the best evidence—obsolete knowledge, personal experience, specialist skills, hype, dogma, and mindless mimicry of top performers—so perhaps it’s apparent why evidence-based decision making is so rare. At the same time, it should be clear that relying on any of these six is not the best way to think about or decide among alternative practices.

Sutton talks about some of the elements that make up an evidence-based approach. For example,

Start with an Answerable Question:
The decision-making process used at Oxford’s Centre for Evidence-Based Medicine starts with a crucial first step—the situation confronting the practitioner must be framed as an answerable question. That makes it clear how to compile relevant evidence.

Demand Evidence:
When people in the organization see senior executives spending the time and mental energy to unpack the underlying assumptions that form the foundation for some proposed policy, practice, or intervention, they absorb a new cultural norm.

Treat the organization as an unfinished prototype.
For some questions in some businesses, the best evidence is to be found at home—in the company’s own data and experience rather than in the broader-based research of scholars. Companies that want to promote more evidence-based management should get in the habit of running trial programs, pilot studies, and small experiments, and thinking about the inferences that can be drawn from them

Embrace the attitude of wisdom.
Something else, something broader, is more important than any single guideline for reaping the benefits of evidence-based management: the attitude people have toward business knowledge. At least since Plato’s time, people have appreciated that true wisdom does not come from the sheer accumulation of knowledge, but from a healthy respect for and curiosity about the vast realms of knowledge still unconquered.

The approach is summarized here.

Five Principles of EBM

1. Face the hard facts, and build a culture in which people
are encouraged to tell the truth, even if it is unpleasant.
2. Be committed to “fact based” decision making — which
means being committed to getting the best evidence and
using it to guide actions.
3. Treat your organization as an unfinished prototype —
encourage experimentation and learning by doing.
4. Look for the risks and drawbacks in what people recommend
— even the best medicine has side effects.
5. Avoid basing decisions on untested but strongly held beliefs,
what you have done in the past, or on uncritical “benchmarking”
of what winners do.

The Medical Paradigm of Evidence

Throughout this essay you will see references to medical decision making, since the evidence-based idea originated in this arena. The practice of medicine is where the notion took root: treatment choices should be based upon the data of historical results. And in the courts, it was often medical cases where protocols developed for making the case for or against a medicine, treatment or environmental condition causing damage to someone.

I used above the classical image of Justice being blind in weighing evidence, the idea being that the defendant’s wealth or social status has no bearing on the decision of guilt or innocence. Medical science goes one step further to eliminate bias: double-blind randomized controlled trials (RCTs) are the gold standard for evidence.

Rules for Scientific Evidence in Court

A court of law is first and foremost an evidence-based proceeding, and detailed rules are applied when submitting and accepting anything as evidence for the purpose of reaching a decision. Without going into the complexities (I am not a lawyer), it is instructive to see how courts do handle scientific evidence as a background for what a climate case might entail.

Much of the following information comes from Nathan Schachtman here.

Proper epidemiological methodology begins with published study results which demonstrate an association between a drug and an unfortunate effect. Once an association has been found, a judgment as whether a real causal relationship between exposure to a drug and a particular birth defect really exists must be made. This judgment requires a critical analysis of the relevant literature applying proper epidemiologic principles and methods. It must be determined whether the observed results are due to a real association or merely the result of chance. Appropriate scientific studies must be analyzed for the possibility that the apparent associations were the result of chance, confounding or bias. It must also be considered whether the results have been replicated.

Step 1: Establish an association between two variables.
Proper epidemiologic method requires surveying the pertinent published studies that investigate whether there is an association between the medication use and the claimed harm. The expert witnesses must, however, do more than write a bibliography; they must assess any putative associations for “chance, confounding or bias”:

Step 2: Rule out chance as an explanation
The appropriate and generally accepted methodology for accomplishing this step of evaluating a putative association is to consider whether the association is statistically significant at the conventional level.
“Generally accepted methodology considers statistically significant replication of study results in different populations because apparent associations may reflect flaws in methodology.”

Step 3: Rule out bias or confounding factors.
The studies must be structured to analyze and reject other factors or influences, such as non-random sampling, additional intervening variables such as demographic or socio-economic differences.

Step 4: Infer Causation by Applying Accepted Causative Factors
Most often legal proceedings follow the Bradford Hill factors, which are delineated here.

What aspects of that association should we especially consider before deciding that the most likely interpretation of it is causation?

(1) Strength. First upon my list I would put the strength of the association.

(2) Consistency: Next on my list of features to be specially considered I would place the consistency of the observed association. Has it been repeatedly observed by different persons, in different places, circumstances and times?

(3) Specificity: One reason, needless to say, is the specificity of the association, the third characteristic which invariably we must consider. If as here, the association is limited to specific workers and to particular sites and types of disease and there is no association between the work and other modes of dying, then clearly that is a strong argument in favor of causation.

(4) Temporality: My fourth characteristic is the temporal relationship of the association – which is the cart and which is the horse? This is a question which might be particularly relevant with diseases of slow development. Does a particular diet lead to disease or do the early stages of the disease lead to those particular dietetic habits?

(5) Biological gradient: Fifthly, if the association is one which can reveal a biological gradient, or dose-response curve, then we should look most carefully for such evidence.

(6) Plausibility: It will be helpful if the causation we suspect is biologically plausible. But this is a feature I am convinced we cannot demand. What is biologically plausible depends upon the biological knowledge of the day.

(7) Coherence: On the other hand the cause-and-effect interpretation of our data should not seriously conflict with the generally known facts of the natural history and biology of the disease – in the expression of the Advisory Committee to the Surgeon-General it should have coherence.

(8) Experiment: Occasionally it is possible to appeal to experimental, or semi-experimental, evidence. For example, because of an observed association some preventive action is taken. Does it in fact prevent? The dust in the workshop is reduced, lubricating oils are changed, persons stop smoking cigarettes. Is the frequency of the associated events affected? Here the strongest support for the causation hypothesis may be revealed.

(9) Analogy: In some circumstances it would be fair to judge by analogy. With the effects of thalidomide and rubella before us we would surely be ready to accept slighter but similar evidence with another drug or another viral disease in pregnancy.

None of my nine viewpoints can bring indisputable evidence for or against the cause-and-effect hypothesis and none can be required as a sine qua non. What they can do, with greater or less strength, is to help us to make up our minds on the fundamental question – is there any other way of explaining the set of facts before us, is there any other answer equally, or more, likely than cause and effect?

How Does This Apply to Climate Policy?

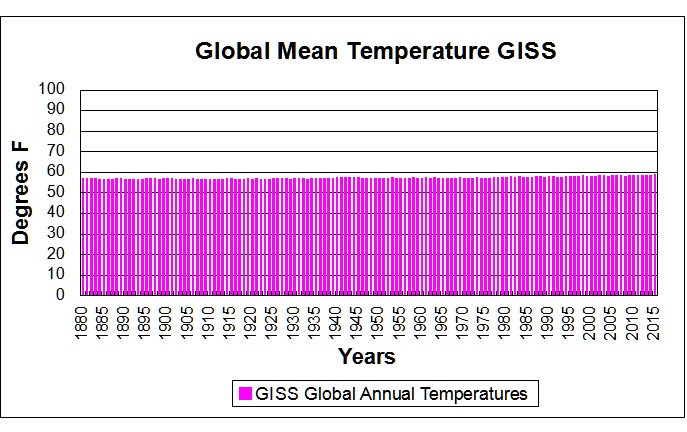
The legal methodology above is used to decide the causal relationship between two variables. Clearly, in Climate Science the starting question is: Do rising fossil fuel emissions cause temperatures to rise? Those who have been following the issue know that there are many arguments underneath: Are temperatures always rising along with CO2? Has chance been eliminated? Are not natural factors confounding the association? And so on.

But that question is only the beginning when considering an evidence-based climate policy. Daniel Roberts has provided a simple, comprehensive framework of questions, showing that answers to each one impact upon the others.

When governments speak of evidence-based policies, they usually mean allocating scarce public funds to programs that have shown value for money. Cost and benefit analysis is inescapable, along with definitions of outcomes, outputs, service activities, and the metrics to assess performance for the sake of funding priorities. Is that what PM Trudeau has in mind? Will that discipline be applied regarding climate change?

Summary

If I had used a term like “evidence-based” in a schoolboy essay, I would have gotten a red circle with a GG alongside (“Glittering Generality”). I wonder if today’s teachers are as discerning and demanding of rigor, or do they let it go if it is politically correct? Justin Trudeau was formerly a schoolteacher, so I guess we will find out.

For an analysis of the association between fossil fuel emissions and Global Mean Temperature see 2018 Update: Fossil Fuels ≠ Global Warming

Climate Heavyweights

On this blog site there are a number of posts under the category Oceans Make Climate, pointing to the oceans as climate heavyweights on human timescales. Those essays describe various cycles and circulations that cause climate system changes on scales from decades up to millennia.

When we look longer term, other heavyweights show off their punching power.

Bill Illis has done some impressive gathering of data and presenting the scope of natural climate variations over long time scales. “I have the biggest database of paleoclimate Temperature and CO2 estimates of anyone I guess. 17,000 individual temperature estimates going back 2.4 billion years and 2600 CO2 estimates going back 750 million years.”

The diagram below is his remarkable display showing the major climate changes resulting from geologic forces and shifts. (h/t to Paul Vaughn for linking to this chart, new to me)

Illis explains the implications:

Antarctica glaciates over, no change in CO2. Then CO2 finally falls below 280 ppm for perhaps the very first time in history and Antarctica promptly unglaciates. CO2 stays flat for another 13 million years while Antarctica is only half glaciated. Then 14 million years ago, the glaciers advance and CO2 does not change. etc. etc. CO2 has nothing to do with it. It is whether the Antarctic Circumpolar Current is fully operating or not. And that is determined by continental drift and whether individual continental landmasses or even small cratons between South America and Antarctica are blocking it.

To dramatize the lack of correlation between CO2 changes and temperature changes, Bill Illis presents the diagram below. The orange line represents estimated temperatures assuming 3C warming for each doubling of CO2 concentrations

Summary

During 40 million years of history, geologic, astronomic and oceanic forces have shaped the planet’s climate. We conclude that CO2 fits into the flyweight climate class, perhaps even “mini flyweight” or “atom weight.”

Source:
http://wattsupwiththat.com/2014/07/30/co2-destroyer-of-entire-continents-at-the-touch-of-a-knob/#comment-1698003

Footnote Nov. 4

There is a lot of fuss about limiting global warming to +2 Celsius.  According to the charts above, the variations have been within + or – 2 Celsius  during the last 2 million years.