Mark Krebs writes at Master Resource DOE Efficiency Standards: Consumer Time? Excerpts in italics with my bolds and added images.
“The Deep State is cancer-like in nature. Like cancer, it must be rooted out before it metastasizes—as it would have if subject to another four years of a Harris (Obama 4.0?) Administration.”
“It’s time to go big. Scrap DOE and part-out whatever missions are worth saving. And whatever missions are deemed worth saving should be saved only with thorough scrutiny of zero-based budgeting.”
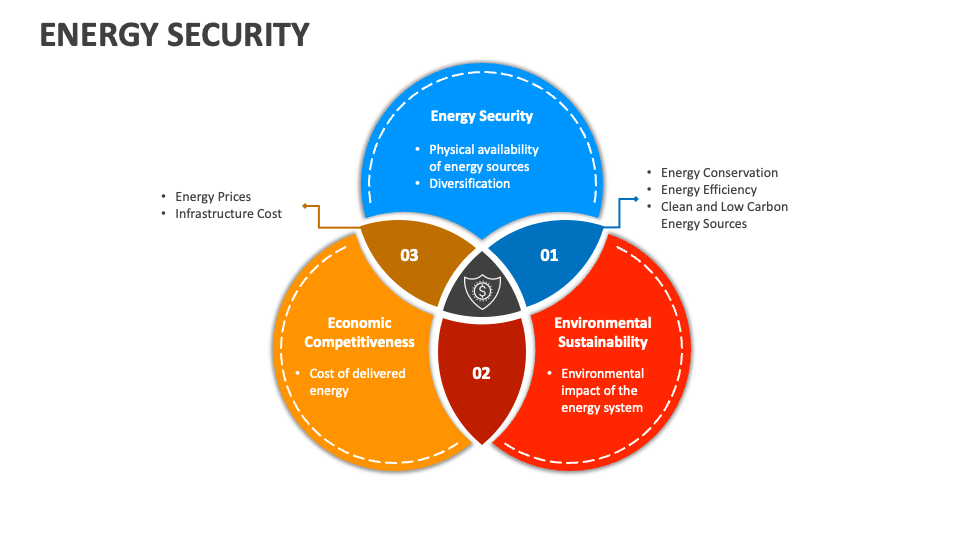
Our March 2017 post, DOE’s EERE: Reform Ideas for Secretary Perry, stated that while “a trace of consumer focus still exists,” the department’s heavy bias was towards society-wide electrification under the guise of “Net Zero”.
Whatever trace of consumer focus may be remaining within DOE is not worth salvaging. In fact, eliminating the pipe dream of an all-electric society would likely save US citizens $18 to 29 trillion in capital costs alone. Other analysts have estimated far higher cost inflation, while others conclude that total electrification cannot be accomplished at any cost.

Real Reform Opportunity
The incoming Administration can and should do far more than just trim back the overgrown greenery; it should serve the legitimate interests of the American citizenry and American prosperity. However. details in our previous recommendations (EERE Reform: Brouillette’s Turn (‘deep decarbonization’ threat still alive)), are worth reviewing by the incoming Trump Administration if for no other reason than to document historical mistakes and avoid them going forward. Regardless, our old recommendations are no longer sufficiently ambitious in terms of best serving the American public and drastically reducing the National Debt’s deadly inflation.
But how should we move forward for “deep reform” versus the meager results from before? After all, the incoming Trump 2.0 Administration much better understands the depth and breadth of the Deep State and its joined-at-the-hip “Uniparty” cohorts. The options range from modest “reform” to scrapping DOE and parting out its truly vital missions to other Federal agencies or private sector competition.
Given we the people hold the House, and lead the Senate, this is a unique opportunity that must be exploited to the full extent feasible. After all, the world has fundamentally changed since DOE was formed to address certain issues: low supplies and scarcity, coupled with cartel behavior by foreign actors. Today we have robust supplies that mainly just need regulatory relief.

Deep State Foe
Clausewitz was all about winning. If Trump is too (he is), rearranging DOE’s “deck chairs” is just a short step across a large chasm. The Deep State cancer would likely just go into a four-year remission only to return with a vengeance with a return of another Democrat Administration down the road someday.
Ultimately, the choice comes down to serving the Deep State/Uniparty or serving the legitimate best interests of “we the people.” There is no “live and let live” middle ground as the present Biden (mis)Administration has abundantly demonstrated in words and deeds. Nor is there sufficient funding for “all electric” or even “all the above” energy policies.

Appliances Just the Thin Edge of the Wedge
We can’t afford the self-indulgence of environmental virtue signaling. We need only to pursue energy policies that objectively and comprehensively focus on economic least-cost planning (and bidding) so we can avoid the looming reality of economic collapse. And yes, there is still room for objective energy efficiency; if it is market-based (as opposed to “big brother” dictates to throw money at an illusionary problem). There is even room for least-cost environmental progress. As RFK Jr. knows, soil regeneration is one of these.

It is imperative that the Trump 2.0 Administration achieve and demonstrate tangible and substantial results for energy consumers as soon as possible. Immediate actions should include clawing back the tragic Inflation Reduction Act, an all-you-can eat funding buffet for a myriad of parasitic “clean energy” zealots. These zealots have already received enough (unwitting taxpayer) IRA funding to plague “we the people” for decades to come.
The most efficient tactic (but not necessarily easiest) would be to simply eliminate DOE departments that oversee such funding. And along with that, repeal equally corrupted legislation that authorized DOE’s regulatory mission creep, such as the obsolete Energy Policy and Conservation Act of 1975 (EPCA) and self-serving, loophole riddled revisions thereof.
In short and in closing, DOE is not worth trying to salvage, because its cancer culture is immune to modest political reforms and intervention. Thus, like a junk car, part out what can be safely and economically salvaged and eliminate the rest. Assuming control of the House and Senate, this is, for the first time, entirely doable; given the will to persevere. So let’s declare victory over the gas lines of the 1970s and move on to overcoming House and Senate resistance for dramatically reducing the economic threatening cholesterol of excessive spending.
Addendum 1

In the spirit of the quote above, government needs structuring to safeguard the evidence (data, research) from predetermined policy ends and tunnel vision. One suggestion in this direction was ignored but deserves consideration. Dexter Wright wrote at American Thinker How to Abolish the Department of Energy. Excerpts in italics with my bolds and added images.
It has been said by almost every conservative candidate running for office this year that they would like to abolish the Jimmy Carter government legacy, the Department of Energy (DOE). Back in the 1970s when the Department of Energy was created the Carter Administration claimed that 20% of the nation’s energy needs would be supplied by solar energy by the year 2000. Needless to say that didn’t happen. So today we have a Department of Energy that provides energy to no one.
The question is how can we get rid of the DOE? The answer lies in the history of the U.S. Coast Guard. The Coast Guard is made up of the best parts of three different services that no longer exist; the Revenue Cutter Service, the Light House Service, and the Life Saving Service. These services were combined efficiently to create the modern Coast Guard.
Similarly, there are activities that operate within the DOE that are worthy of preserving such as the national laboratories at Los Alamos, NM; Oak Ridge, TN and Sandia National Laboratory in Albuquerque, NM. These National Laboratories perform scientific tasks that are not only vital to national security but also, in some cases, are mandated by arms reductions treaties.
There are also activities within other departments and agencies that focus on science such as the National Weather Service (NWS); but for some reason, the Weather Service is stuck in the Department of Commerce (DOC). Contrary to popular belief we do need the Weather Service because all of the data that is collected and analyzed by NWS is then distributed to the media for their broadcast and dissemination. But it is clear that the NWS does not need to be in the Department of Commerce.
Believe it or not, even the Environmental Protection Agency (EPA) does scientific work, it just doesn’t use the data that is collected and analyze for policy development. I’m not really sure what it does with the data other than suppress it.
The way to deal a death blow to all of these departments and agencies is to
cull out of these bureaucracies all of the useful scientific parts and place
them in a new department, the Department of Science and Technology.
This new department would eliminate the need for the EPA, the DOC and the DOE. Even agencies like NASA could be included so that there would be cabinet level representation and so that rocket scientists would not be relegated to teaching math to third world nations. Ideally the new Department of Science and Technology would provide unbiased data for policy makers to ignore rather than the biased flawed data that they ignore now.
Addendum 2

The scope of reform goes far beyond energy agencies, since the Biden/Harris regime dictated a “whole of government” response, embedding fear of CO2 into the full slate of programs. And thereby, the enormous deficit spending covered by freshly printed money threatens the economic viability of the republic. So the consolidating and downsizing of the whole governmental beast is required. Jeffrey Tucker of Brownstone Institute writes A Plan to Tame Inflation. Excerpts in italics with my bolds and added images.
Elon Musk summarizes: “The excess government spending is what causes inflation! ALL government spending is taxation. This is a very important concept to appreciate. It is either direct taxation, like income tax, or indirect via inflation due to increasing the money supply.”

Inflation is a wicked beast that cannot be controlled directly. On the campaign trail, Trump spoke often about how it was the throttling of the energy sector that kicked off inflation. That is only partially true in the sense that the soaring price of oil and gas grew the costs of transportation. It was also a symptom rather than a cause. Plus, the price of oil and gas is actually not high right now in real terms.
Yes, the plan of “drill baby drill” is necessary and should happen but it cannot fix the existing problem of inflation much less do much to forestall a second wave. Nor is there a viable fix in the idea of price control, even when it is masked as “anti-gouging” legislation. There is nothing government can do to directly control prices, much less force them from going up given the deep structural problems.
There are ways to mitigate against the problem, or at least minimizing them. You can have a look at how Javier Milei did it in Argentina. He took the problem of massive hyperinflation and converted it to low inflation in a year. His is a case study. The answer is:
♦ End debt creation by dramatic spending cuts;
♦ Curb the actions of the central bank; and
♦ Inspire economic growth through deregulation and agency elimination.

First, the end of debt creation is essential. Every time Congress authorizes more spending than is in the bank, the Treasury has to float debt to make it happen. That is the statutory obligation. What that means is that Congress needs to pass a balanced budget, ideally right away.
That comes down to the commission created by Elon Musk: the Department of Government Efficiency or DOGE. It is not an official department. It works as an outside advisory team. That’s excellent. They will likely push for a “Twitter-style” solution of firing 4 in 5 government workers to reduce costs directly.
That’s a start but it is not enough. There also must be sweeping elimination of agencies, each of which can save tens of billions and possibly a trillion or more in total. That needs to happen immediately. It can happen through executive order or through legislation. One way or another, the spending in excess of revenue has to stop.
Second, if the Treasury stops the T-bill tsunami, the Fed will not be called upon to sponge up the excess with money creation. You can look at the charts over the last year and see how the Biden/Harris administration was spending and working with the Fed to promote more economic illusion going into the election. That was the whole point of the rate cuts. That really must come to an end.

Third, Trump needs to fire up the wealth-creation engine of the American economy through dramatic, sweeping, historic levels of regulation torching plus the shock and awe of full agency elimination, same as in Argentina. The Trump team needs a list of 100 agencies to eliminate immediately but that should just be a start. Another 100 should be on the chopping block. Without all the regulatory clogging that they cause, investment will soar.
Tax cuts–income and capital–will assist here too. The crucial point is the focus on boosting supply and jobs as a way of outrunning inflationary forces. Here again, the financial press will scream about the economy “overheating” but that metaphor is worn out. The effect of economic growth on inflation is exactly the opposite. Economic growth can bury the effects of price increases.
There is not a lot of time, and it is a bargain that the Trump administration will surely lose if it does not act decisively and quickly. The debt creation and money creation must end and the economic growth through agency elimination and deregulation must become the top priority. All of this has the added advantage of making Trump more popular with the people who elected him.
There is no incompatibility between political success and economic rationality. In this case, the incoming Trump administration is very fortunate: they go together.


 The building association worries the new energy code will raise the state’s already high housing costs, locking out potential buyers. The code requires that new buildings meet a certain environmental “score.” Without the points from an electric heat pump, a builder will have to make up the difference with other green measures that run between $15,000 and $20,000 in a single-family home. “Every time they raise the price $1,000, it prices out another 500 Washington families,” says Greg Lane, the association’s executive vice president.


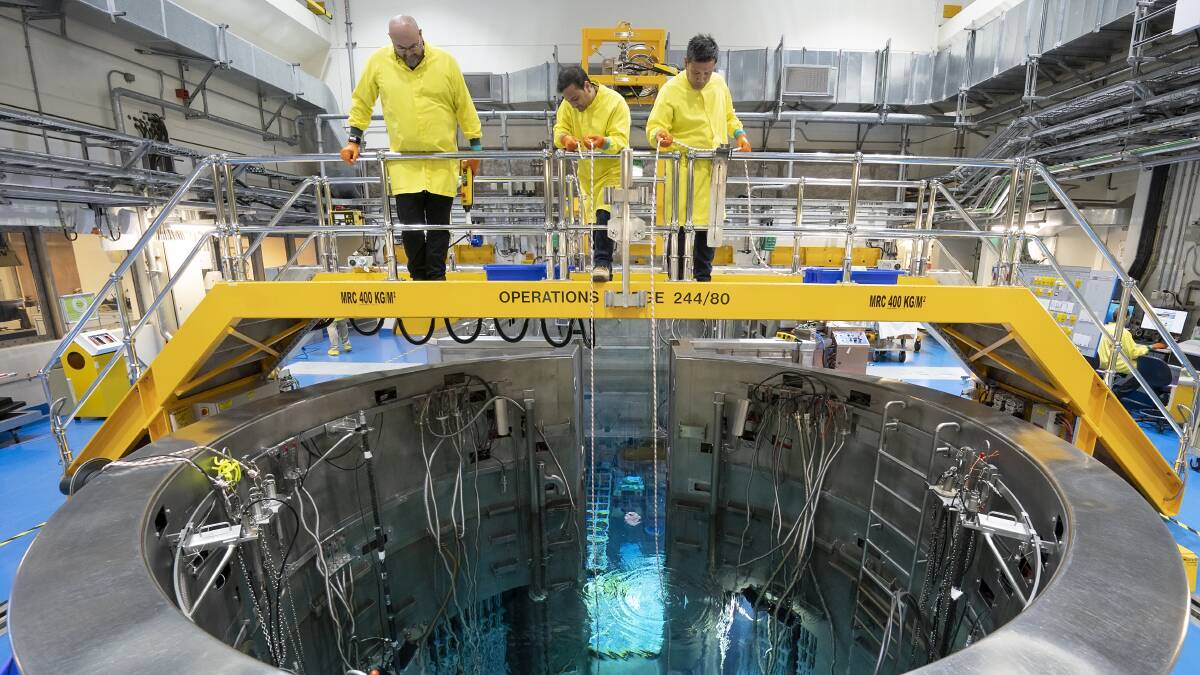 Cliff Reece reports on the reasons for anti-nuclear distortions in his Spectator Australia article


 Canada does not need another way to slow its economy. One