Sun Rules Earth Climate

On February 12, 2025, Tom Nelson conducted the above interview with solar physicist Valentina Zharkova: Grand solar minimum is underway. Below is my synopsis  of lightly edited transcript excerpts from the closed captions along with key graphics in her presentation. H/T Chiefio

The full content of the video is:

Time line of segments:
0:00 – Introduction to Valentina
0:35 – Understanding the Solar Cycles
4:25 – Challenges In Measuring Sun
5:10 – Discovering The Background (magnetic fields)
6:00 – Analyzing Magnetic Waves
7:50 – Predicting Solar Activity
14;45 – Grand Solar Minimum
27:25 – Implications of the Grand Solar Minimum
37:55 – CO2 and Temperature Correlation
39:10 – Solar Cycles and Earth’s Temperature
42:45 – Solar Inertial Motion and Climate
48:30 – Future Climate Predictions
1:05:20 – Volcanic Activity and Climate
1:07:30 – Earth’s Magnetic Field
1:12:10 – Concluding Thoughts

Transcript Excerpts

Today we’re talking again about Grand solar minimum but I also speak about a little bit of solar radiation and verification of the new solar activity index we discovered with the existing one which is derived by average Sunspot number.

Understanding the Solar Cycle and Sunspots

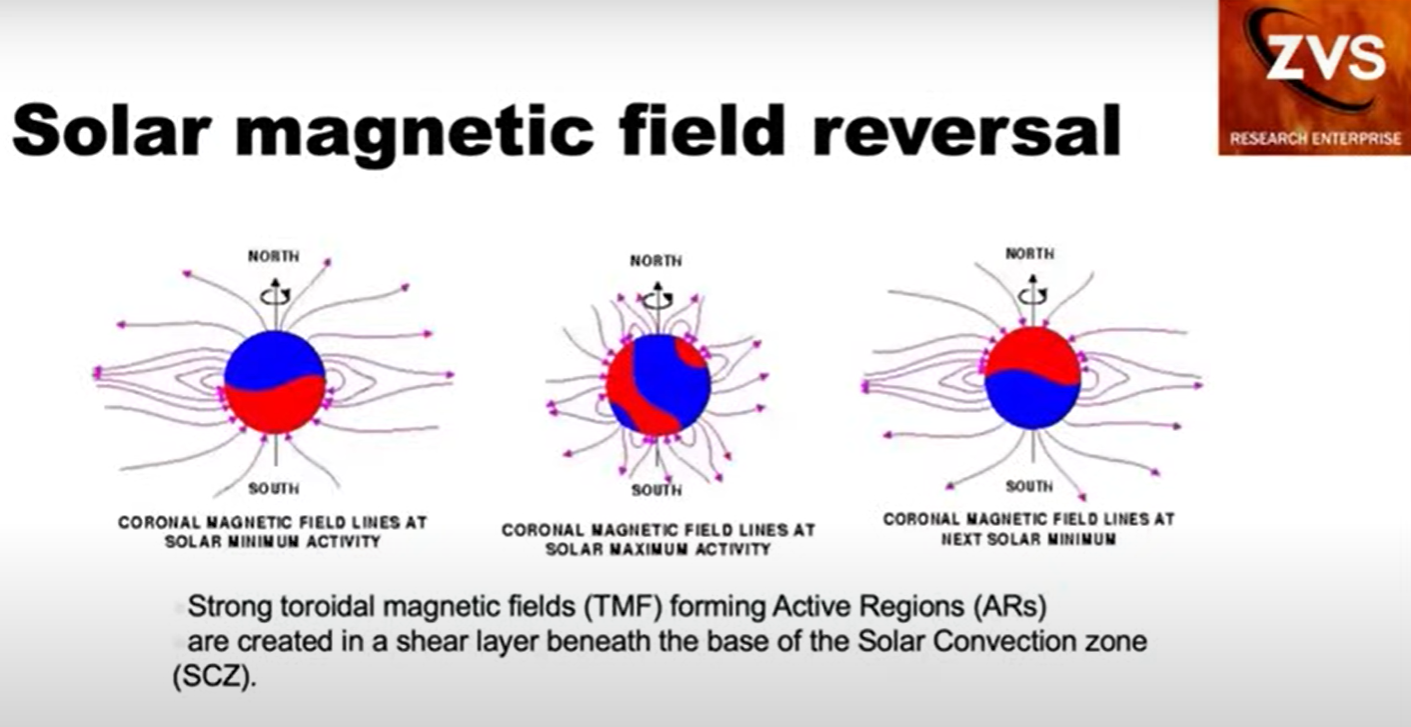
The solar activity cycle is about 11 years and on the Sun it occurs that in the start of the cycle on the left image the sun has Southern polarity.  And during the cycle this polarity slowly migrates in the opposite direction and so the next solar minimum you have polarity changed and this happens approximately every 11 years. so basically what is happening the the loops appear in the Solar surface and the occurring as the active region for forming coronal mass injections flares and different fluxes towards the Earth and other planets.
So in the past we were dealing  with the sunspots.  In the 18th century Wolff discovered that this Sunspot appears on this latitude 30° and migrates slowly towards the equator and basically this is the basic Solar activity index using daily average Sunspot numbers.

Why we love sunspots and why we support this for a couple of centuries is because sunspots actually are Roots which are embedded into the Photosphere (the surface layer of the Sun that gives off light).  And we see them from outside with the naked eye but basically they are the places where magnetic Loops are embedded.

The problem with Sunspots is that we see only a few of them.  Even with this Solar maximum there’s only a small part of the solar surface covered with them. Whatever we use to detect them, always the Sunspot index is defined by people manually.  They agree from different observatories what number of sunspots which configuration Etc.  So the Sunspot number changes during 11 year cycle.
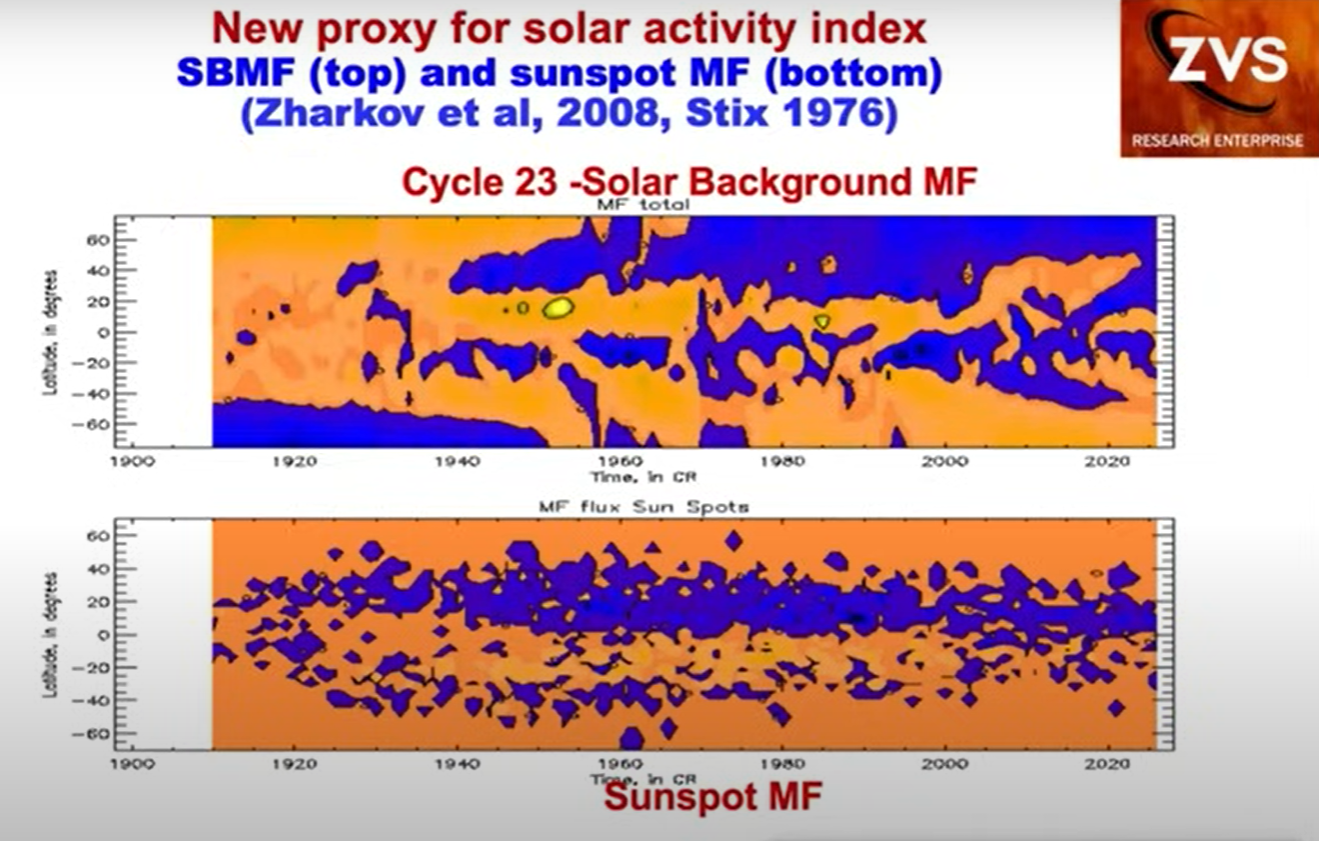
Discovering The Background (magnetic fields)

So we decided to look at the background field in which these sunspots are embedded so on the top is the B is the background magnetic field measured at solar observatory in Stanford with orange. So you see clearly that the leading polarity of Sunspot always opposite to the polarity of the background magnetic field in that hemisphere.  It was not only us who detected this it was others as well so it was very encouraging. We decided we can detect solar activity with much better accuracy.
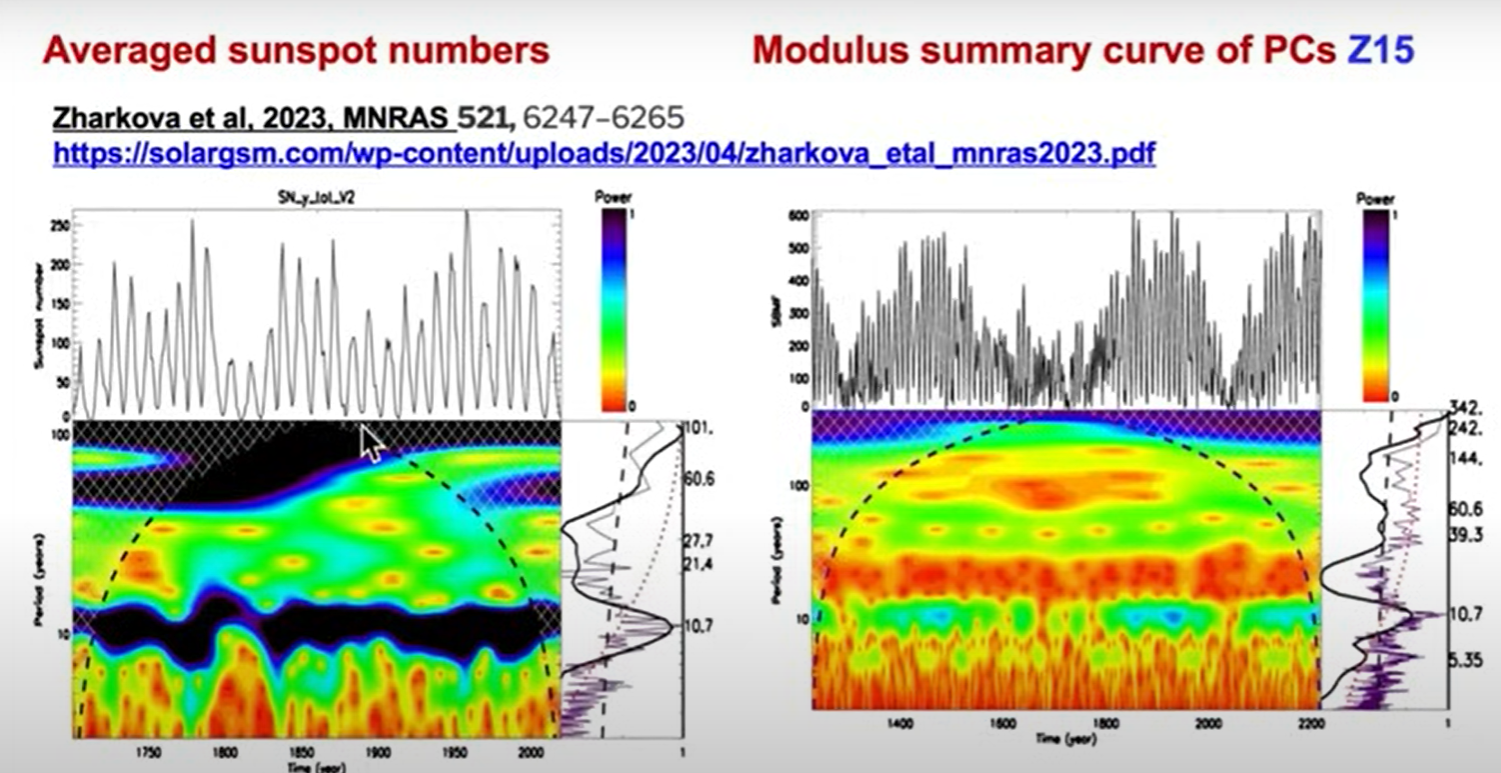
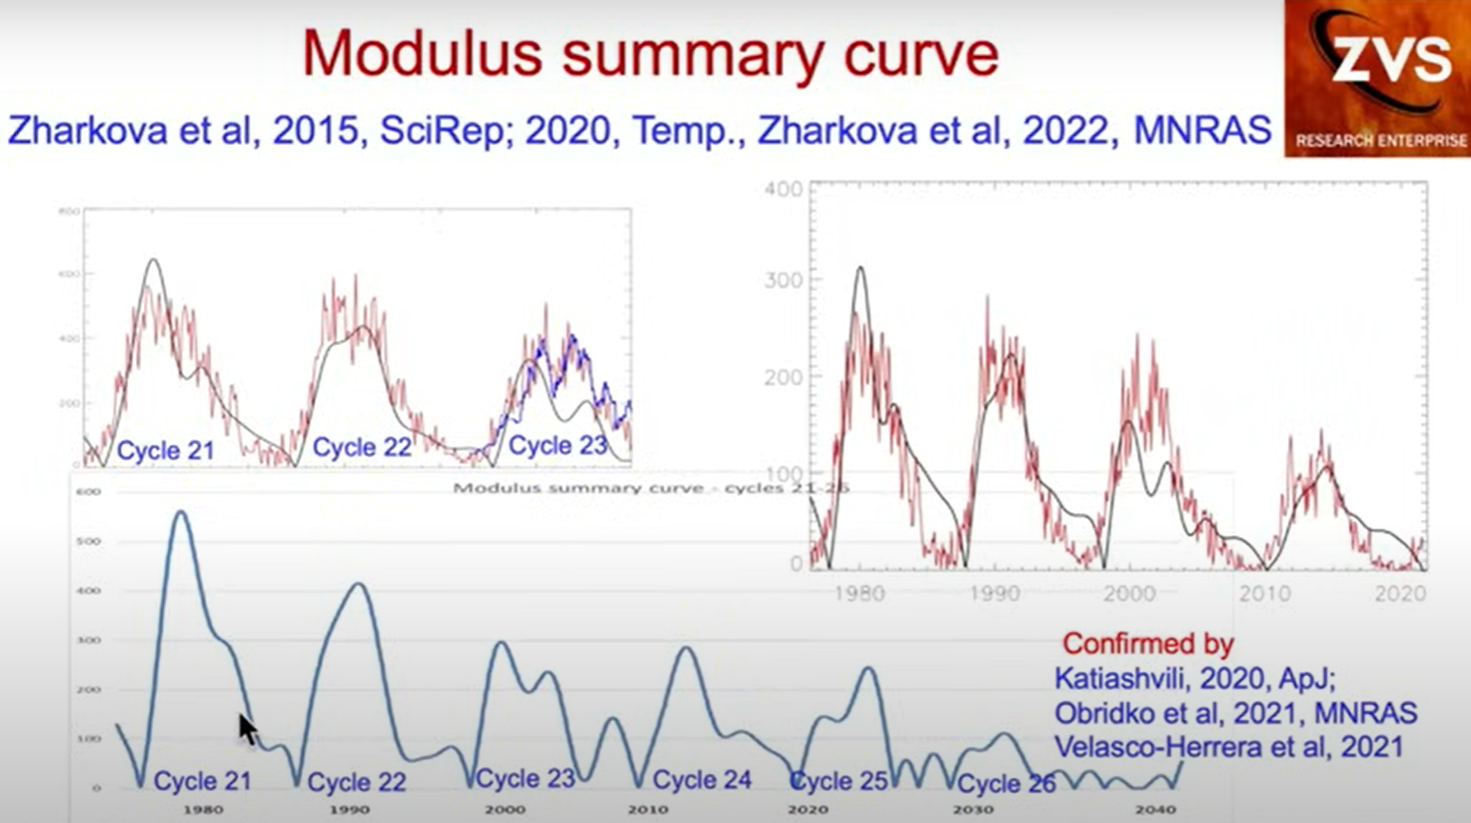
The black curve is our summary modulus summary curve and the red is a  sunspot number and you see that our a Vector summary Eigen vectors will represent this Solar, remembering that our index represents the magnetic field of the background Sun. In 2022 we added Cycle 24 and discovered that our curve still represents Sunspot index.  At the bottom is the summary curve modulus summary curve cycle 25 where we are now,   Here we see our prediction that the maximum will be actually year 23-24 and now there will be a very sharp drop of the activity, and we have two little Maxima before the minimum between cycle 25-26.  Cycle 26 will be have very low amplitude, 70% lower than the previous two cycles.
So how it works.   If you have two waves on the top two black waves which are running with the same amplitude but if the face difference is zero you have constructive interference.   In the cycle 26 we can see the amplitudes are going opposite with the resulting amplitude becoming zero.   This is what we observe on the sun and I teach my  first year physics students how they interact.   There’s no miracle, just basic physics of the waves and this effect called beat effect.
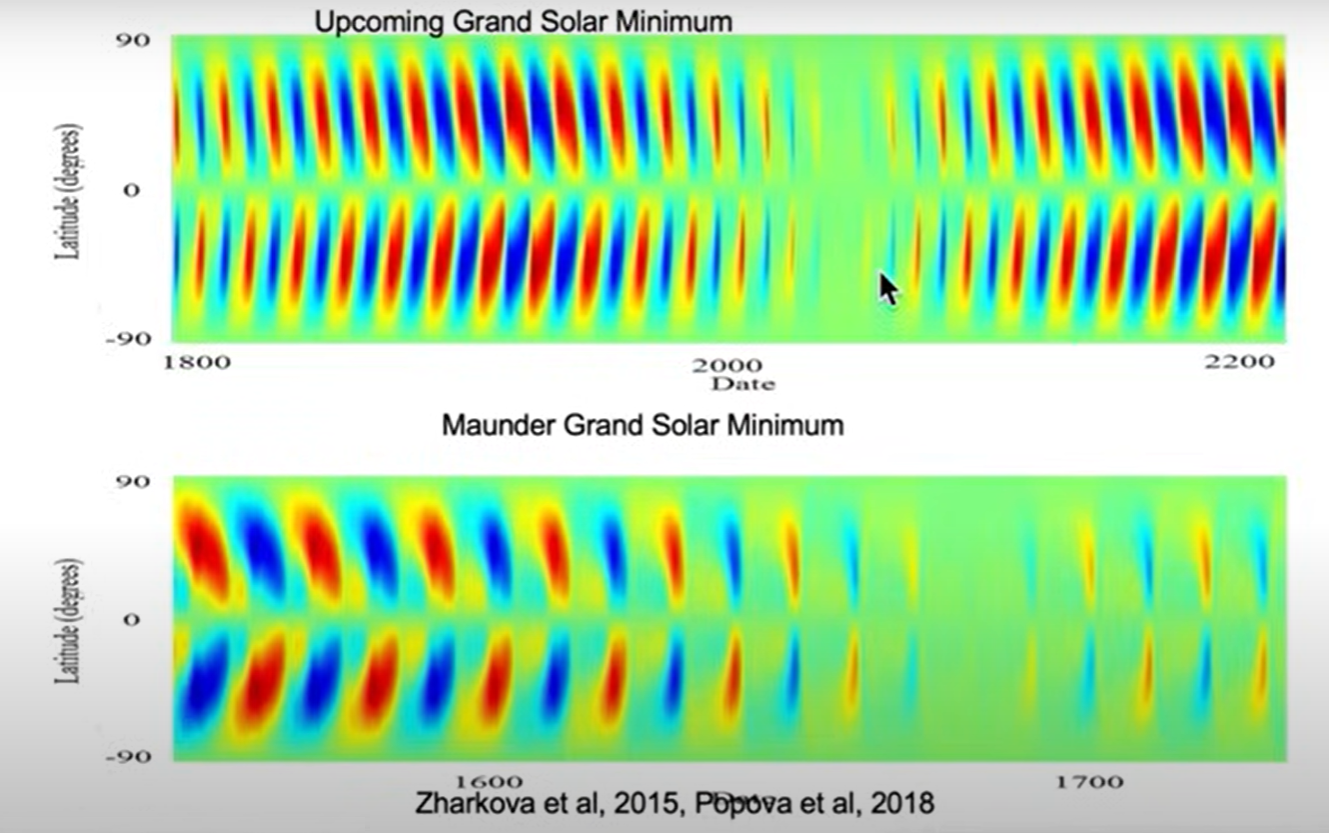
Implications of the Grand Solar Minimum

Now we come back to solar radiance and climate so first we now know that we entered into a grand solar minimum, the temperature started decreasing.  But the problem with the grand solar minimum is that during previous Grand solar minimum, which was the Maunder minimum in 17th century,  the Solar Radiance reduced by 3 watts per square meter approximately. But the temperature during Maunder minimum decreased approximately by one degree maximum.
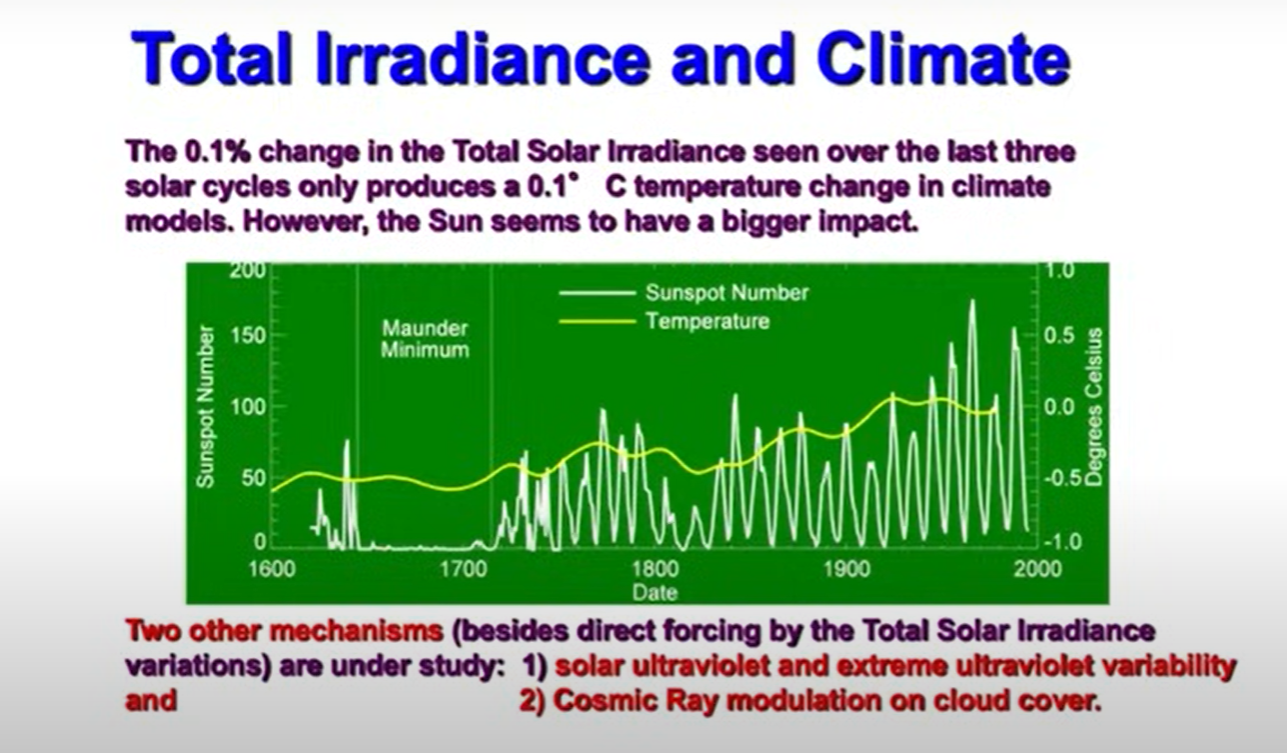
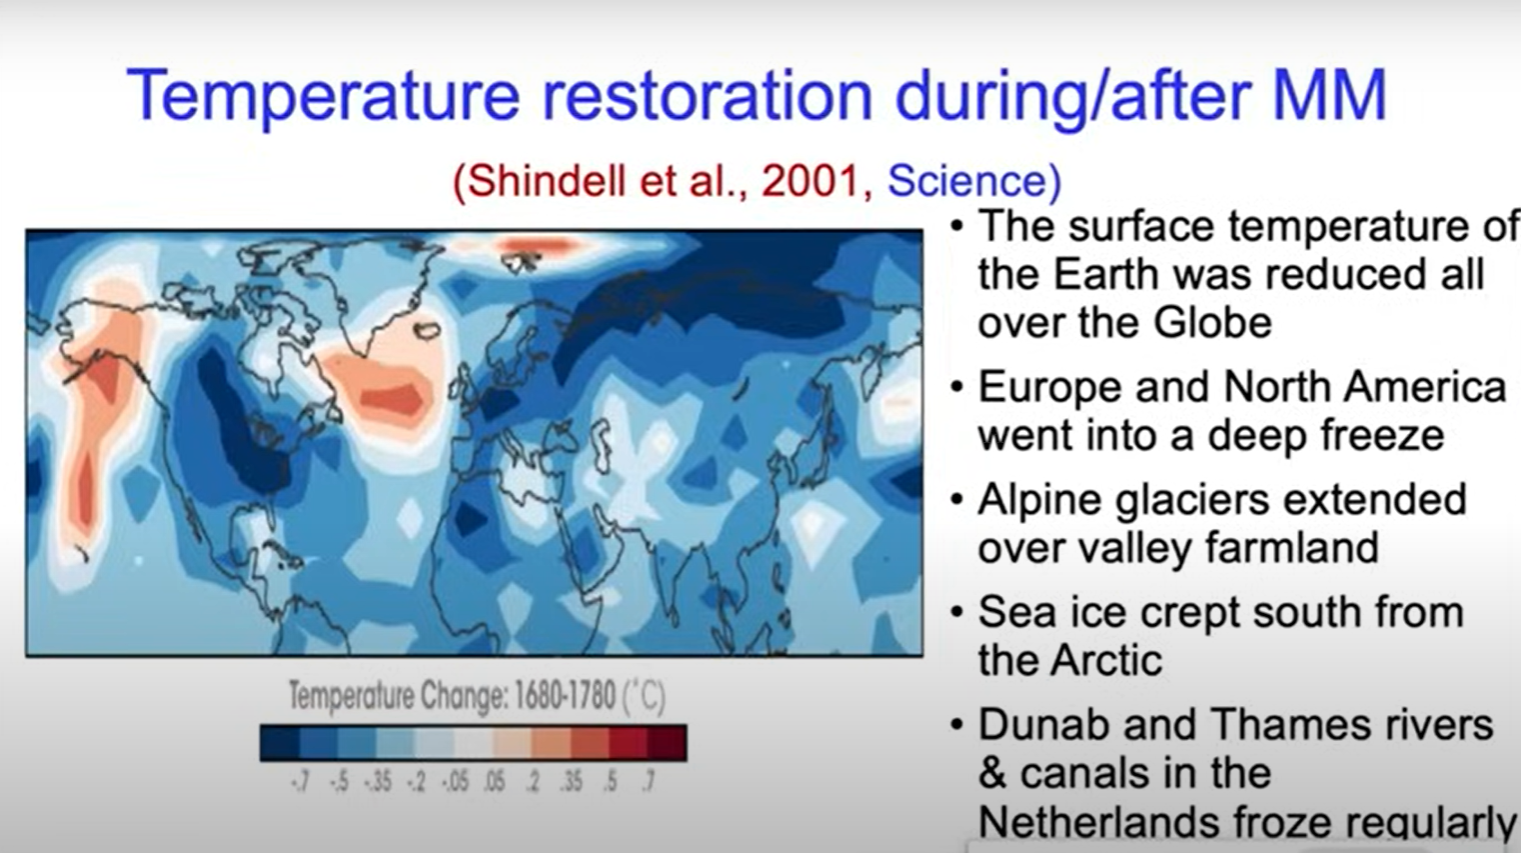
Different investigations show slightly different variations but mostly they all reconstruct temperatures during and after the minimum to find where the surface temperature was reduced on the the globe. So this is what you see for Northern Hemisphere, this is Europe, very dark blue is reduction of temperature by one degree.   And it is mostly all Europe, Russia and Siberia, and also all Northern America and Canada.
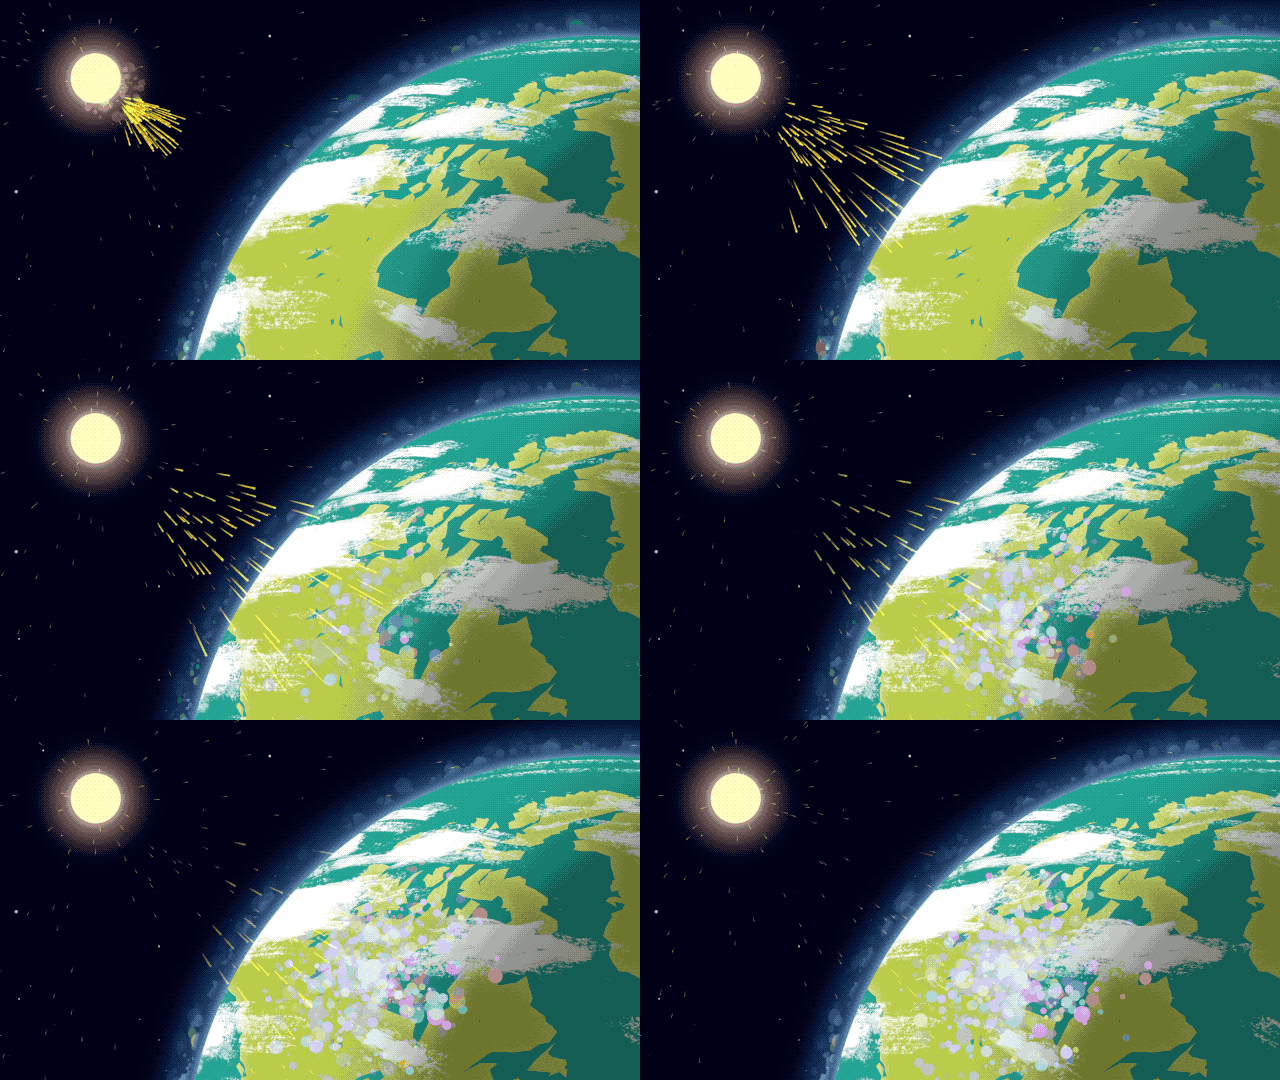
So basically this is probably we are heading towards now.  We have noticed the cold flashes from the drop of the temperature that occurred because drop of abundance of ozone created by solar ultraviolet light in the stratosphere.  If the solar radiation is reduced, this layer abundance of ozone is reduced and it affects planetary atmospheric waves.
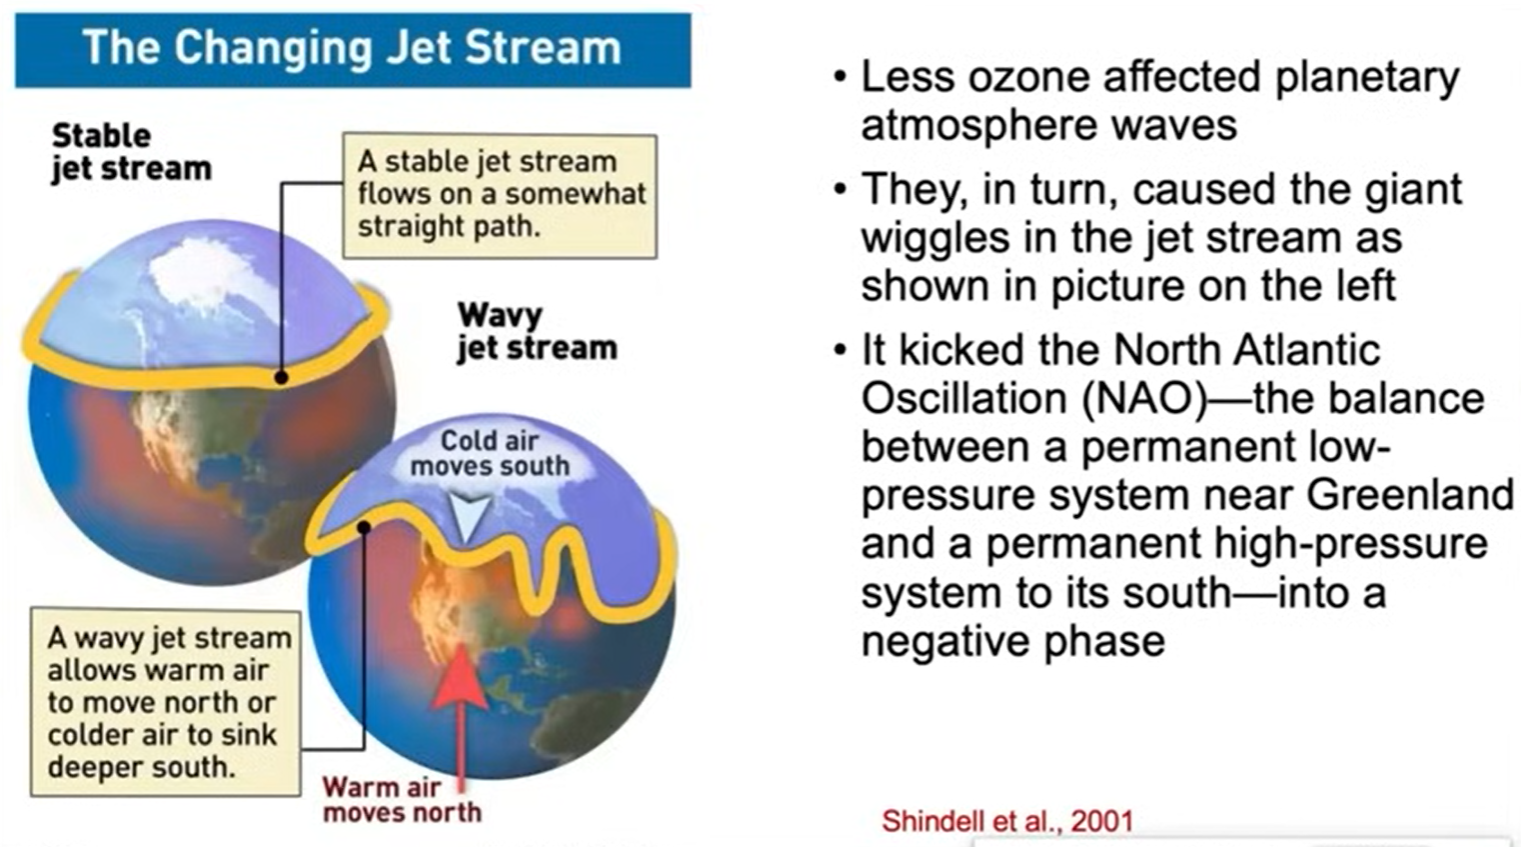
In the left image Globe the stable just stream flows somewhere in this path and separate middle latitude from the north Northern latitude, but when ozone layer is reduced it causes giant Wiggles in just stream shown in the right plot called wind from arctics can now penetrate to the southern latitudes as shown on the picture.  It kicks off North Atlantic oscillation and balance between permanent low pressure system near Greenland and permanent high pressure system and the South into Negative PH. It was reported 24 years ago go and it works now.
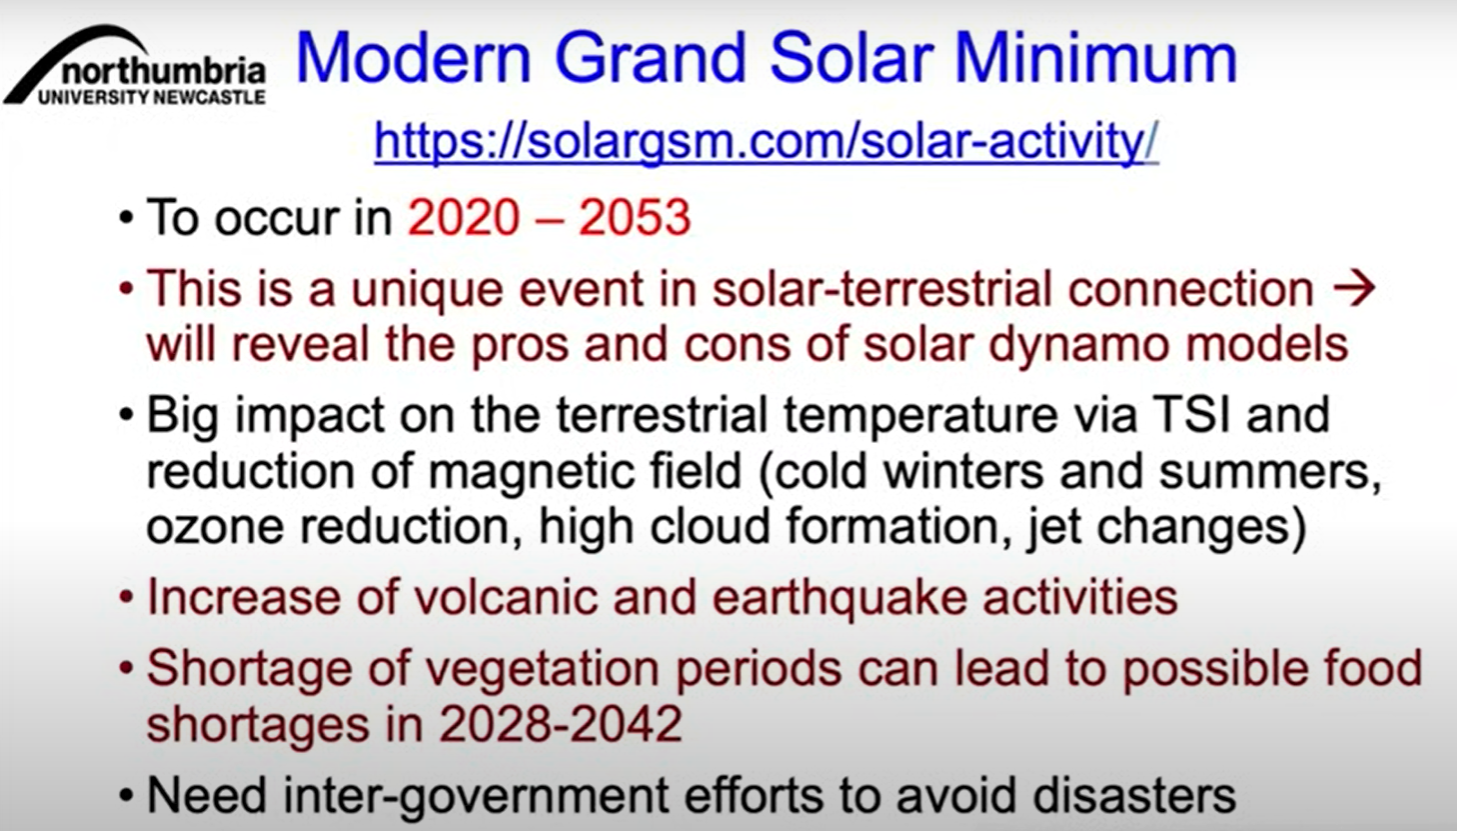
We are trying now to say that the temperature will be increasing because the sun become closer to us but the sun is very humane it gives us this grand solar minimum for 30 years to sort out our understanding how the heating comes through and then prepare for the next stage of heating which come does no matter what we do on Earth; if we stop using fuels, we crawl to the caves and start using I don’t know what energy.   All people will die still the temperature will increase, it doesn’t matter what we do.

So this prediction of the anthropogenic global warming people is not working.  The temperature will be increasing no matter what we do with CO2 because the increase of the temperature comes from the solar inertial motion.   So this my conclusion: We had this global warming–it is real;  it is not caused by humans because human only contribute 6% maximum of all CO2.  And CO2 is a very good gas because it is mostly absorbed by the plants and not by humans.

Global warming is caused by this Solar inertial motion and gravitation of large planets which drag the Sun from the center Body Center closer to the planets and this causes the increase of the  temperature.  And the temperature as I shown in my book will increase by 2.5-3° by 25-2600 years. This is the end of the story.
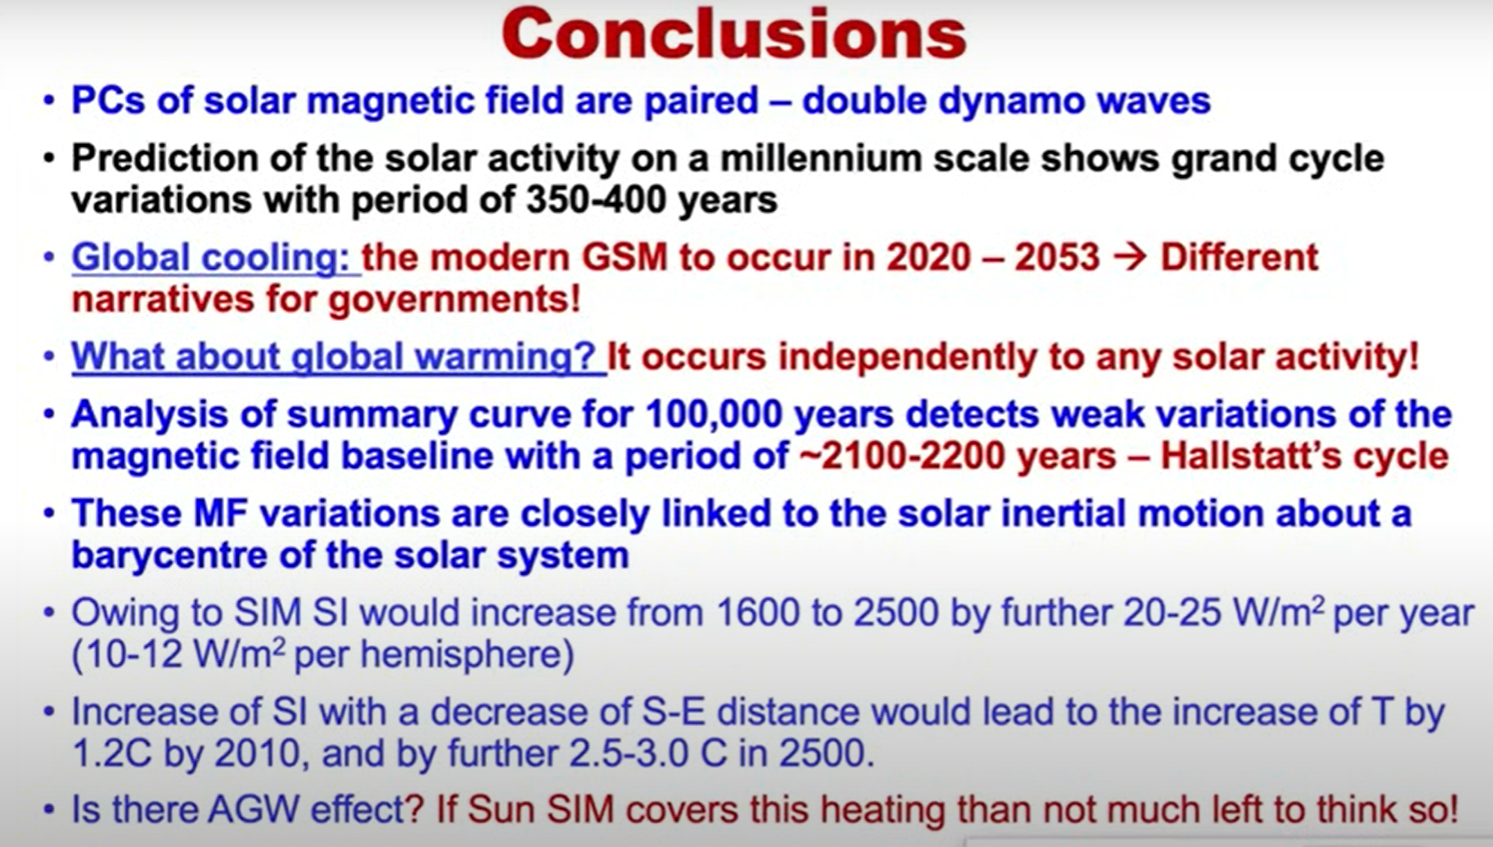
TN: Thank you it sounds like we’re due for some cooling between now and 2053 but warming in general between then and 2600.  I’m curious, do you think we’re going to see the temperatures freeze over at all?

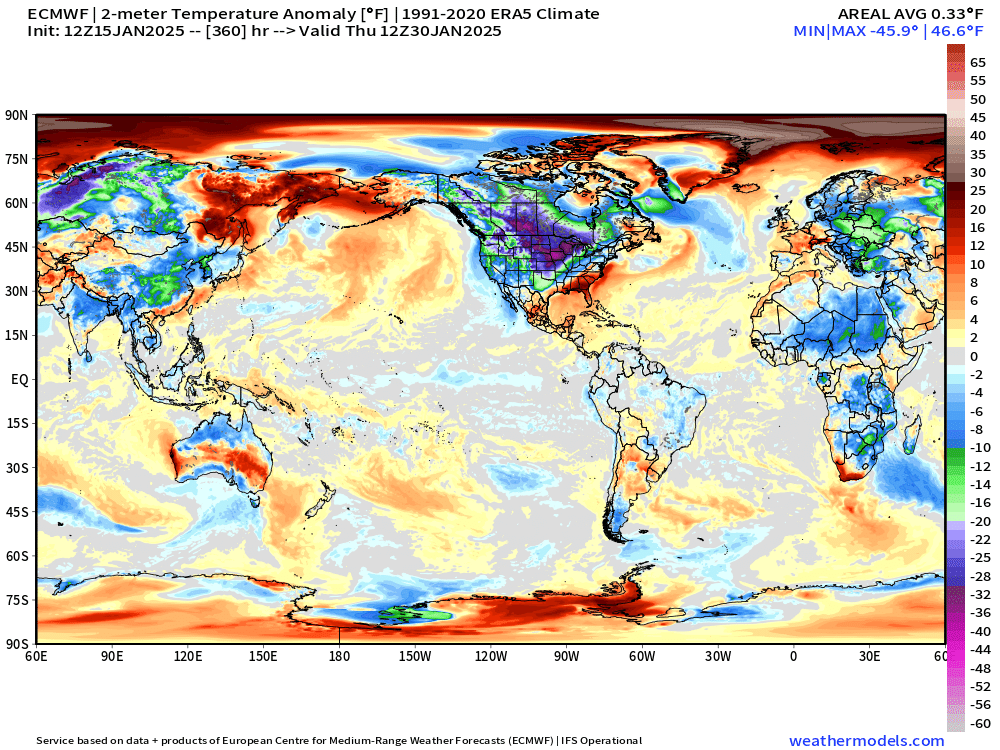
Yes, I’m confident it will be freezing from 2031 to 2042 for sure.  This will be the worst period of cold air and cold temperature and not only temps.  Rivers and the ponds will be freezing all right and other dramatic things that might happen.  It’s going to be a lot harder to grow wheat in Canada for example, I would guess during that time absolutely.  In 17th century people heated their houses with their own fireplaces, now we have central heating.  If we don’t have electricity even our Central heating is not working, so you need to have the portable generators run from fossil fuel or have a wood stove in your house.  At that time people grew up something in their Gardens, now people don’t know how to grow up anything, so it will be really really difficult.
See Also:

Zharkova on Solar Forcing and Global Cooling

No, Grist, MSN, et al: CO2 Is Not Making Oceans Boil


The Climate Crisis media network is announcing a new claim that rising CO2 is causing recent ocean warming, proving it’s dangerous and must be curtailed.  Examples in the last few days include these:

Finally, an answer to why Earth’s oceans have been on a record hot streak Grist

Ocean warming 4 times faster than in 1980s — and likely to accelerate in coming decades MSN

News spotlight: Fossil fuels behind extreme ocean temperatures, study says. Conservation International

Ocean temperature rise accelerating as greenhouse gas levels keep rising UK Natural History Museum

The surface of our oceans is now warming four times faster than it was in the late 1980s The Independent UK

Oceans Are Warming Four Times Faster as Earth Traps More Energy Bloomberg Law News

All this hype deriving from one study,
and ignoring the facts falsifying that narrative.

Fact:  Historically, ocean natural oscillations drive observed global warming.

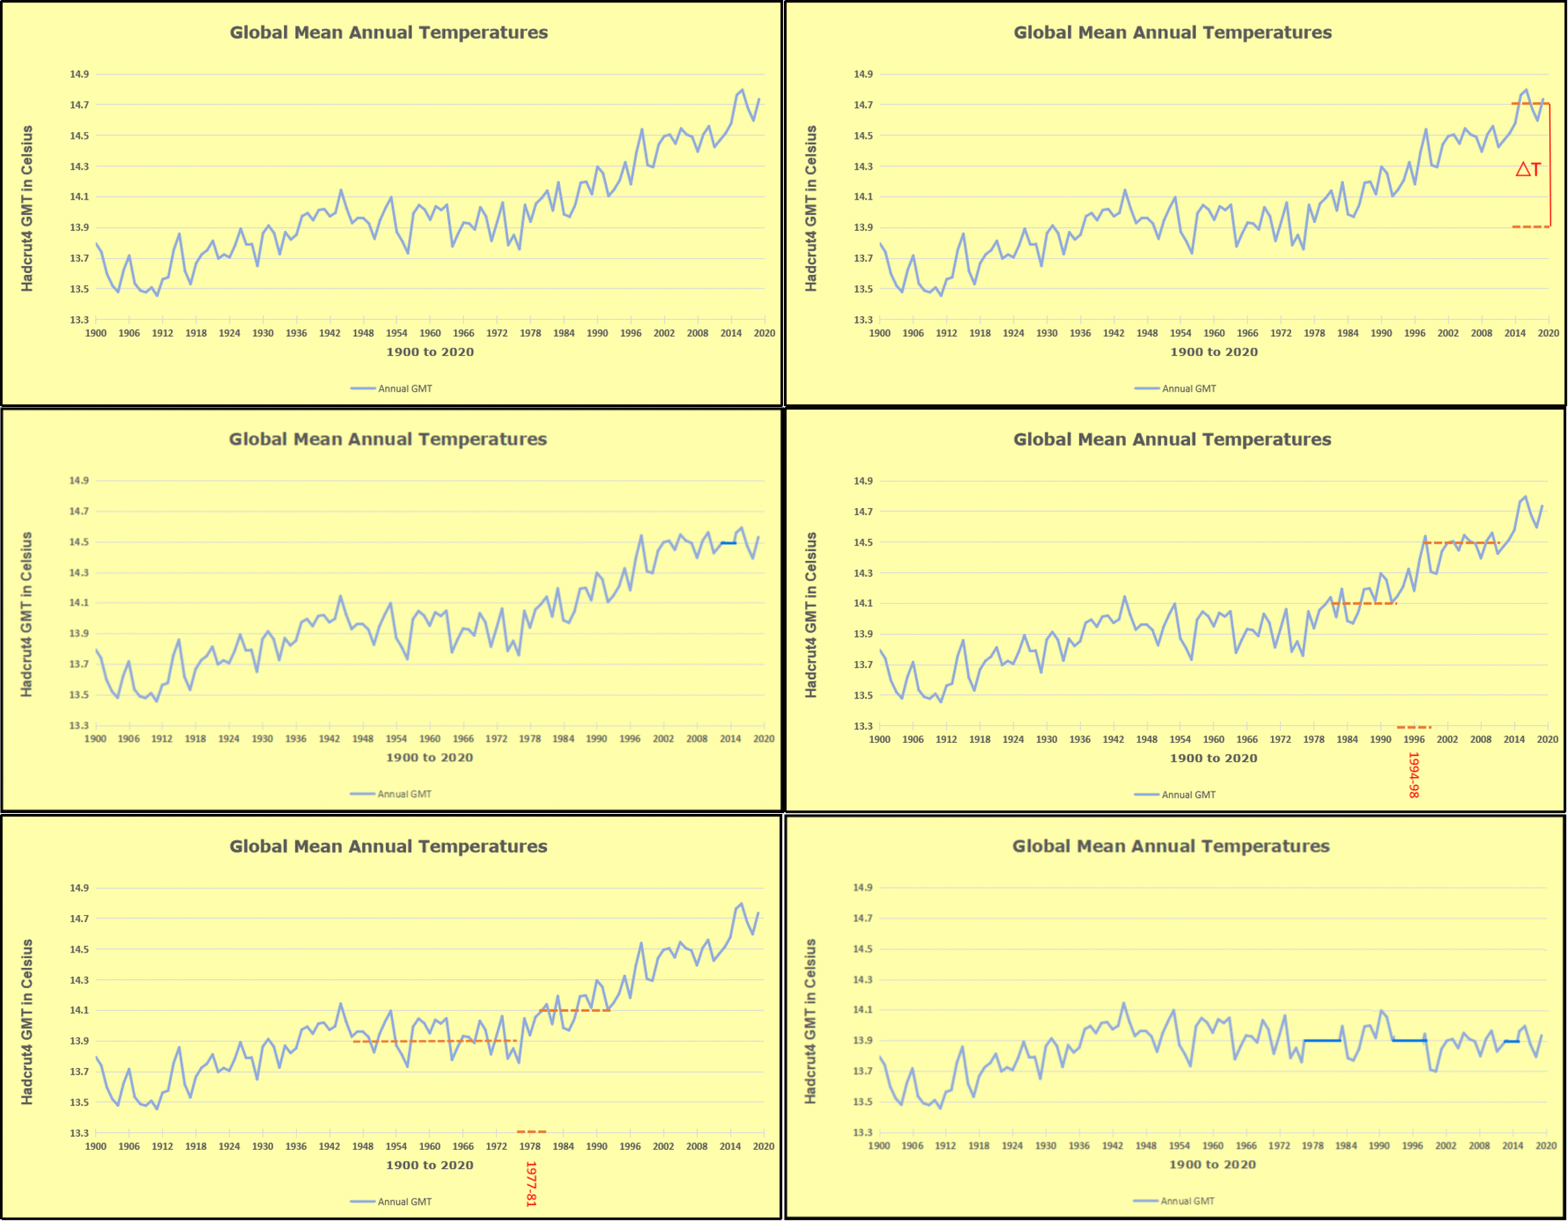
The long record of previous warmings prior to the satellite record shows that the entire rise of 0.8C since 1947 is due to oceanic, not human activity.

The animation is an update of a previous analysis from Dr. Murry Salby.  These graphs use Hadcrut4 and include the 2016 El Nino warming event.  The exhibit shows since 1947 GMT warmed by 0.8 C, from 13.9 to 14.7, as estimated by Hadcrut4.  This resulted from three natural warming events involving ocean cycles. The most recent rise 2013-16 lifted temperatures by 0.2C.  Previously the 1997-98 El Nino produced a plateau increase of 0.4C.  Before that, a rise from 1977-81 added 0.2C to start the warming since 1947.

Importantly, the theory of human-caused global warming asserts that increasing CO2 in the atmosphere changes the baseline and causes systemic warming in our climate.  On the contrary, all of the warming since 1947 was episodic, coming from three brief events associated with oceanic cycles.

FactRecent rise in SST was driven by ENSO and N. Atlantic Anomalies.

And now in 2024 we have seen an amazing episode with a temperature spike driven by ocean warming in all regions, along with rising NH land temperatures, now dropping below its peak.

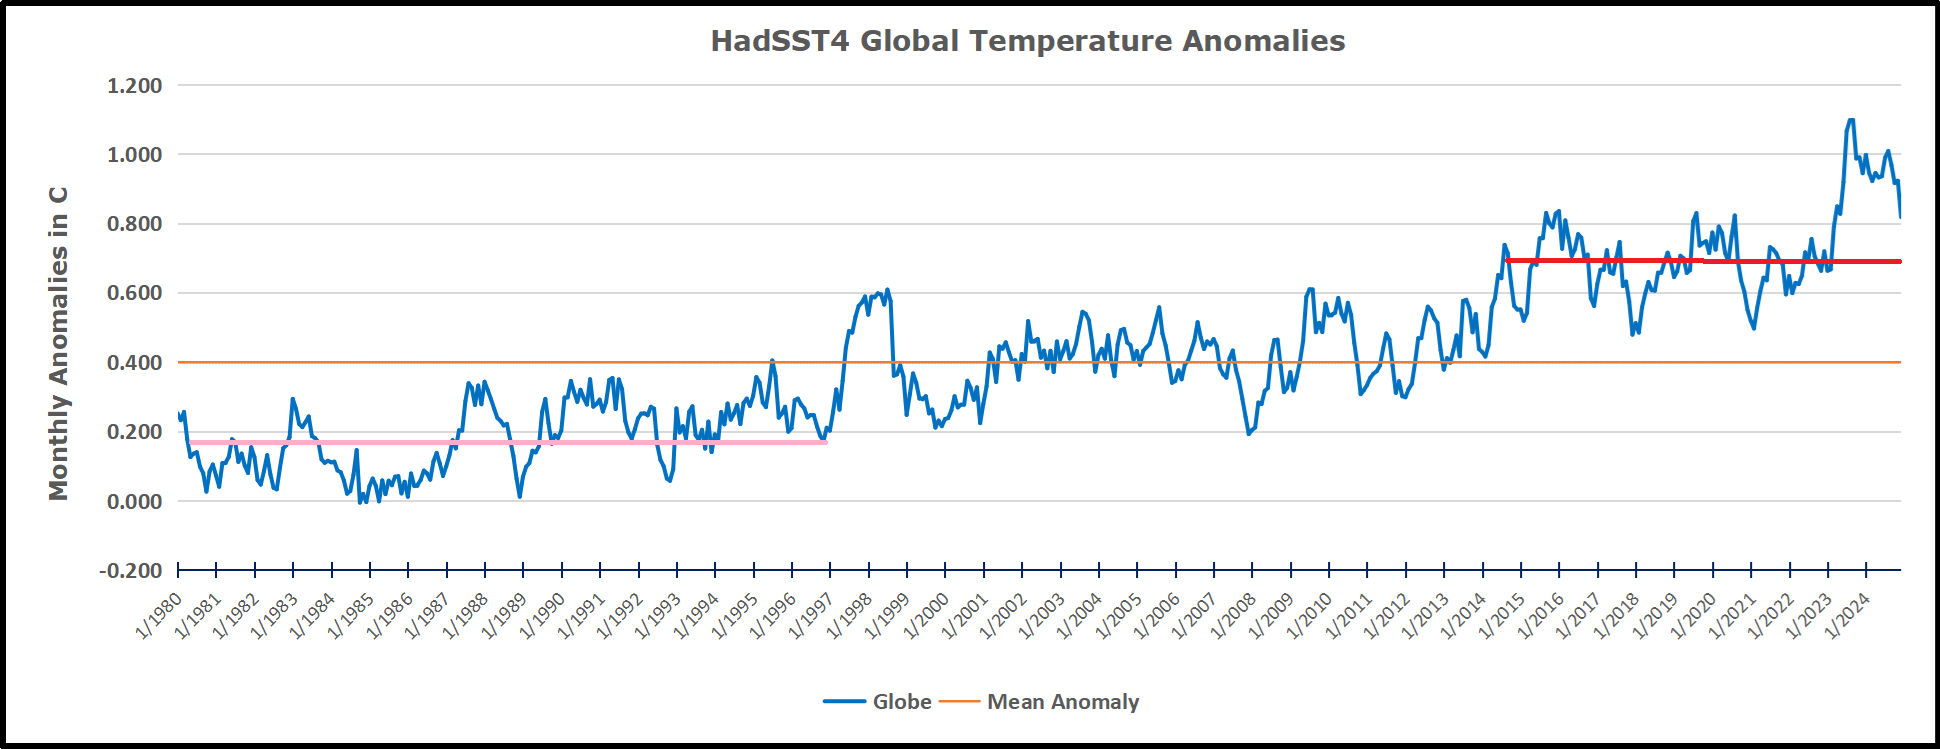
The chart below shows SST monthly anomalies as reported in HadSST4 starting in 2015 through December 2024.  A global cooling pattern is seen clearly in the Tropics since its peak in 2016, joined by NH and SH cycling downward since 2016, followed by rising temperatures in 2023 and 2024.

To enlarge, open image in new tab.

Note that in 2015-2016 the Tropics and SH peaked in between two summer NH spikes.  That pattern repeated in 2019-2020 with a lesser Tropics peak and SH bump, but with higher NH spikes. By end of 2020, cooler SSTs in all regions took the Global anomaly well below the mean for this period.  A small warming was driven by NH summer peaks in 2021-22, but offset by cooling in SH and the tropics, By January 2023 the global anomaly was again below the mean.

Now in 2023-24 came an event resembling 2015-16 with a Tropical spike and two NH spikes alongside, all higher than 2015-16. There was also a coinciding rise in SH, and the Global anomaly was pulled up to 1.1°C last year, ~0.3° higher than the 2015 peak.  Then NH started down autumn 2023, followed by Tropics and SH descending 2024 to the present. After 10 months of cooling in SH and the Tropics, the Global anomaly came back down, led by NH cooling the last 4 months from its peak in August. It’s now about 0.1C higher than the average for this period. Note that the Tropical anomaly has cooled from 1.29C in 2024/01 to 0.66C as of 2024/12.

FactEmpirical measurements show ocean warms the air, not the other way around.

One can read convoluted explanations about how rising CO2 in the atmosphere can cause land surface heating which is then transported over the ocean and causes higher SST. But the interface between ocean and air is well described and measured. Not surprisingly it is the warmer ocean water sending heat into the atmosphere, and not the other way around.

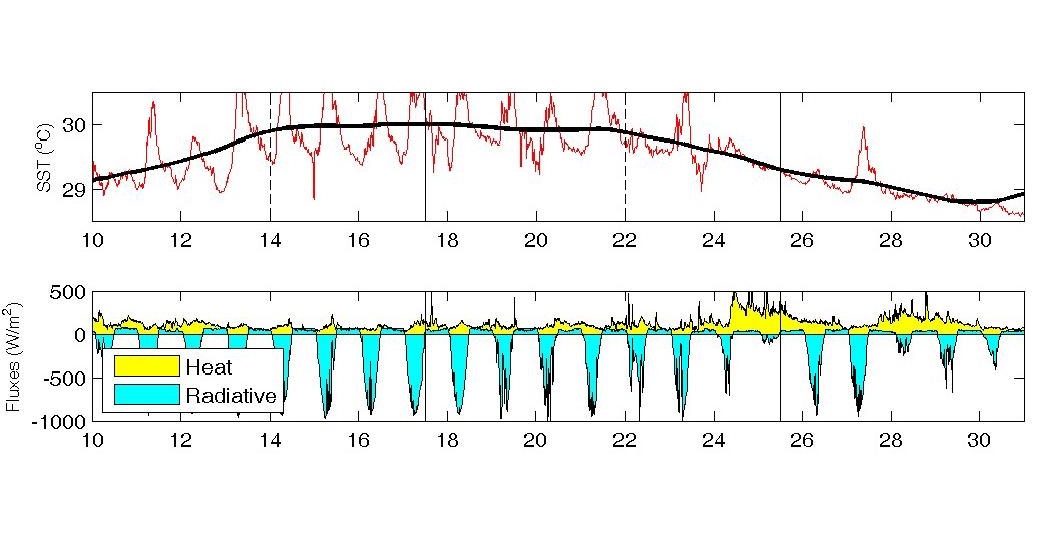
The graph displays measures of heat flux in the sub-tropics during a 21-day period in November. Shortwave solar energy shown above in green labeled radiative is stored in the upper 200 meters of the ocean. The upper panel shows the rise in SST (Sea Surface Temperature) due to net incoming energy. The yellow shows latent heat cooling the ocean, (lowering SST) and transferring heat upward, driving convection. [From An Investigation of Turbulent Heat Exchange in the Subtropics by James B. Edson]

As we see in the graphs ocean circulations change sea surface temperatures which then cause global land and sea temperatures to change. Thus, oceans make climate by making temperature changes.

FactOn all time scales, from last month’s observations to ice core datasets spanning millennia, temperature changes first and CO2 changes follow.

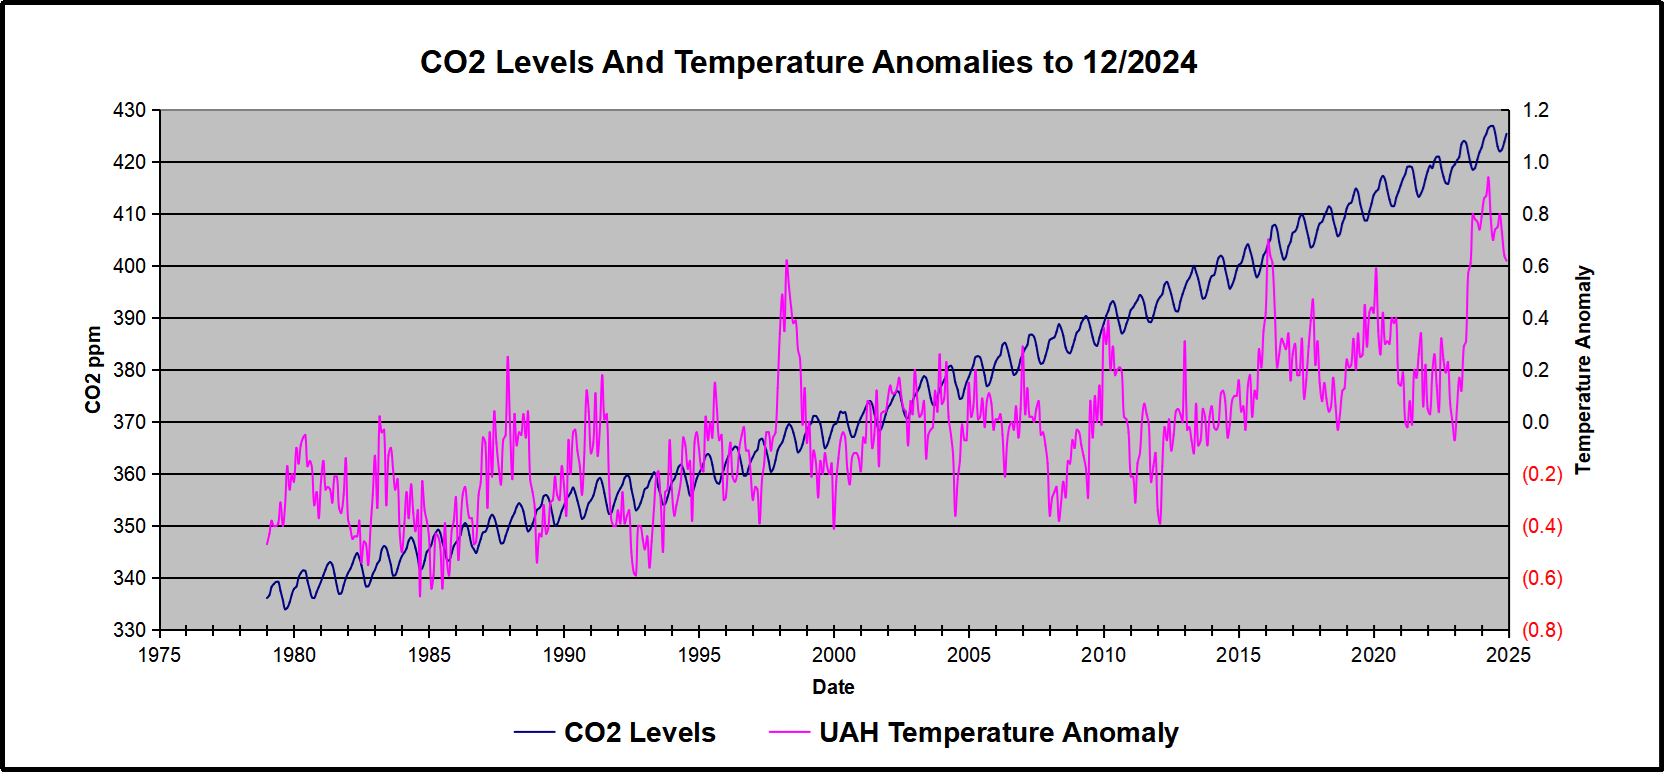
Previously I have demonstrated that changes in atmospheric CO2 levels follow changes in Global Mean Temperatures (GMT) as shown by satellite measurements from University of Alabama at Huntsville (UAH). That background post is included in the posting referenced later below.

My curiosity was piqued by the remarkable GMT spike starting in January 2023 and rising to a peak in April 2024, and then declining afterward.  I also became aware that UAH has recalibrated their dataset due to a satellite drift that can no longer be corrected. The values since 2020 have shifted slightly in version 6.1, as shown in my recent report  Ocean Leads Cooling UAH December 2024.

I tested the premise that temperature changes are predictive of changes in atmospheric CO2 concentrations.  The chart above shows the two monthly datasets: CO2 levels in blue reported at Mauna Loa, and Global temperature anomalies in purple reported by UAHv6.1, both through December 2024. Would such a sharp increase in temperature be reflected in rising CO2 levels, according to the successful mathematical forecasting model? Would CO2 levels decline as temperatures dropped following the peak?

The answer is yes: that temperature spike resulted
in a corresponding CO2 spike as expected.
And lower CO2 levels followed the temperature decline.

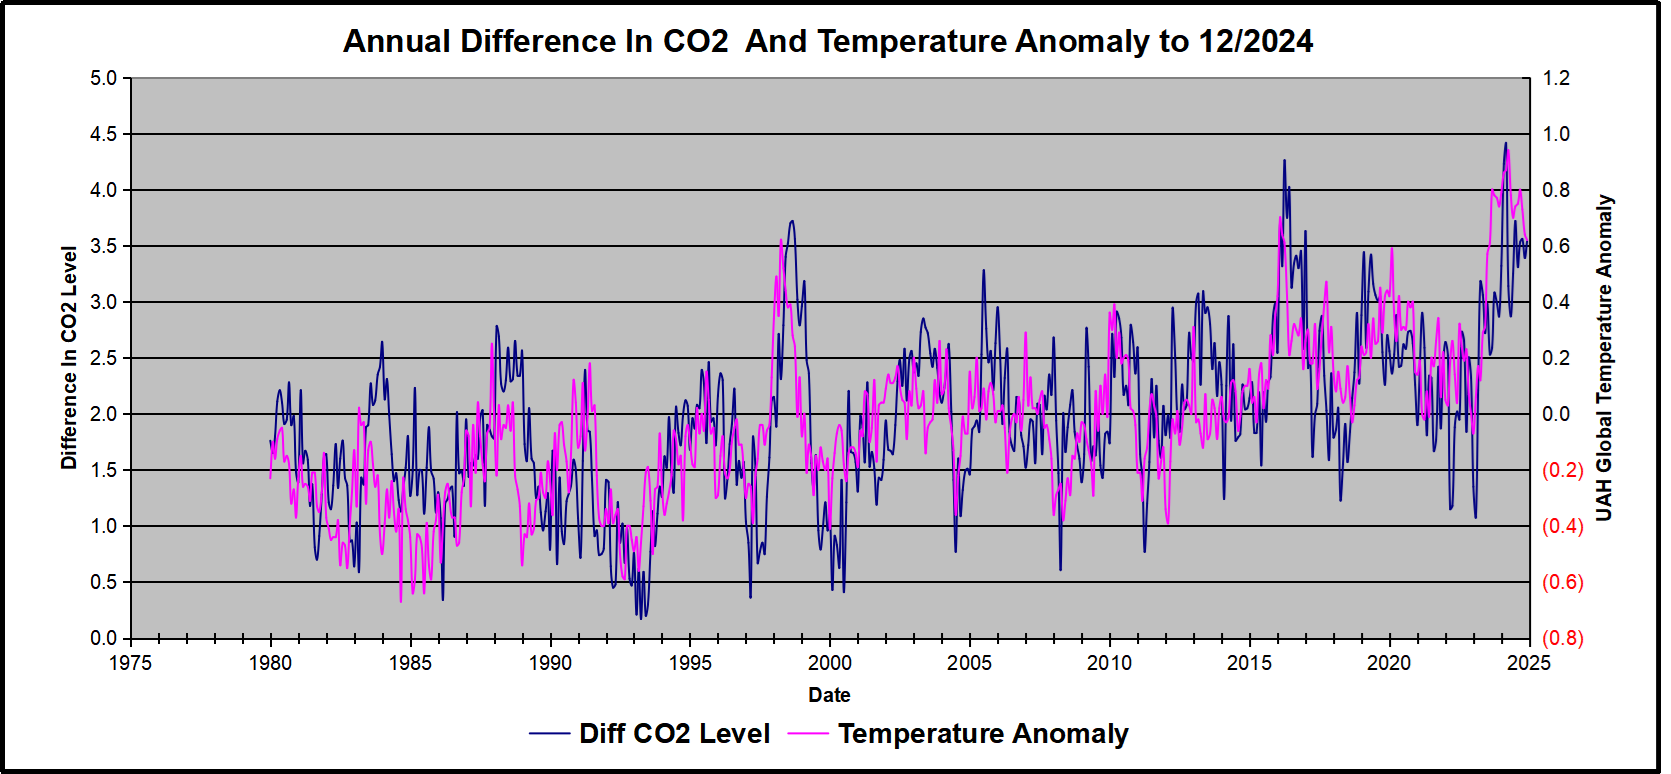
Above are UAH temperature anomalies compared to CO2 monthly changes year over year.

Changes in monthly CO2 synchronize with temperature fluctuations, which for UAH are anomalies now referenced to the 1991-2020 period. CO2 differentials are calculated for the present month by subtracting the value for the same month in the previous year (for example December 2024 minus December 2023).  Temp anomalies are calculated by comparing the present month with the baseline month. Note the recent CO2 upward spike and drop following the temperature spike and drop.

Summary

Changes in CO2 follow changes in global temperatures on all time scales, from last month’s observations to ice core datasets spanning millennia. Since CO2 is the lagging variable, it cannot logically be the cause of temperature, the leading variable. It is folly to imagine that by reducing human emissions of CO2, we can change global temperatures, which are obviously driven by other factors.

12/2024 Update–As Temperature Changes, CO2 Follows


Left Coast Climate Delusion Ends in Flames

Satellite images of wildfires burning in Southern California By NBC Staff • Published January 11, 2025

Holman W. Jenkins, Jr. writes in Wall Street Journal End of a Climate Delusion.  Excerpts in italics with my bolds and added images.

Amid California’s fires, voters wake up from the dream that green pork is a solution.

CO2 emitted into the atmosphere is rapidly and, for all practical purposes, uniformly distributed around the planet.

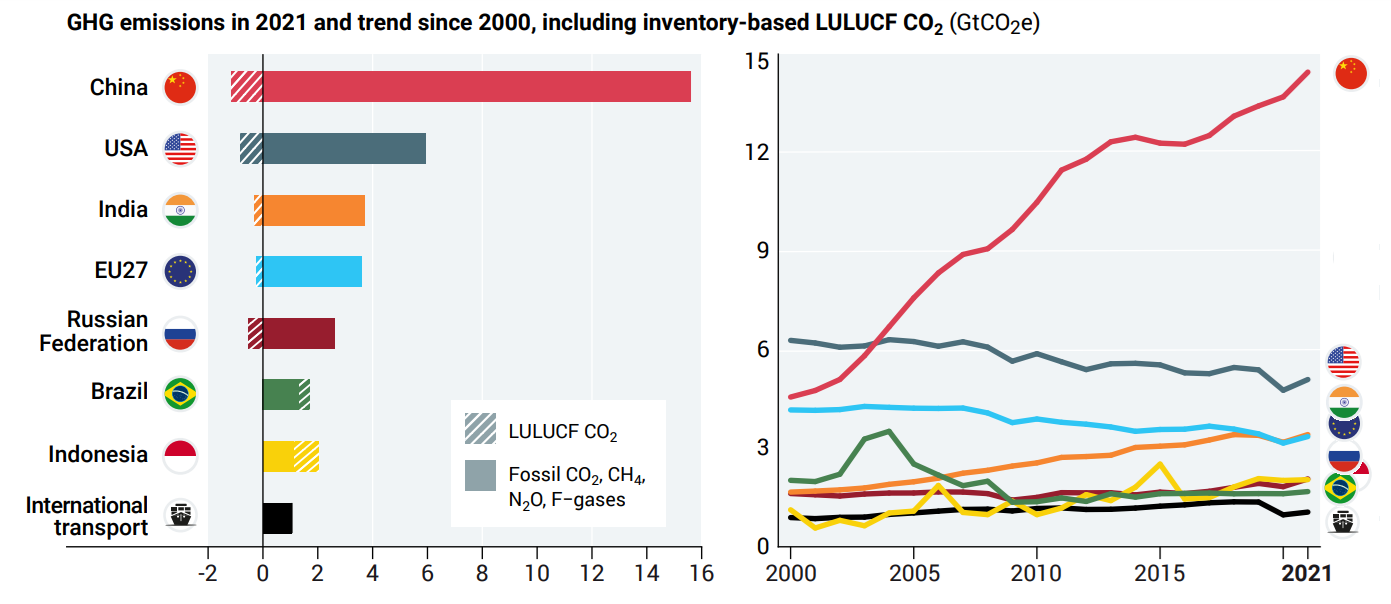
I may be stating the obvious but it needs to be pointed out. Voters and even political leaders are surprisingly poorly informed on this point. Emissions cuts in California don’t have any significant effect on California’s climate. They also have no global effect. California’s cuts are too small relative to the global whole; they also are largely illusory.

Emitting industries leave the state. They don’t stop emitting. If California imports Canadian hydro to charge its electric vehicles, consumers elsewhere have to burn more coal and gas. If Californians drive EVs, more gasoline is free to be burned by others, releasing more CO2 that influences climate change in California and everywhere else.

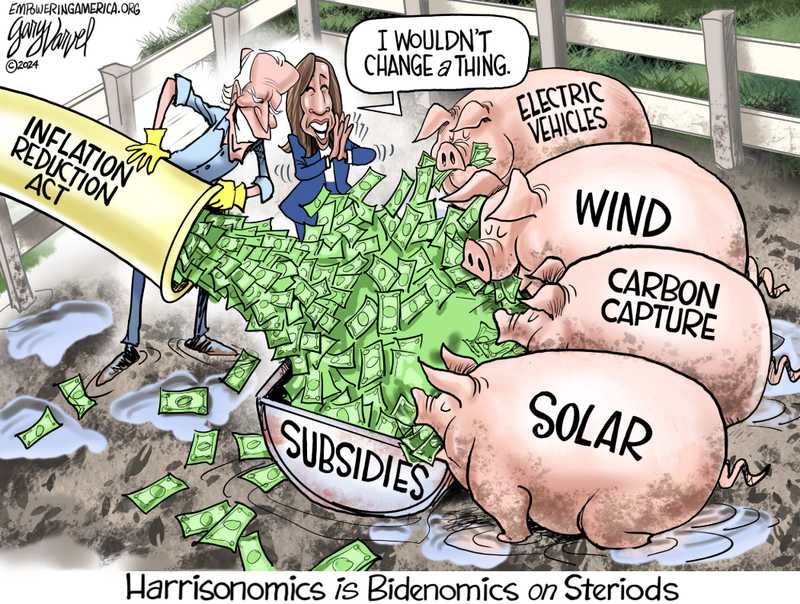
Green-energy subsidies do not reduce emissions. This will be news to millions of California voters. It contradicts a central tenet of state policy. It isn’t news to the actual enactors of these subsidies. A National Research Council study sponsored by congressional Democrats in 2008 concluded that such handouts were a “poor tool for reducing greenhouse gases” and called for carbon taxes instead.

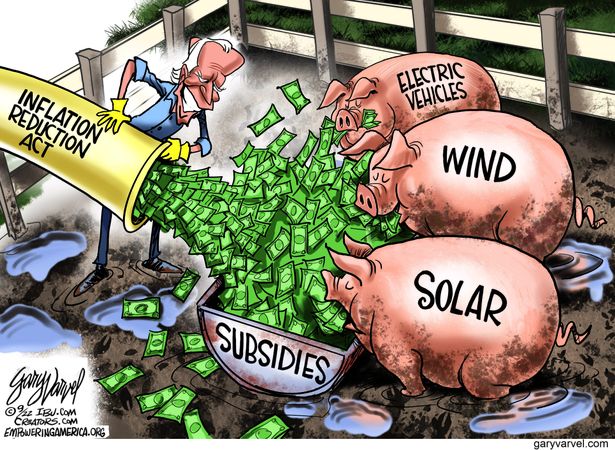
Unfortunately, the incoming Obama administration quickly discovered it favored climate taxes only when Republicans were in charge. Backers would later engage in flagrant lying to promote Joe Biden’s Inflation Reduction Act, knowingly citing bogus predictions that its trillion-dollar spending profusion would reduce emissions.

A 2019 University of Oregon study had already revealed the empirical truth: Green energy doesn’t replace fossil fuels, it enables more energy consumption overall. That same year the EPA calculated that the potential emissions savings from subsidizing electric vehicles had been offset five times over by the pickup truck and SUV boom Team Obama facilitated to assure the success of its auto bailout.

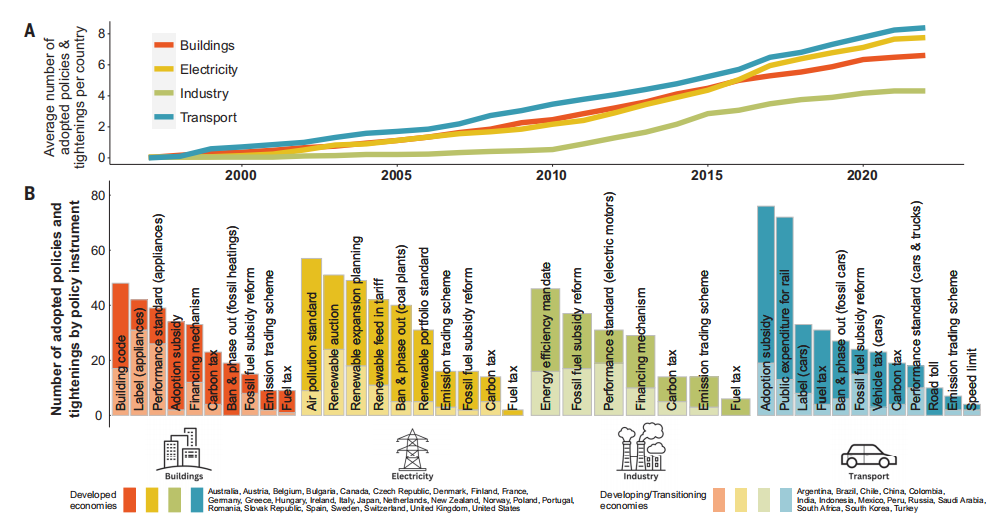
American Association for the Advancement of Science study finds that of 1,500 “climate” policies announced around the world, a mere 63, or 4%, produce any reduction in emissions.

Last year, the premier journal Science put a nail in the question: 96% of policies supported worldwide as “reducing” emissions failed to do so, consisting mostly of handouts to green-energy interests.

And yet certain Journal readers still assail me with the epithet “denier.” They confuse my criticism of Democratic hypocrisy with my imagined views on climate science. As I’ve written back to many, “Don’t think politicians haven’t figured this out about you. That’s why they can give us unsustainable corporate welfare boondoggles and call it climate policy.”

A CNN moderator Saturday urged viewers to vote in an online poll on whether the California disaster should be blamed on climate change or poor leadership. Notice the non sequitur: as if climate change is an excuse for not acting against fire risk.

By all means, let politicians proclaim a “climate crisis” or any other rhetorical flourish if it helps mobilize support for public actions that actually serve a useful purpose. But a prerevolutionary situation has been building in California for two decades, starting with the Third World blackouts in late 2000 not because of any shortage of power but because of large helpings of political cowardice.

A decision in 2019 authorized yet more Third World blackouts instead of reasonably shielding utilities from lawsuit risk over fires their power lines might be accused of contributing to. One result, predictably, has been a proliferation of backyard generators, which increase fire risk.

Californians are stuck adapting in the ways left open to them. Since 2017, half a million have fled Los Angeles County.

Two social technologies might help but the state has been intent on denying itself their advantages. One is a functioning insurance market. If you can’t afford the insurance, you can’t afford the house. Get ready, instead, for a torrent of federal and state money to help residents, some of them wealthy, rebuild in high-risk fire zones.

The other is a functioning market in water. Five gallons to produce a walnut probably isn’t tenable under any realistic system of water pricing. If water were properly valued, municipalities would also rapidly discover the logic of building aquifers to capture seasonal runoff. A thousand things would change if water were priced to flow to its most highly valued uses.

Here’s another concept: Climate change can exist and yet be an insignificant variable.

In Southern California’s Mediterranean climate, anytime 100-mile-an-hour winds start blowing embers toward densely packed housing developments, a conflagration is certain. The only answer then is to have the manpower and resources ready to put fires out as quickly as they start.

I’ve written repeatedly about climate and energy policies in the Western world being a colossal example of “sophisticated state failure,” in which attempts to address complex problems yield only a succession of boondoggles and economic crises. If California voters don’t wise up now, they never will.


Koonin: Reckless Claim of Climate Emergency

Transcript

Hubris is a Greek word that means dangerously overconfident. Based on my research, hubris fairly describes our current response to the issue of climate change.

Here’s what many people believe:

One: The planet is warming catastrophically because of certain human behaviors.
Two: Thanks to powerful computers we can project what the climate will be like
20, 40, or even 100 years from now.
Three: That if we eliminate just one behavior, the burning of fossil fuels,
we can prevent the climate from changing for as long we like.

Each of these presumptions—together, the basis of our hubris regarding the changing climate—is either untrue or so far off the mark as to be useless.

Yes, it’s true that the globe is warming, and that humans are exerting a warming influence upon it. But beyond that, to paraphrase a line from the classic movie The Princess Bride, “I do not think ‘The Science’ says what you think it says.”

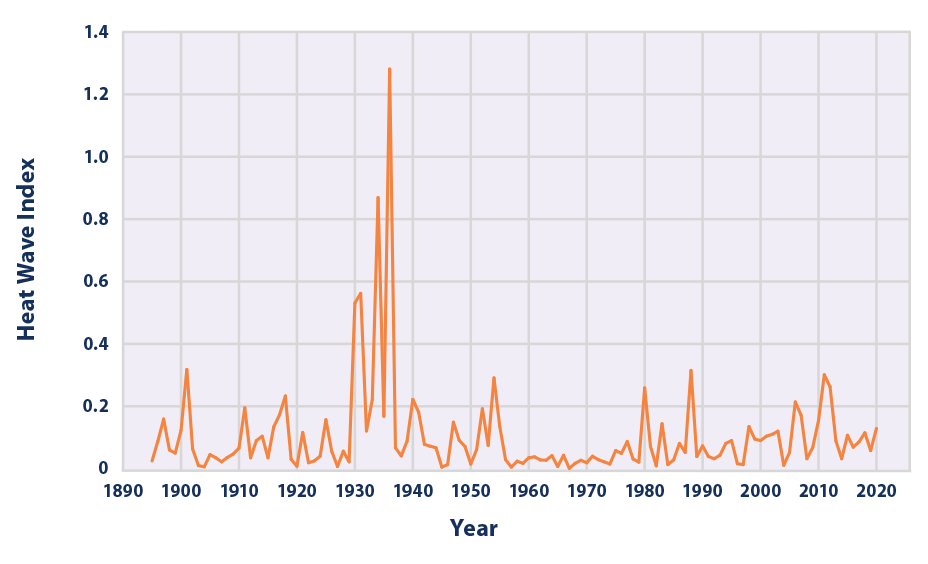
For example, government reports state clearly that heat waves in the US are now no more common than they were in 1900.

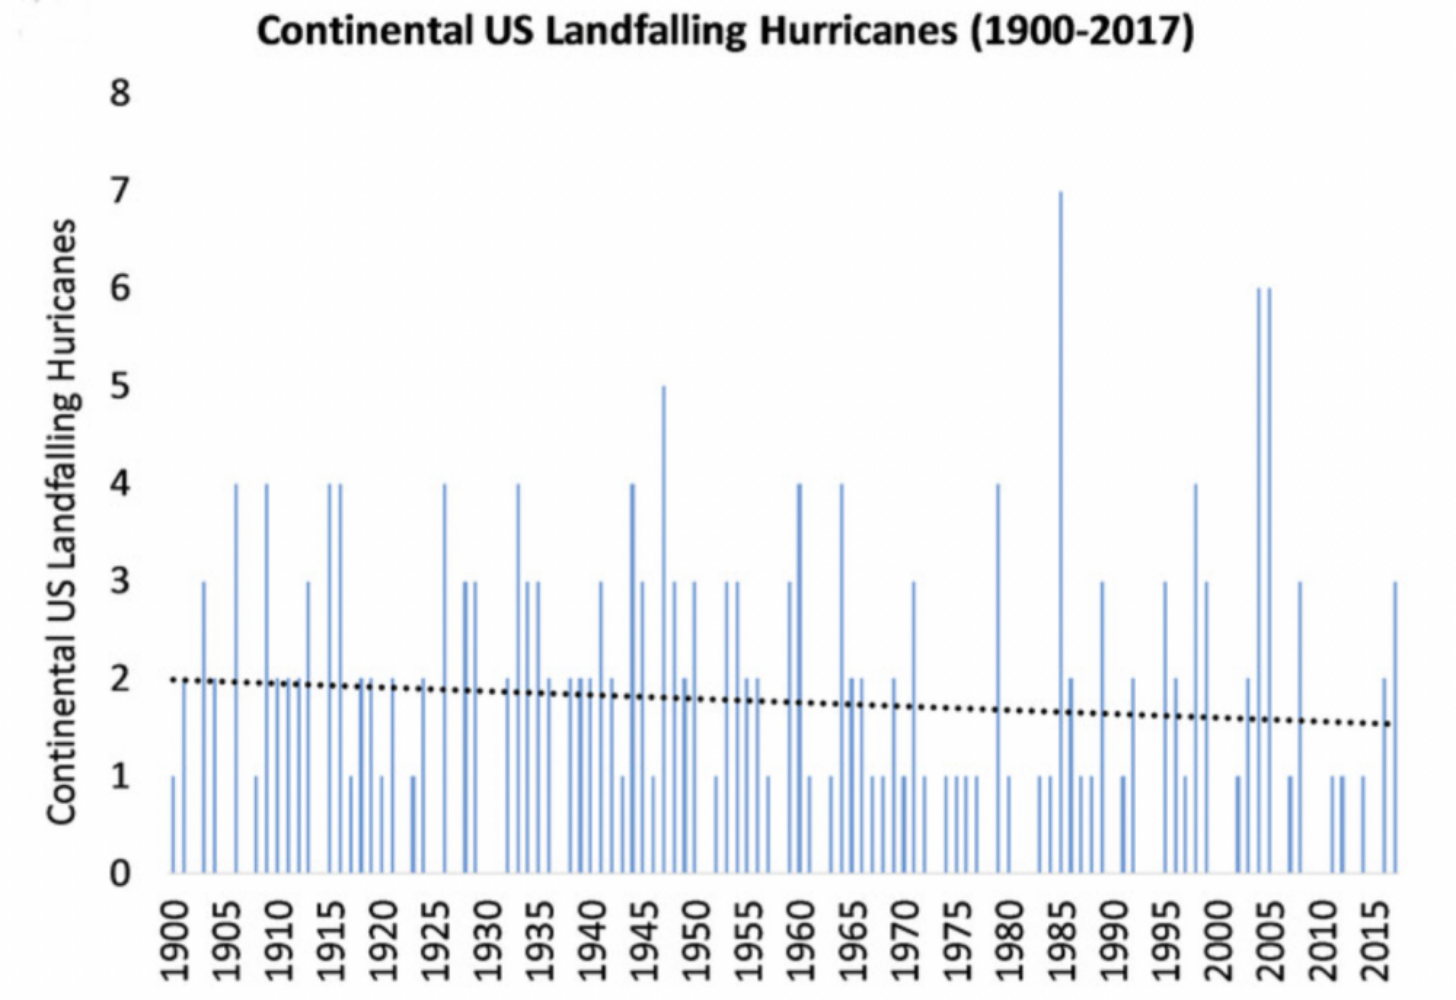
Hurricane activity is no different than it was a century ago.

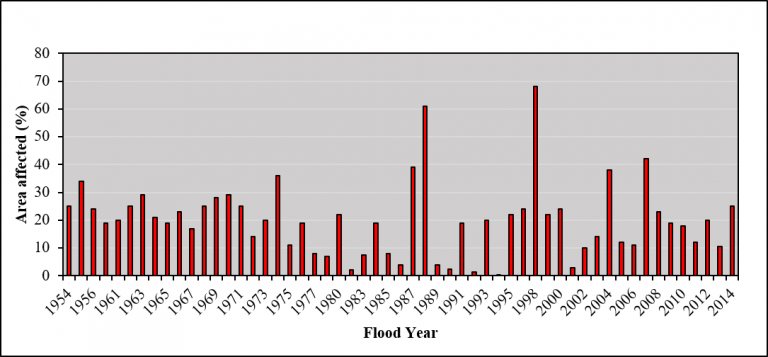
Floods have not increased across the globe over more than seventy years.

Source: Voice of International Affairs

Greenland’s ice sheet isn’t shrinking any more rapidly today than it was 80 years ago.

Why aren’t these reassuring facts better known?

Because the public gets its climate information almost exclusively from the media.

And from a media perspective, fear sells.

“Things aren’t that bad” doesn’t sell.

Very few people, and that includes journalists who report on climate news, read the actual science. I have. And what the data—the hard science—from the US government and UN Climate reports say is that… “things aren’t that bad.”

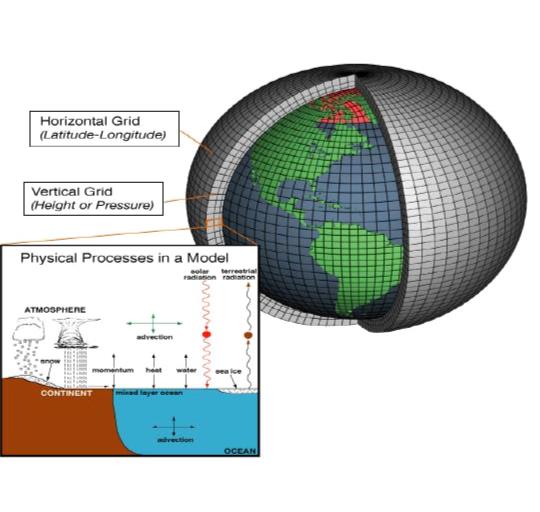
Nor does the public understand the questionable basis of all catastrophic climate change projections: computer modeling.

Projecting future climate is excruciatingly difficult. Yes, there are human influences, but the climate is complex. Anyone who says that climate models are “just physics” either doesn’t understand them or is being deliberately misleading. I should know: I wrote one of the first textbooks on computer modeling.

While modelers base their assumptions upon both fundamental physical laws and observations of the climate, there is still considerable judgment involved. And since different modelers will make different assumptions, results vary widely among different models.

Let’s just take one simple, but significant assumption modelers must make: the impact of clouds on the climate.

Natural fluctuations in the height and coverage of clouds have at least as much of an impact on the flows of sunlight and heat as do human influences. But how can we possibly know global cloud coverage say 10, let alone 50 years from now? Obviously, we can’t. But to create a climate model, we have to make assumptions. That’s a pretty shaky foundation on which to transform the world’s economy.

By the way, creating more accurate models isn’t getting any easier. In fact, the more we learn about the climate system, the more we realize how complex it is.

Rather than admit this complexity, the media, the politicians, and a good portion of the climate science community attribute every terrible storm, every flood, every major fire to “climate change.” Yes, we’ve always had these weather events in the past, the narrative goes, but somehow “climate change” is making everything “worse.”

Even if that were true, isn’t the relevant question, how much worse? Not to mention that “worse” is not exactly a scientific term.  And how would we make it better?  For the alarmists, that’s easy: we get rid of fossil fuels.

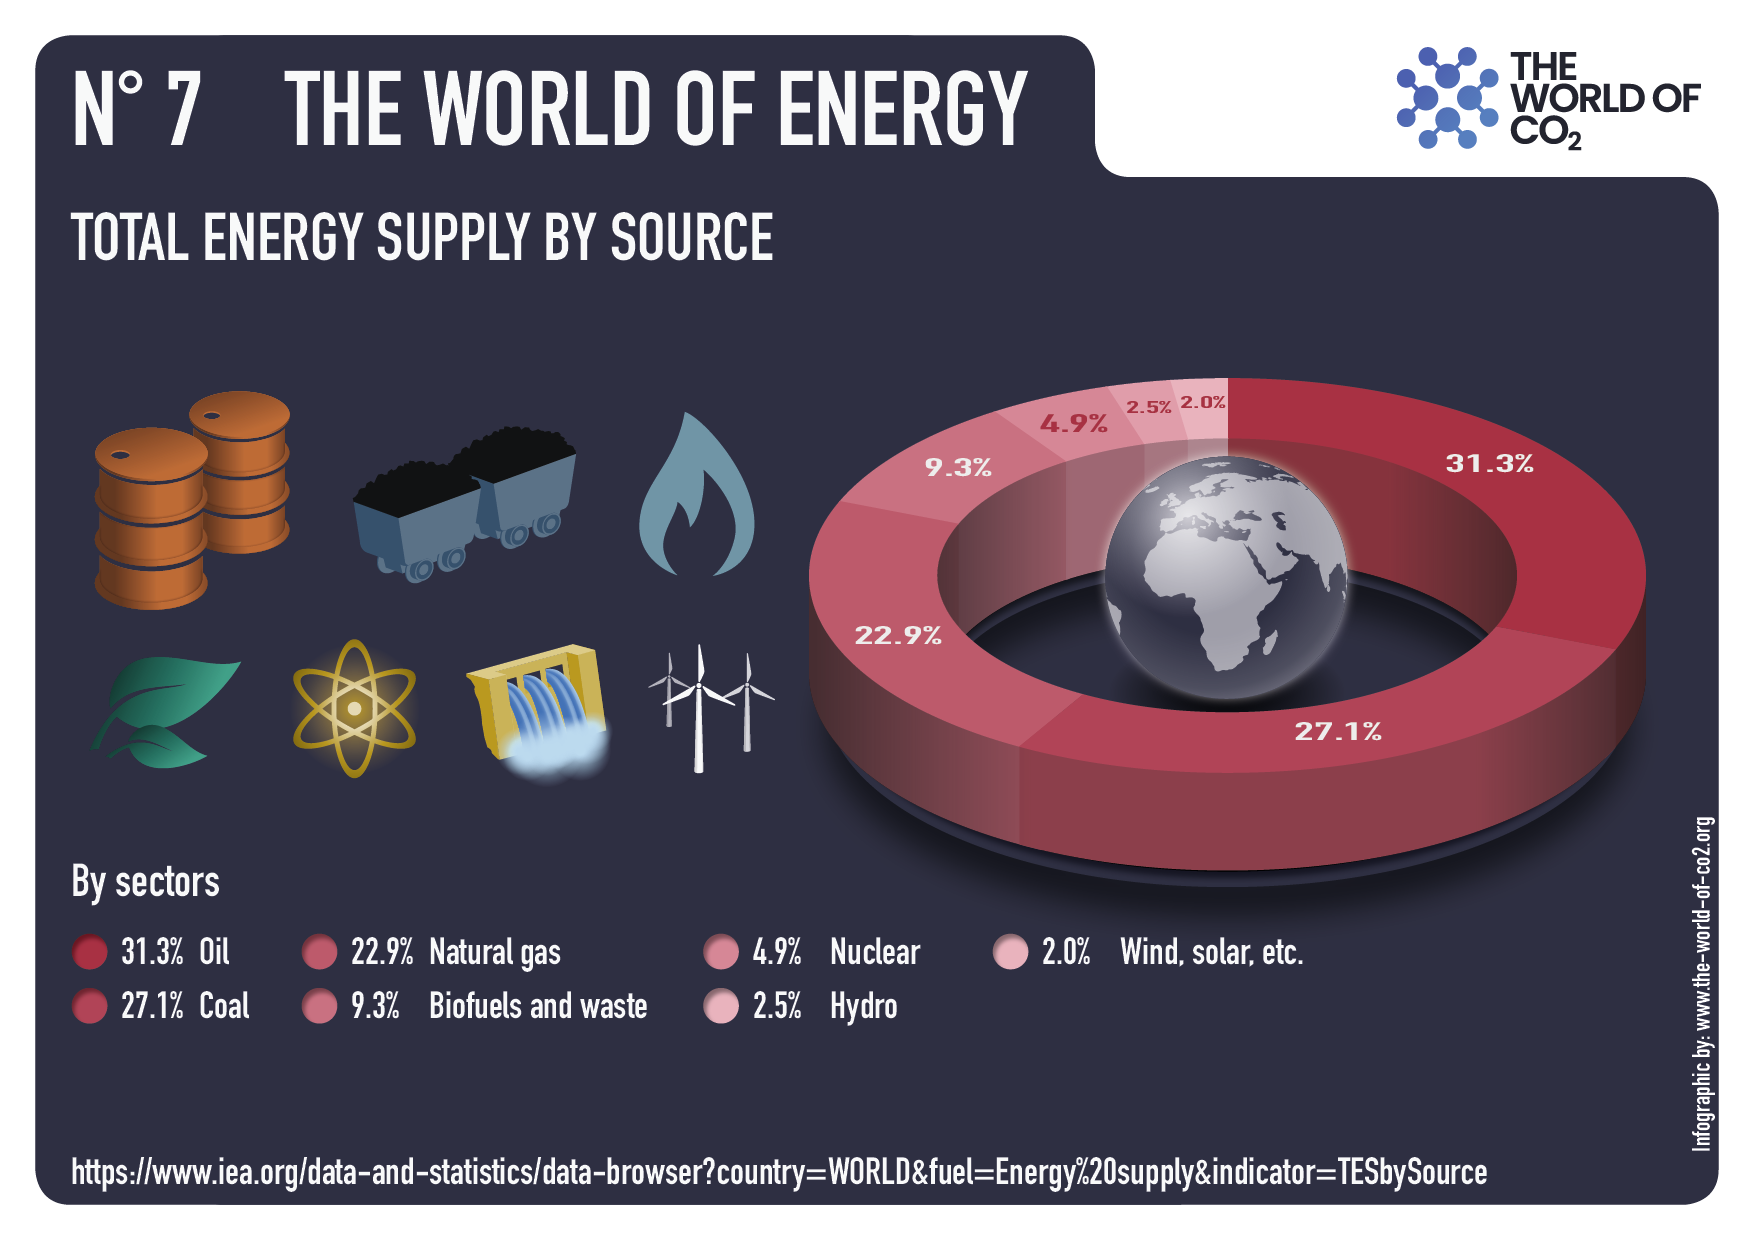
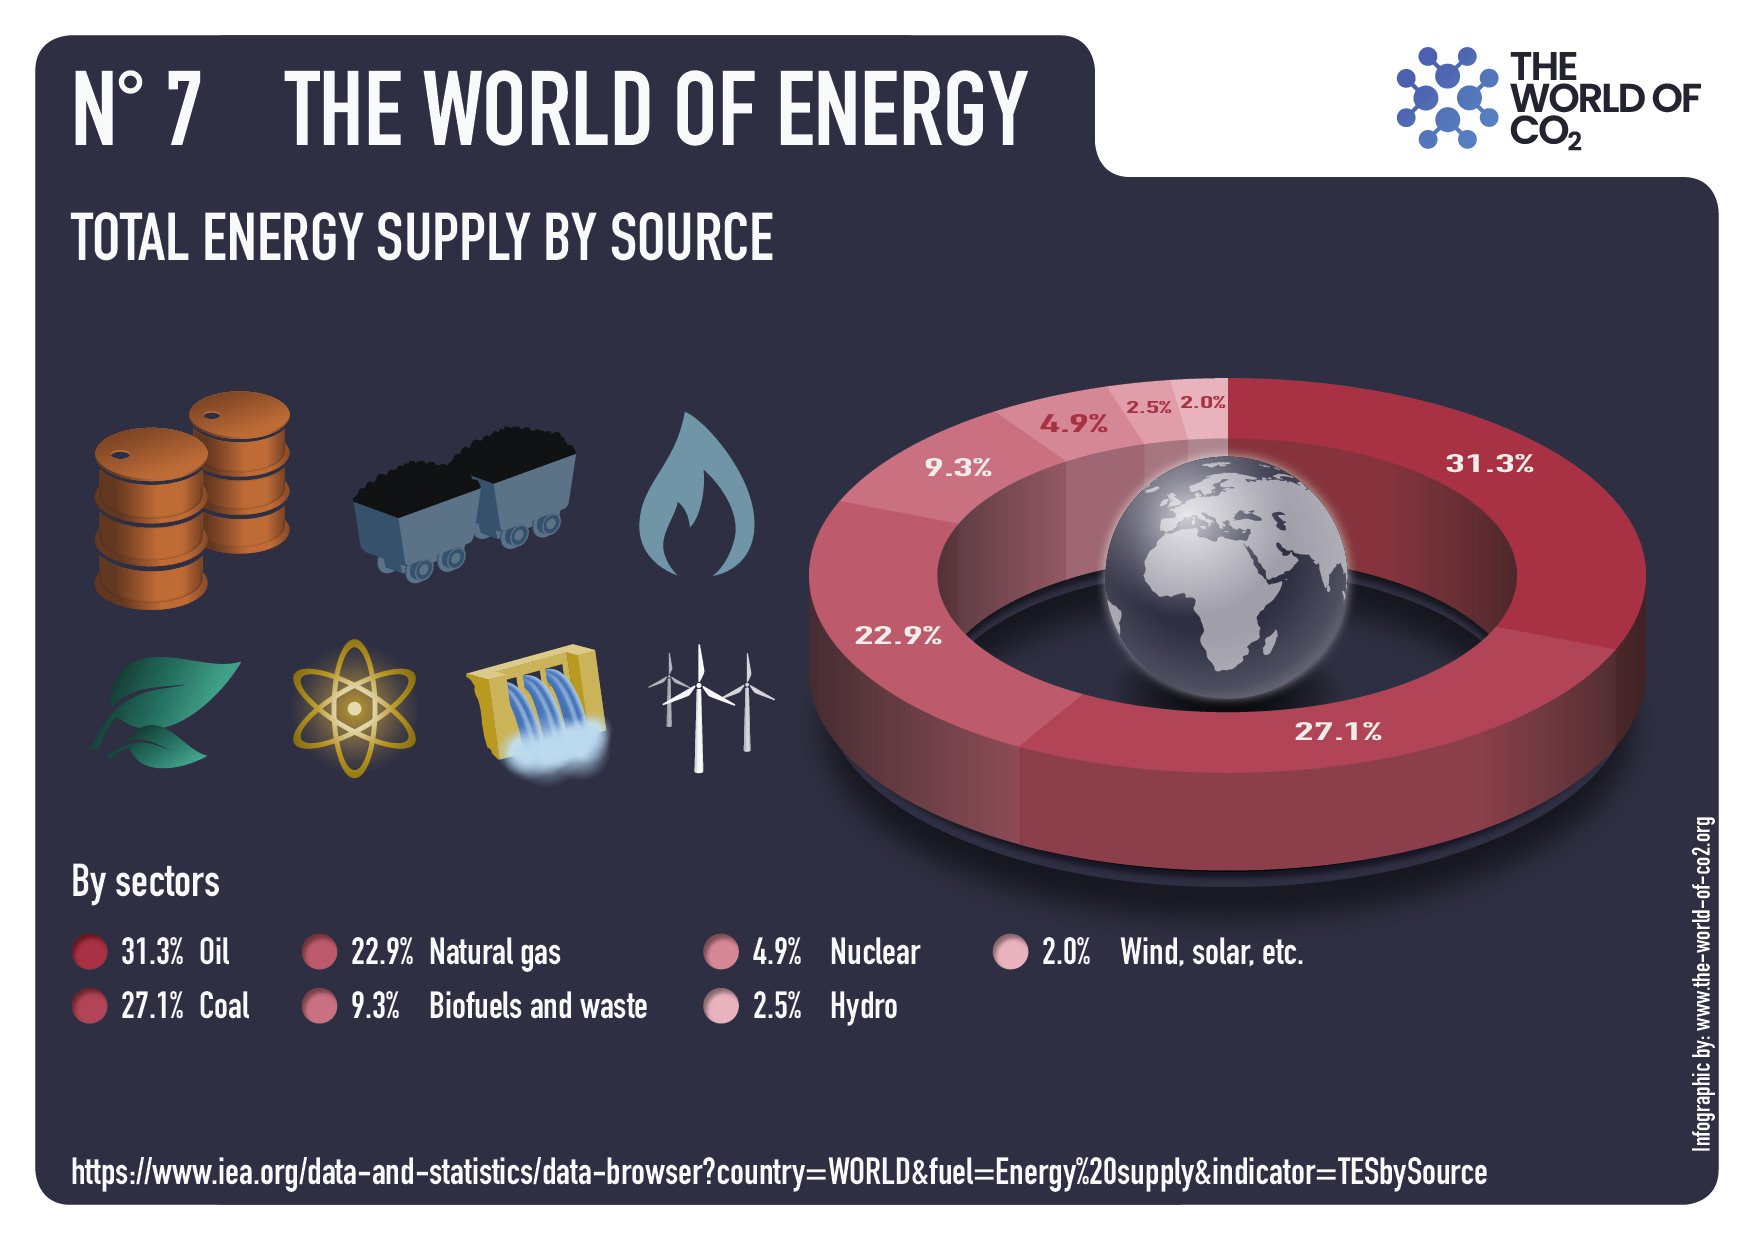
Not only is this impractical—we get over 80% of the world’s energy from fossil fuels—it’s not scientifically possible. That’s because CO2 doesn’t disappear from the atmosphere in a few days like, say, smog. It hangs around for a really long time.

About 60 percent of any CO2 that we emit today will remain in the atmosphere 20 years from now, between 30 and 55 percent will still be there after a century, and between 15 and 30 percent will remain after one thousand years.

In other words, it takes centuries for the excess carbon dioxide to vanish from the atmosphere. So, any partial reductions in CO2 emissions would only slow the increase in human influences—not prevent it, let alone reverse it.

CO2 is not a knob that we can just turn down to fix everything. We don’t have that ability. To think that we do is… hubris.

Hubris leads to bad decisions.  A little humility and
a little knowledge would lead to better ones.

I’m Steve Koonin, former Undersecretary for Science in the Obama Administration, and author of Unsettled: What Climate Science Tells Us, What It Doesn’t, and Why It Matters, for Prager University.

Addendum  Fossil Fuels and Greenhouse Gases (GHGs) Climate Science

Professors Lindzen, Happer and Koonin CO2 Coalition Paper April 2024

Table of Contents

I. THERE WILL BE DISASTROUS CONSEQUENCES FOR THE POOR, PEOPLE WORLDWIDE, FUTURE GENERATIONS AND THE WEST IF FOSSIL FUELS, CO2 AND OTHER GHG EMISSIONS ARE REDUCED TO “NET ZERO”

A. CO2 is Essential to Our Food, and Thus to Life on Earth
B. More CO2, Including CO2 from Fossil Fuels, Produces More Food.
C. More CO2 Increases Food in Drought-Stricken Areas.
D. Greenhouse Gases Prevent Us from Freezing to Death
E. Enormous Social Benefits of Fossil Fuels
F. “Net Zeroing” Fossil Fuels Will Cause Massive Human Starvation by Eliminating Nitrogen Fertilizer

II. THE IPCC IS GOVERNMENT CONTROLLED AND THUS ONLY ISSUES GOVERNMENT OPINIONS, NOT SCIENCE

III. SCIENCE DEMONSTRATES FOSSIL FUELS, CO2 AND OTHER GHGs WILL NOT CAUSE CATASTROPHIC GLOBAL WARMING AND EXTREME WEATHER

A. Reliable Science is Based on Validating Theoretical Predictions With Observations, Not Consensus, Peer Review, Government Opinion or Cherry-Picked or Falsified Data
B. The Models Predicting Catastrophic Warming and Extreme Weather Fail the Key Scientific Test: They Do Not Work, and Would Never Be Used in Science.
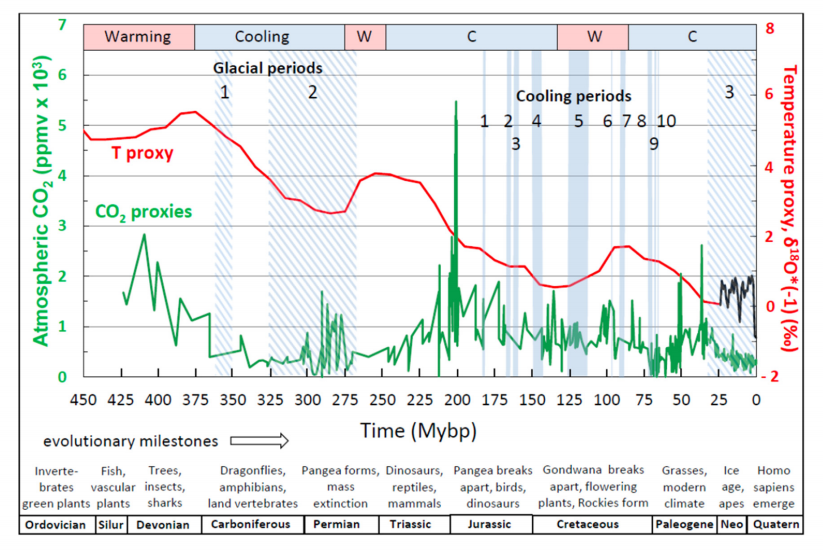
C. 600 Million Years of CO2 and Temperature Data Contradict the Theory That High Levels of CO2 Will Cause Catastrophic Global Warming.
D. Atmospheric CO2 Is Now “Heavily Saturated,” Which in Physics Means More CO2 Will Have Little Warming Effect.
E. The Theory Extreme Weather is Caused by Fossil Fuels, CO2 and Other GHGs is Contradicted by the Scientific Method and Thus is Scientifically Invalid


Good Reasons to Distrust Climatists

The most recent case of climatists’ bad behavior is the retraction of a peer-reviewed paper analyzing the properties of CO2 as an IR active gas, concluding that additional levels of atmospheric CO2 will have negligible effect on temperatures.  From the Daily Sceptic:

Another important paper taking issue with the ‘settled’ climate narrative has been cancelled following a report in the Daily Sceptic and subsequent reposts that went viral across social media. The paper discussed the atmospheric ‘saturation’ of greenhouse gases such as carbon dioxide and argued that higher levels will not cause temperatures to rise. The work was led by the widely-published Polish scientist Dr. Jan Kubicki and appeared on Elsevier’s ScienceDirect website in December 2023. The paper has been widely discussed on social media since April 2024 when the Daily Sceptic reported on the findings. Interest is growing in the saturation hypothesis not least because it provides a coherent explanation for why life and the biosphere grew and often thrived for 600 million years despite much higher atmospheric levels of greenhouse gases. Alas for control freaks, it also destroys the science backing for the Net Zero fantasy.

Below are some comments responding to a Quora question, text in italics with my bolds and added images:

What are some reasons why some people do not believe in climate change or global warming despite scientific evidence? Is there any additional information that could help us understand their perspective?

Answer from Mike Jonas,  M.A. in Mathematics, Oxford University, UK, 

Good scientists do not lie and cheat to protect their science, they are happy to discuss their evidence and their findings, and they always understand that everything needs to be replicable and verifiable.

When Climategate erupted on the scene, and the climate scientists behind the man-made global warming narrative were found to have lied and cheated, all honest scientists thought that would be the end of it. Instead, what happened was that those climate scientists closed ranks and carried on, supported by a massive amount of government (ie, the public’s) money. One of the first things they did was to deflect Climategate by saying the emails involved had been hacked so should be ignored, but some of the people involved confirmed that all of the emails really were genuine.

It has been about 15 years since Climategate, and study after study has shown virtually all of the components of the man-made global warming narrative to be incorrect, even that none of the computer models used by the IPCC are fit for purpose,

And yet they maintained their closed ranks,
and the government money kept pouring in.

Did you know that the IPCC does not do any research (please do check that, on their web page About – IPCC they state “The IPCC does not conduct its own research”). It is, as its name says, an inter-governmental organisation, and it is run by and for governments. They say lots of persuasive sciency things, but the simple fact is that they cherry-pick and corrupt the science to achieve their ends. Regrettably, almost all the scientific societies are on the gravy train too. This is part of what the highly respected physicist Professor Hal Lewis said in his resignation letter to the American Physical Society (APS):

It is of course, the global warming scam, with the (literally) trillions of dollars driving it, that has corrupted so many scientists, and has carried APS before it like a rogue wave. It is the greatest and most successful pseudoscientific fraud I have seen in my long life as a physicist. Anyone who has the faintest doubt that this is so should force himself to read the ClimateGate documents, which lay it bare.

I don’t believe that any real physicist, nay scientist, can read that stuff without revulsion. I would almost make that revulsion a definition of the word scientist.

So what has the APS, as an organization, done in the face of this challenge?
It has accepted the corruption as the norm, and gone along with it.

If you want to find out more about this “greatest and most successful pseudoscientific fraud”, the website Watts Up With That? is a good place to start (the fraudsters absolutely hate it), and it links to many other good websites. It has the full text of Hal Lewis’ resignation letter at:

Hal Lewis: My Resignation From The American Physical Society – an important moment in science history

Answer from Susannah Moyer

It’s curious that climate science is the rare scientific field where dissenting scientists, those with contrarian views, are unwelcome and even ostracized.

There are some well known climate scientists that have doubts about the role of CO2 and man made global warming as it pertains to global temperature. They have raised the issue that computer generated prediction models have been inaccurate in predicting temperature patterns because the modeling requires assumptions that have not been shown to be accurate.

Here is a contrarian view from climate scientists who have published climate research results in Nature, which is no small feat:

McNider and Christy are professors of atmospheric science at the University of Alabama in Huntsville and fellows of the American Meteorological Society. Mr. Christy was a member of the Intergovernmental Panel on Climate Change that shared the 2007 Nobel Peace Prize with former Vice President Al Gore.

It is not a known fact by how much the Earth’s atmosphere will warm in response to this added carbon dioxide. The warming numbers most commonly advanced are created by climate computer models built almost entirely by scientists who believe in catastrophic global warming. The rate of warming forecast by these models depends on many assumptions and engineering to replicate a complex world in tractable terms, such as how water vapor and clouds will react to the direct heat added by carbon dioxide or the rate of heat uptake, or absorption, by the oceans.

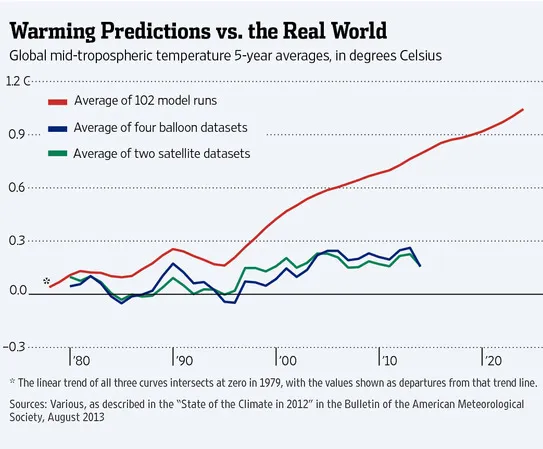
We might forgive these modelers if their forecasts had not been so consistently and spectacularly wrong. From the beginning of climate modeling in the 1980s, these forecasts have, on average, always overstated the degree to which the Earth is warming compared with what we see in the real climate.

For instance, in 1994 we published an article in the journal Nature showing that the actual global temperature trend was “one-quarter of the magnitude of climate model results.” As the nearby graph shows, the disparity between the predicted temperature increases and real-world evidence has only grown in the past 20 years.

“Consensus” science that ignores reality can have tragic consequences if cures are ignored or promising research is abandoned. The climate-change consensus is not endangering lives, but the way it imperils economic growth and warps government policy making has made the future considerably bleaker. The recent Obama administration announcement that it would not provide aid for fossil-fuel energy in developing countries, thereby consigning millions of people to energy poverty, is all too reminiscent of the Sick and Health Board denying fresh fruit to dying British sailors.

Another questioner, Dr. Koonin was undersecretary for science in the Energy Department during President Barack Obama’s first term and is currently director of the Center for Urban Science and Progress at New York University. His previous positions include professor of theoretical physics and provost at Caltech, as well as chief scientist of BP, where his work focused on renewable and low-carbon energy technologies.

But—here’s the catch—those questions are the hardest ones to answer. They challenge, in a fundamental way, what science can tell us about future climates.

Firstly, even though human influences could have serious consequences for the climate, they are physically small in relation to the climate system as a whole. For example, human additions to carbon dioxide in the atmosphere by the middle of the 21st century are expected to directly shift the atmosphere’s natural greenhouse effect by only 1% to 2%. Since the climate system is highly variable on its own, that smallness sets a very high bar for confidently projecting the consequences of human influences.

A second challenge to “knowing” future climate is today’s poor understanding of the oceans. The oceans, which change over decades and centuries, hold most of the climate’s heat and strongly influence the atmosphere. Unfortunately, precise, comprehensive observations of the oceans are available only for the past few decades; the reliable record is still far too short to adequately understand how the oceans will change and how that will affect climate.

A third fundamental challenge arises from feedbacks that can dramatically amplify or mute the climate’s response to human and natural influences. One important feedback, which is thought to approximately double the direct heating effect of carbon dioxide, involves water vapor, clouds and temperature.

Climate Science Is Not Settled

Another group questioning what some consider “settled science”:

  • Claude Allegre, former director of the Institute for the Study of the Earth, University of Paris;
  • J. Scott Armstrong, cofounder of the Journal of Forecasting and the International Journal of Forecasting;
  • Jan Breslow, head of the Laboratory of Biochemical Genetics and Metabolism, Rockefeller University;
  • Roger Cohen, fellow, American Physical Society;
  • Edward David, member, National Academy of Engineering and National Academy of Sciences;
  • William Happer, professor of physics, Princeton;
  • Michael Kelly, professor of technology, University of Cambridge, U.K.;
  • William Kininmonth, former head of climate research at the Australian Bureau of Meteorology;
  • Richard Lindzen, professor of atmospheric sciences, MIT;
  • James McGrath, professor of chemistry, Virginia Technical University;
  • Rodney Nichols, former president and CEO of the New York Academy of Sciences;
  • Burt Rutan, aerospace engineer, designer of Voyager and SpaceShipOne;
  • Harrison H. Schmitt, Apollo 17 astronaut and former U.S. senator;
  • Nir Shaviv, professor of astrophysics, Hebrew University, Jerusalem;
  • Henk Tennekes, former director, Royal Dutch Meteorological Service;
  • Antonio Zichichi, president of the World Federation of Scientists, Geneva.

Although the number of publicly dissenting scientists is growing, many young scientists furtively say that while they also have serious doubts about the global-warming message, they are afraid to speak up for fear of not being promoted—or worse. They have good reason to worry. In 2003, Dr. Chris de Freitas, the editor of the journal Climate Research, dared to publish a peer-reviewed article with the politically incorrect (but factually correct) conclusion that the recent warming is not unusual in the context of climate changes over the past thousand years. The international warming establishment quickly mounted a determined campaign to have Dr. de Freitas removed from his editorial job and fired from his university position. Fortunately, Dr. de Freitas was able to keep his university job.

This is not the way science is supposed to work, but we have seen it before—for example, in the frightening period when Trofim Lysenko hijacked biology in the Soviet Union. Soviet biologists who revealed that they believed in genes, which Lysenko maintained were a bourgeois fiction, were fired from their jobs. Many were sent to the gulag and some were condemned to death.

Why is there so much passion about global warming, and why has the issue become so vexing that the American Physical Society (APS), from which Dr. Giaever resigned a few months ago, refused the seemingly reasonable request by many of its members to remove the word “incontrovertible” from its description of a scientific issue?

There are several reasons, but a good place to start is the old question
“cui bono?” Or the modern update, “Follow the money.”


Happer: Cloud Radiation Matters, CO2 Not So Much (2025)

This month van Wijngaarden and Happer published a new paper Radiation Transport in Clouds.

Last year William Happer spoke on Radiation Transfer in Clouds at the EIKE conference, and the video is above.  For those preferring to read, below is a transcript from the closed captions along with some key exhibits.  I left out the most technical section in the latter part of the presentation. Text in italics with my bolds.

William Happer: Radiation Transfer in Clouds

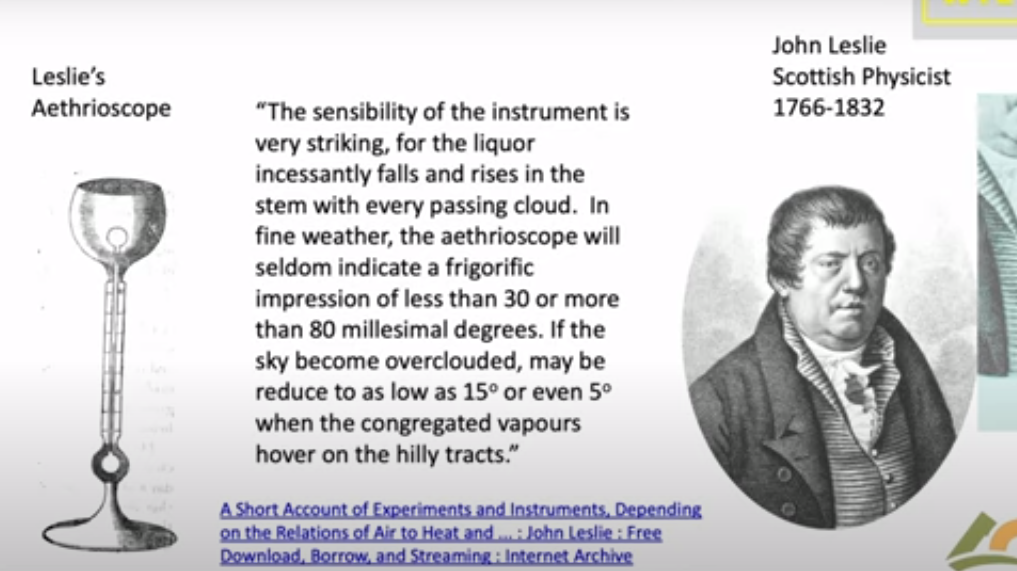
People have been looking at Clouds for a very long time in in a quantitative way. This is one of the first quantitative studies done about 1800. And this is John Leslie,  a Scottish physicist who built this gadget. He called it an Aethrioscope, but basically it was designed to figure out how effective the sky was in causing Frost. If you live in Scotland you worry about Frost. So it consisted of two glass bulbs with a very thin capillary attachment between them. And there was a little column of alcohol here.

The bulbs were full of air, and so if one bulb got a little bit warmer it would force the alcohol up through the capillary. If this one got colder it would suck the alcohol up. So he set this device out under the clear sky. And he described that the sensibility of the instrument is very striking. For the liquor incessantly falls and rises in the stem with every passing cloud. in fine weather the aethrioscope will seldom indicate a frigorific impression of less than 30 or more than 80 millesimal degrees. He’s talking about how high this column of alcohol would go up and down if the sky became overclouded. it may be reduced to as low as 15 refers to how much the sky cools or even five degrees when the congregated vapours hover over the hilly tracks. We don’t speak English that way anymore but I I love it.

The point was that even in 1800 Leslie and his colleagues knew very well that clouds have an enormous effect on the cooling of the earth. And of course anyone who has a garden knows that if you have a clear calm night you’re likely to get Frost and lose your crops. So this was a quantitative study of that.

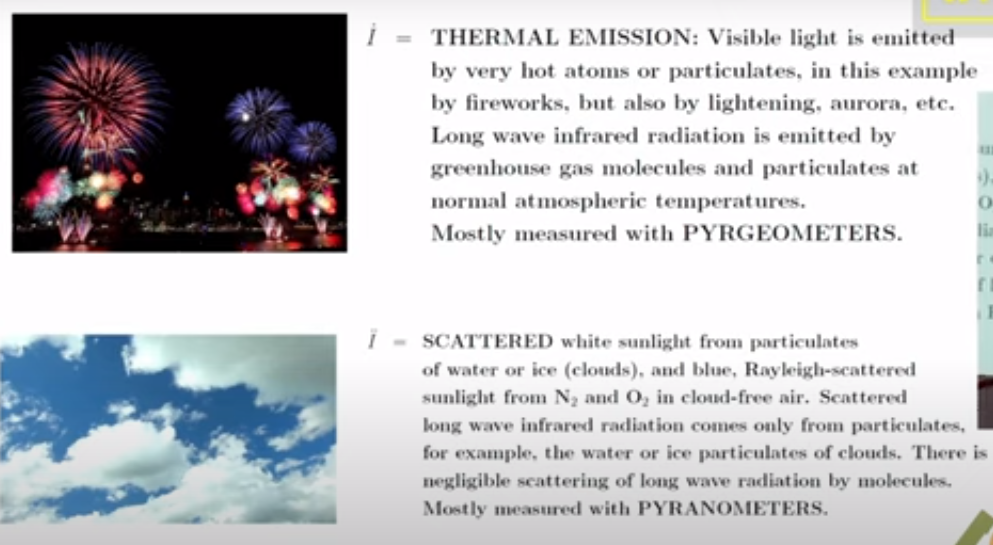
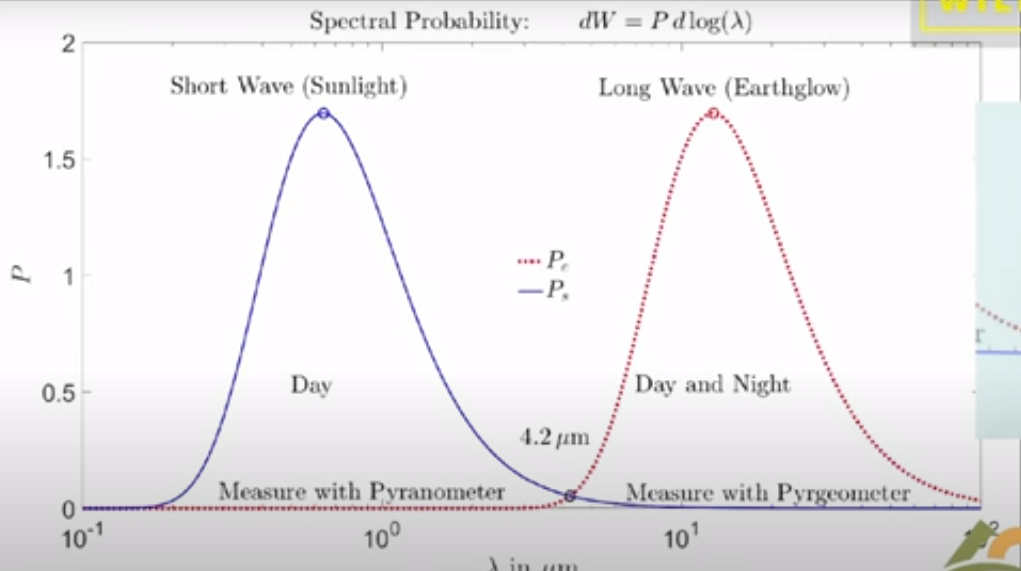
Now it’s important to remember that if you go out today the atmosphere is full of two types of radiation. There’s sunlight which you can see and then there is the thermal radiation that’s generated by greenhouse gases, by clouds and by the surface of the Earth. You can’t see thermal radiation but you you can feel it if it’s intense enough by its warming effect. And these curves practically don’t overlap so we’re really dealing with two completely different types of radiation.

There’s sunlight which scatters very nicely and off of not only clouds but molecules; it’s the blue sky the Rayleigh scattering. Then there’s the thermal radiation which actually doesn’t scatter at all on molecules so greenhouse gases are very good at absorbing thermal radiation but they don’t scatter it. But clouds scatter thermal radiation and plotted here is the probability that you will find Photon of sunlight between you know log of its wavelength and the log of in this interval of the wavelength scale.

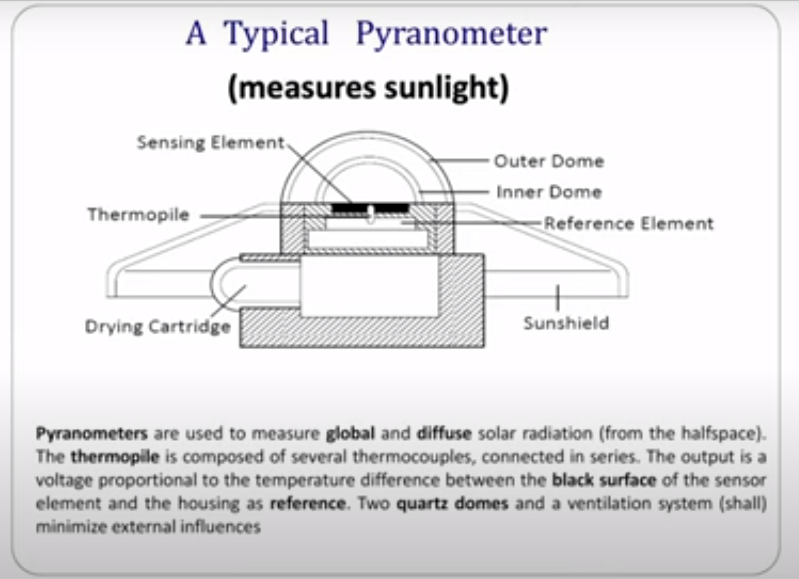
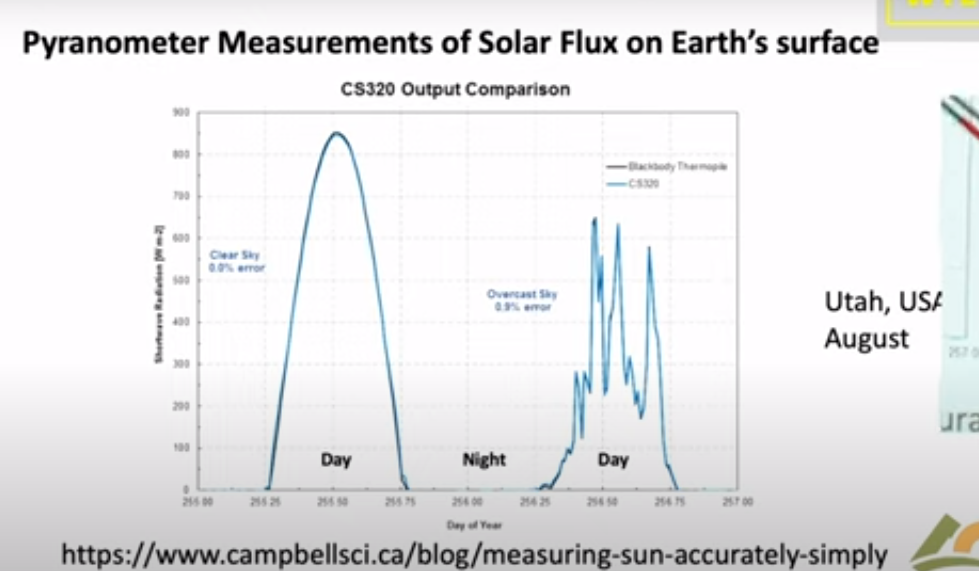
Since Leslie’s day two types of instruments have been developed to do what he did more precisely. One of them is called a pyranometer and this is designed to measure sunlight coming down onto the Earth on a day like this. So you put this instrument out there and it would read the flux of sunlight coming down. It’s designed to see sunlight coming in every direction so it doesn’t matter which angle the sun is shining; it’s uh calibrated to see them all.

Let me show you a measurement by a pyranometer. This is a actually a curve from a sales brochure of a company that will sell you one of these devices. It’s comparing two types of detectors and as you can see they’re very good you can hardly tell the difference. The point is that if you look on a clear day with no clouds you see sunlight beginning to increase at dawn it peaks at noon and it goes down to zero and there’s no sunlight at night. So half of the day over most of the Earth there’s no sunlight in the in the atmosphere.

Here’s a day with clouds, it’s just a few days later shown by days of the year going across. You can see every time a cloud goes by the intensity hitting the ground goes down. With a little clear sky it goes up, then down up and so on. On average at this particular day you get a lot less sunlight than you did on the clear day.

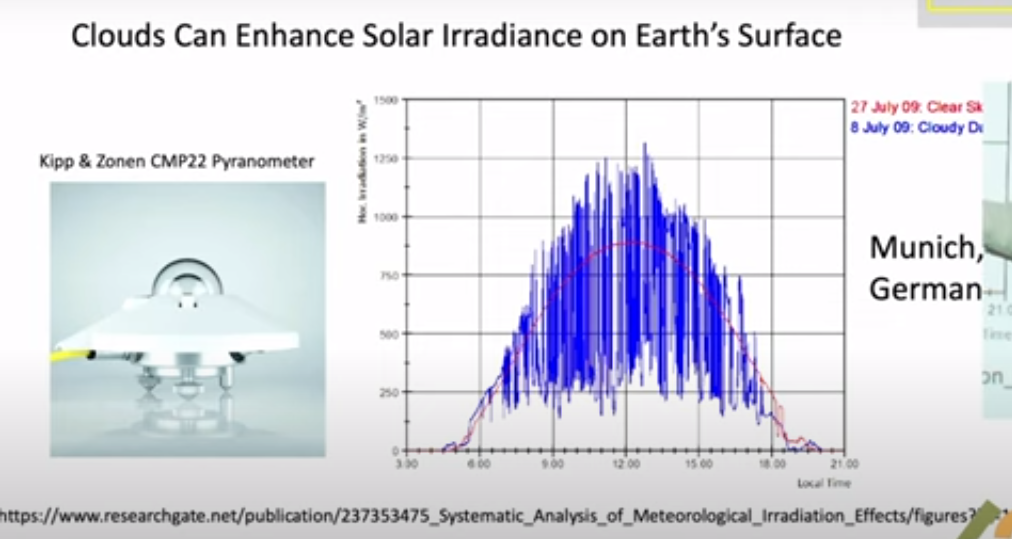
But you know nature is surprising. Einstein had this wonderful quote: God is subtle but he’s not malicious. He meant that nature does all of sorts of things you don’t expect, and so let me show you what happens on a partly cloudy day. Here so this is data taken near Munich. The blue curve is the measurement and the red curve is is the intensity on the ground if there were no clouds. This is a partly cloudy day and you can see there are brief periods when the sunlight is much brighter on the detector on a cloudy day than it is on the clear day. And that’s because coming through clouds you get focusing from the edges of the cloud pointing down toward your detector. That means somewhere else there’s less radiation reaching the ground. But this is rather surprising to most people. I was very surprised to learn about it but it just shows that the actual details of climate are a lot more subtle than you might think.

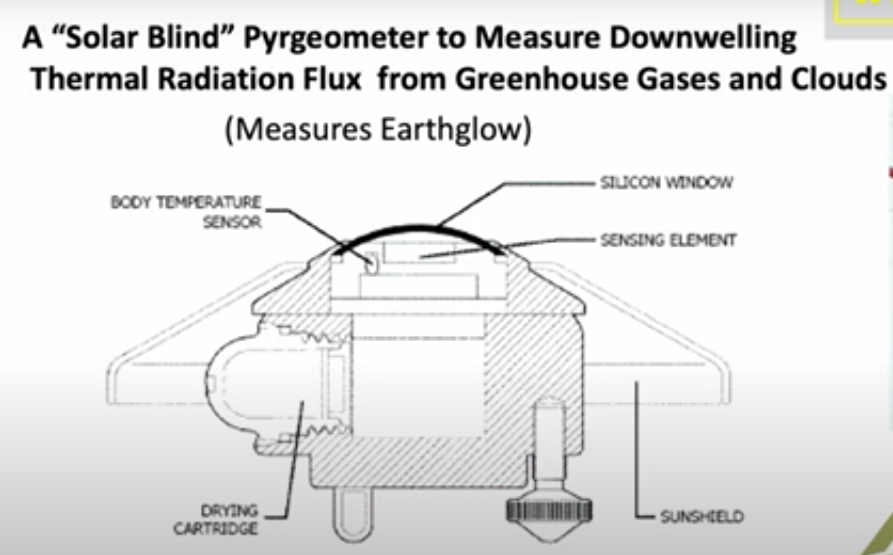
We know that visible light only happens during the daytime and stops at night. There’s a second type of important radiation which is the thermal radiation which is measured by a similar device. You have a silicon window that passes infrared, which is below the band gap of silicon, so it passes through it as though transparent. Then there’s some interference filters here to give you further discrimination against sunlight. So sunlight practically doesn’t go through this at all, so they call it solar solar blind since it doesn’t see the Sun.

But it sees thermal radiation very clearly with a big difference between this device and the sunlight sensing device I showed you. Because actually most of the time this is radiating up not down. Out in the open air this detector normally gets colder than the body of the instrument. And so it’s carefully calibrated for you to compare the balance of down coming radiation with the upcoming radiation. Upcoming is normally greater than down coming.

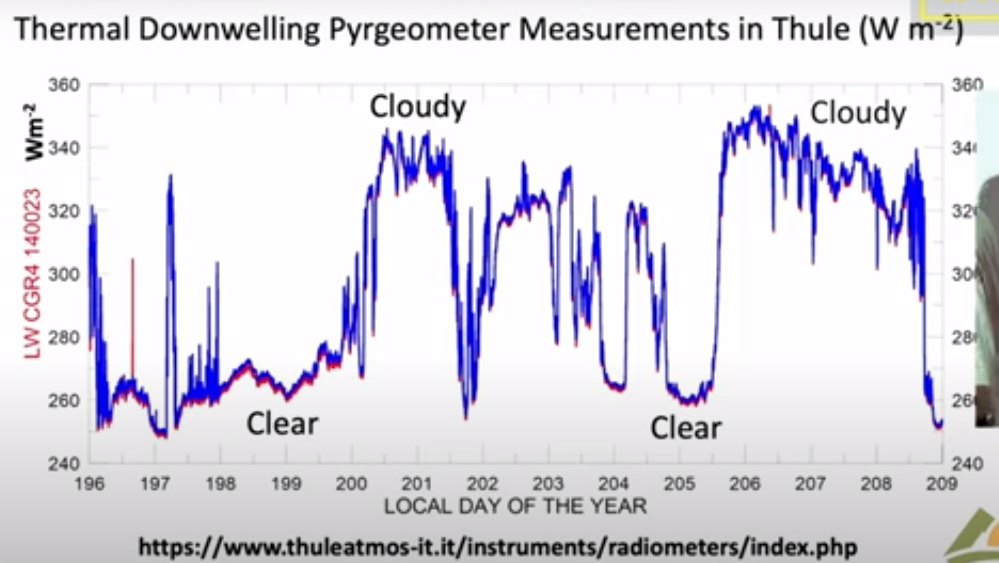
I’ll show you some measurements of the downwelling flux here; these are actually in Greenland in Thule and these are are watts per square meter on the vertical axis here. The first thing to notice is that the radiation continues day and night you can you if you look at the output of the pyrgeometer you can’t tell whether it’s day or night because the atmosphere is just as bright at night as it is during the day. However, the big difference is clouds: on a cloudy day you get a lot more downwelling radiation than you do on a clear day. Here’s a a near a full day of clear weather there’s another several days of clear weather. Then suddenly it gets cloudy. Radiation rises because the bottoms of the clouds are relatively warm at least compared to the clear sky. I think if you put the numbers In, this cloud bottom is around 5° Centigrade so it was fairly low Cloud. it was summertime in Greenland and this compares to about minus 5° for the clear sky.

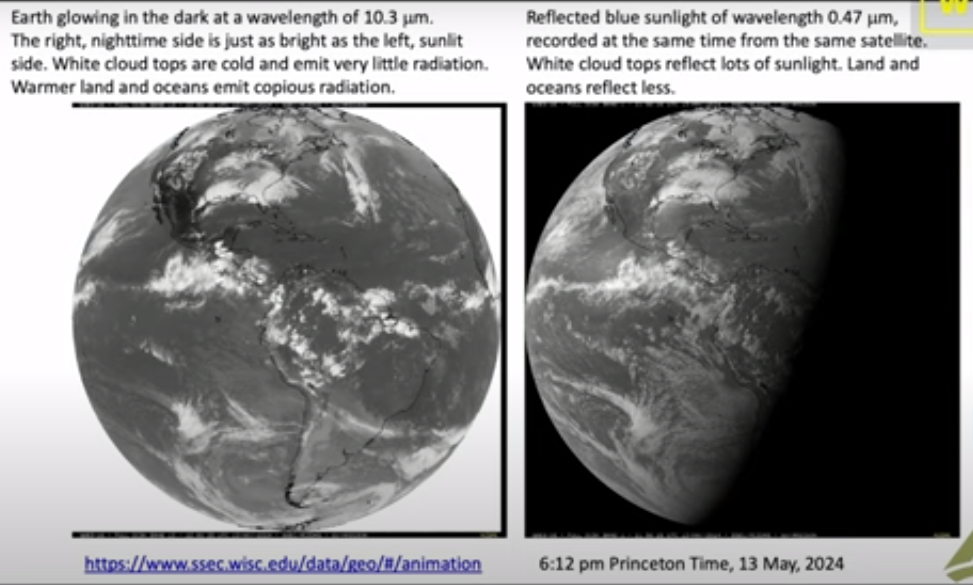
So there’s a lot of data out there and there really is downwelling radiation there no no question about that you measure it routinely. And now you can do the same thing looking down from satellites so this is a picture that I downloaded a few weeks ago to get ready for this talk from Princeton and it was from Princeton at 6 PM so it was already dark in Europe. So this is a picture of the Earth from a geosynchronous satellite that’s parked over Ecuador. You are looking down on the Western Hemisphere and this is a filtered image of the Earth in Blue Light at 47 micrometers. So it’s a nice blue color not so different from the sky and it’s dark where the sun has set. There’s still a fair amount of sunlight over the United States and the further west.

Here is exactly the same time and from the same satellite the infrared radiation coming up at 10.3 which is right in the middle of the infrared window where there’s not much Greenhouse gas absorption; there’s a little bit from water vapor but very little, trivial from CO2.

As you can see, you can’t tell which side is night and which side is day. So even though the sun has set over here it is still glowing nice and bright. There’s sort of a pesky difference here because what you’re looking at here is reflected sunlight over the intertropical Convergence Zone. There are lots of high clouds that have been pushed up by the convection in the tropics and uh so this means more visible light here. You’re looking at emission of the cloud top so this is less thermal light so white here means less light, white there means more light so you have to calibrate your thinking. to

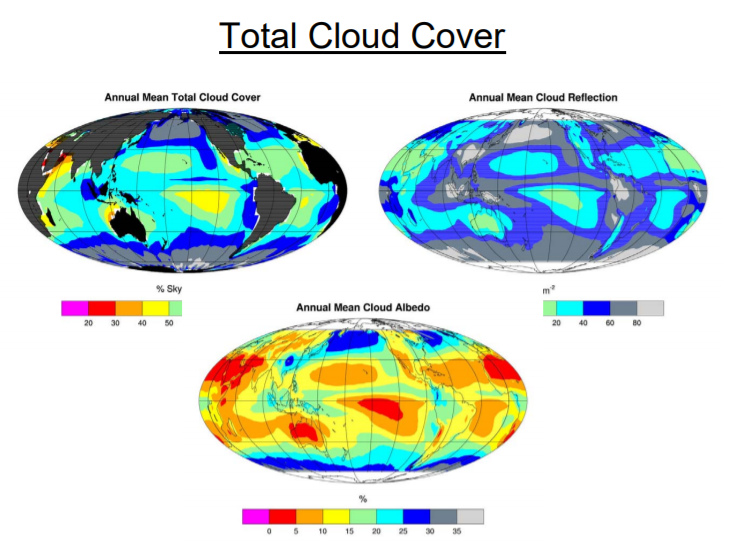
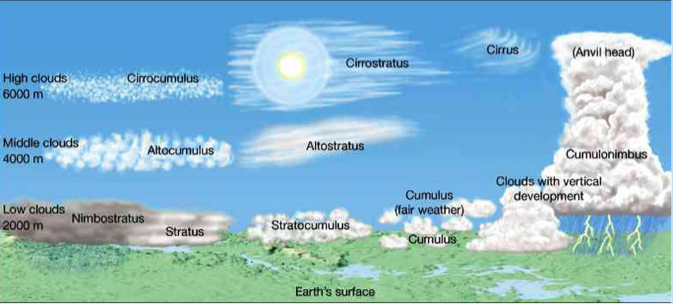
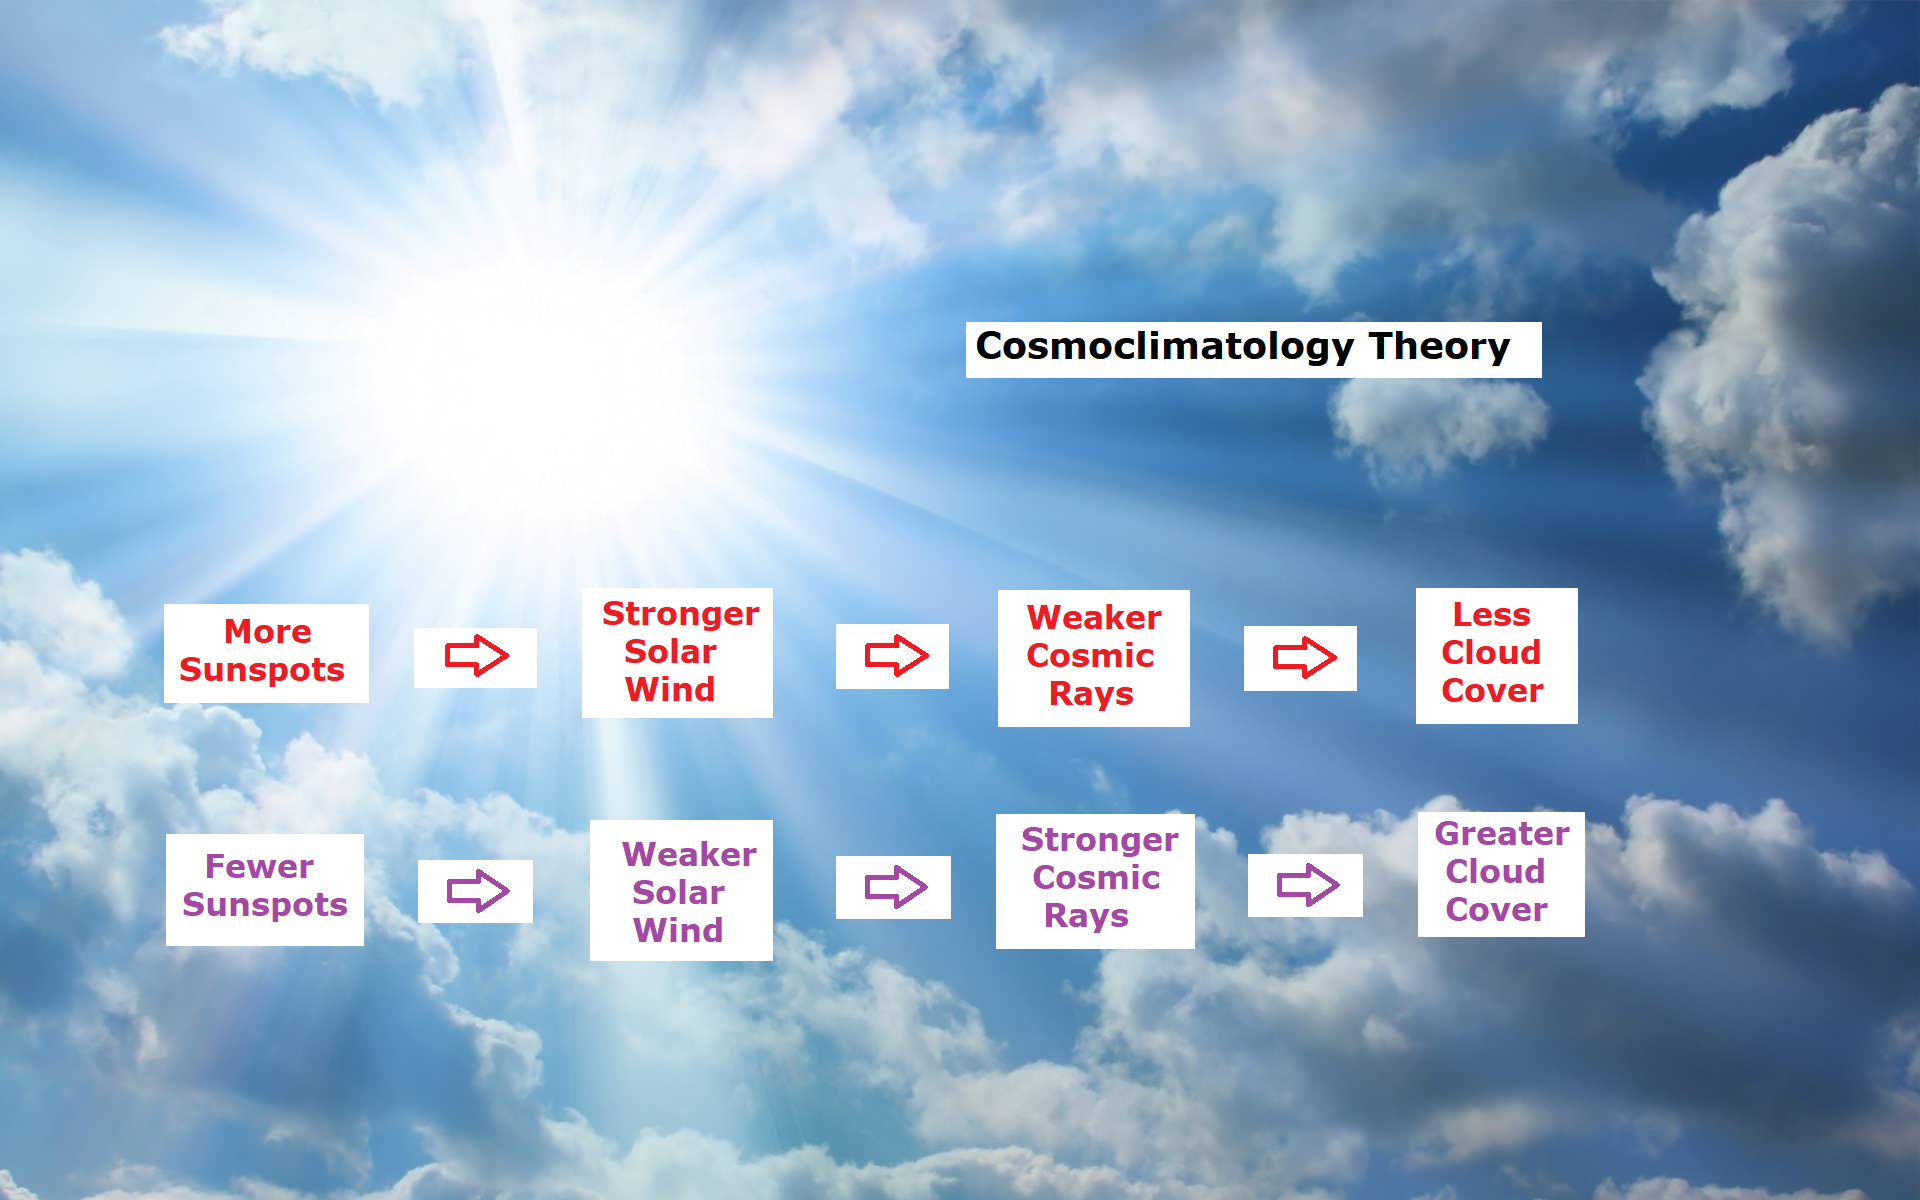
But the Striking thing about all of this: if you can see the Earth is covered with clouds, you have to look hard to find a a clear spot of the earth. Roughly half of the earth maybe is clear at any given time but most of it’s covered with clouds. So if anything governs the climate it is clouds and and so that’s one of the reasons I admire so much the work that Svensmark and Nir Shaviv have done. Because they’re focusing on the most important mechanism of the earth: it’s not Greenhouse Gases, it’s Clouds. You can see that here.

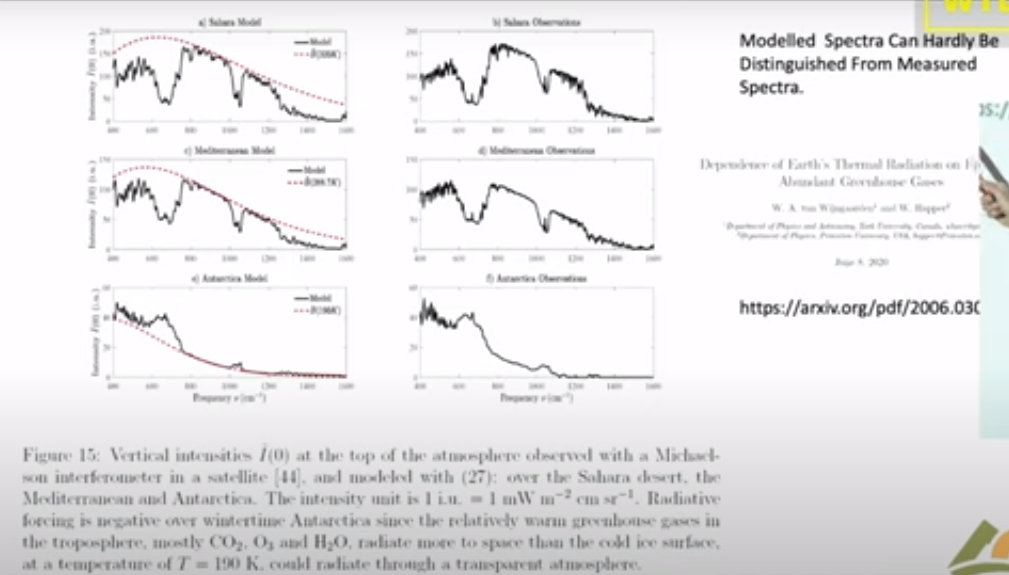
Now this is a single frequency let me show you what happens if you look down from a satellite and do look at the Spectrum. This is the spectrum of light coming up over the Sahara Desert measured from a satellite. And so here is the infrared window; there’s the 10.3 microns I mentioned in the previous slide it’s it’s a clear region. So radiation in this region can get up from the surface of the Sahara right up to outer space.

Notice that the units on these scales are very different; over the Sahara the top unit is 200, 150 over the Mediterranean and it’s only 60 over the South Pole. But at least the Mediterranean and the Sahara are roughly similar so the right side here these three curves on the right are observations from satellites and the three curves on the left are are calculations modeling that we’ve done. The point here is that you can hardly tell the difference between a model calculation and observed radiation.

So it’s really straightforward to calculate radiation transfer. If someone quotes you a number in watts per square centimeter you should take it seriously; that probably a good number. If they tell you a temperature you don’t know what to make about it. Because there’s a big step between going from watts per square centimeter to a temperature change. All the mischief in the whole climate business is going from watts per square centimeter to to Centigrade or Kelvin.

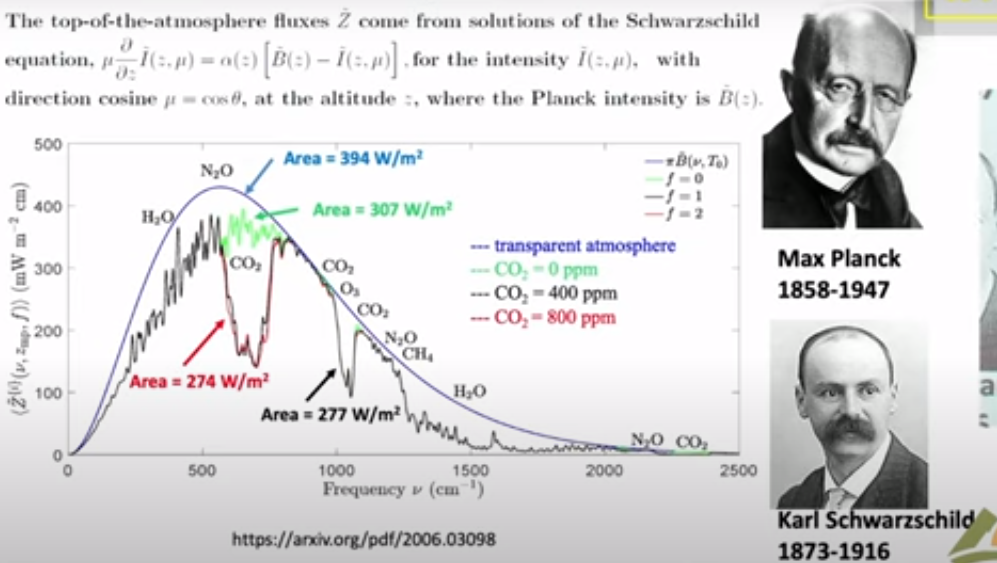
Now I will say just a few words about clear sky because that is the simplest. Then we’ll get on to clouds, the topic of this talk. This is a calculation with the same codes that I showed you in the previous slide which as you saw work very well. It’s worth spending a little time because this is the famous Planck curve that was the birth of quantum mechanics. There is Max Planck who figured out what the formula for that curve is and why it is that way. This is what the Earth would radiate at 15° Centigrade if there were no greenhouse gases. You would get this beautiful smooth curve the Planck curve. If you actually look at the Earth from the satellites you get a raggedy jaggedy black curve. We like to call that the Schwarzchild curve because Carl Schwarzchild was the person who showed how to do that calculation. Tragically he died during World War I, a Big Big loss to science.

There are two colored curves that I want to draw your attention. The green curve is is what Earth would radiate to space if you took away all the CO2 so it only differs from the black curve you know in the CO2 band here this is the bending band of CO2 which is the main greenhouse effect of CO2. There’s a little additional effect here which is the asymmetric stretch but it it doesn’t contribute very much. Then here is a red curve and that’s what happens if you double CO2.

So notice the huge asymmetry. If taking all 400 parts per million of CO2 away from the atmosphere causes this enormous change 30 watts per square meter, the difference between this green 307 and and the black 277, that’s 30 watts per square meter. But if you double CO2 you practically don’t make any change. This is the famous saturation of CO2. At the levels we have now doubling CO2, a 100% Increase of CO2 only changes the radiation to space by 3 watts per square meter. The difference between 274 for the red curve and 277 for the curve for today. So it’s a tiny amount: for 100% increase in CO2 a 1% decrease of radiation to space.

That allows you to estimate the feedback-free climate sensitivity in your head. I’ll talk you through the feedback-free climate free sensitivity. So doubling CO2 is a 1% decrease of radiation to space. If that happens then the Earth will start to warm up. But it will radiate as the fourth power of the temperature. So temperature starts to rise but if you’ve got a fourth power, the temperature only has to rise by one-quarter of a percent absolute temperature. So a 1% forcing in watts per square centimeter is a one-quarter percent of temperature in Kelvin. Since the ambient Kelvin temperature is about 300 Kelvin (actually a little less) a quarter of that is 75 Kelvin. So the feedback free equilibrium climate sensitivity is less than 1 Degree. It’s 0.75 Centigrade. It’s a number you can do in your head.

So when you hear about 3 centigrade instead of .75 C that’s a factor of four, all of which is positive feedback. So how is there really that much positive feedback? Because most feedbacks in nature are negative. The famous Le Chatelier principle which says that if you perturb a system it reacts in a way to to dampen the perturbation not increase it. There are a few positive feedback systems that we’re familiar with for example High explosives have positive feedback. So if the earth’s climate were like other positive feedback systems, all of them are highly explosive, it would have exploded a long time ago. But the climate has never done that, so the empirical observational evidence from geology is that the climate is like any other feedback system it’s probably negative Okay so I leave that thought with you and and let me stress again:

This is clear skies no clouds; if you add clouds all this does is
suppress the effects of changes of the greenhouse gas.

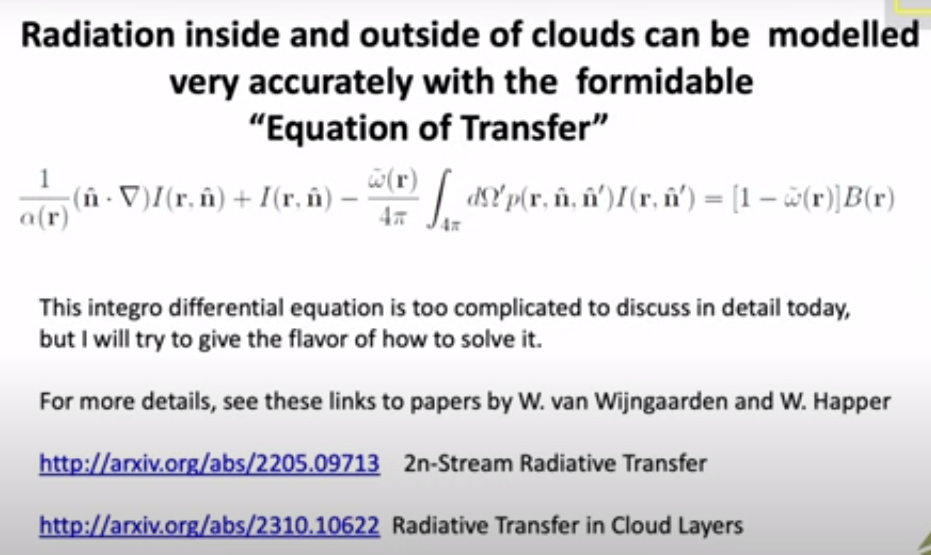
So now let’s talk about clouds and the theory of clouds, since we’ve already seen clouds are very important. Here is the formidable equation of transfer which has been around since Schwarzchild’s day. So some of the symbols here relate to the intensity, another represents scattering. If you have a thermal radiation on a greenhouse gas where it comes in and immediately is absorbed, there’s no scattering at all. If you hit a cloud particle it will scatter this way or that way, or some maybe even backwards.

So all of that’s described by this integral so you’ve got incoming light at One Direction and you’ve got outgoing light at a second Direction. And then at the same time you’ve got thermal radiation so the warm particles of the cloud are are emitting radiation creating photons which are coming out and and increasing the Earth glow the and this is represented by two parameters. Even a single cloud particle has an albedo, this is is the fraction of radiation that hits the cloud that is scattered as opposed to absorbed and being converted to heat. It’s a very important parameter for visible light and white clouds, typically 99% of the encounters are scattered. But for thermal radiation it’s much less. So water scatters thermal radiation only half as efficiently as shorter wavelengths.

The big problem is that in spite of all the billions of dollars that we have spent, these things which should be known and and would have been known if there hadn’t been this crazy fixation on carbon dioxide and greenhouse gases. And so we’ve neglected working on these areas that are really important as opposed to the trivial effects of greenhouse gases. Attenuation in a cloud is both scattering and absorption. Of course you have to solve these equations for every different frequency of the light because especially for molecules, there’s a strong frequency dependence.

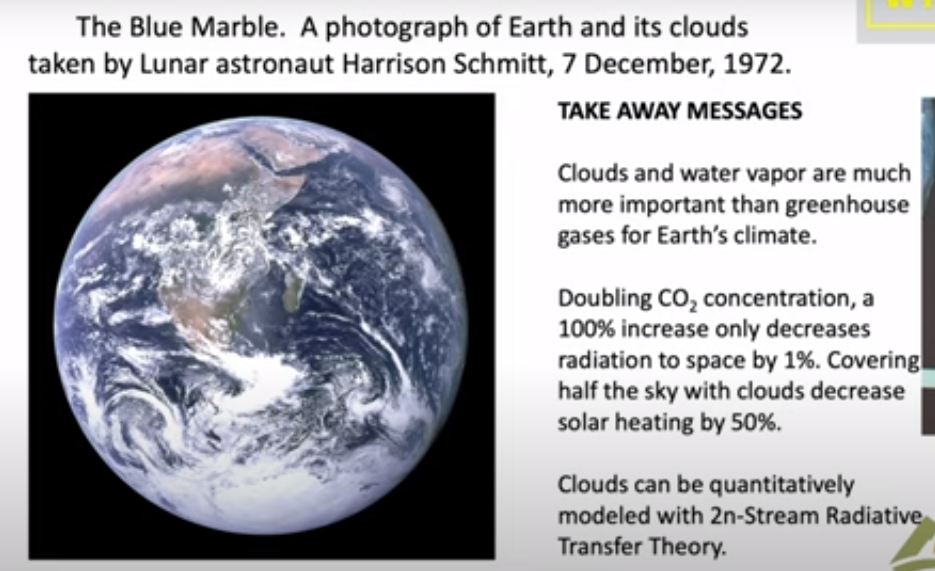
In summary,  let me show you this photo which was taken by Harrison Schmitt who was a friend of mine on one of the first moonshots. It was taken in December and looking at this you can see that they were south of Madagascar when the photograph was taken. You can see it was Winter because here the Intertropical Convergence Zone is quite a bit south of the Equator; it’s moved Way South of India and Saudi Arabia. By good luck they had the sun behind them so they had the whole earth Irradiated.

There’s a lot of information there and and again let me draw your attention to how much of the Earth is covered with clouds. So only very small parts of the Earth can actually be directly affected by greenhouse gases, of the order of half. The takeaway message is that clouds and water vapor are much more important than greenhouse gases for earth’s climate. The second point is the reason they’re much more important: doubling CO2 as I indicated in the middle of the talk only causes a 1% difference of radiation to space. It is a very tiny effect because of saturation. You know people like to say that’s not so, but you can’t really argue that one, even the IPCC gets the same numbers that we do.

And you also know that covering half of the sky with clouds will decrease solar heating by 50%. So for clouds it’s one to one, for greenhouse gases it’s a 100 to one. If you really want to affect the climate, you want to do something to the clouds. You will have a very hard time making any difference with Net Zero with CO2 if you are alarmed about the warmings that have happened.

So one would hope that with all the money that we’ve spent trying to turn CO2 into a demon that some good science has come out of it. From my point of view this is a small part of it, this scattering theory that I think will be here a long time after the craze over greenhouse gases has gone away. I hope there will be other things too. You can point to the better instrumentation that we’ve got, satellite instrumentation as well as ground instrumentation. So that’s been a good investment of money. But the money we’ve spent on supercomputers and modeling has been completely wasted in my view.

World Institutions Pushing Pseudoscience


Since 1660, Nullius in verba was the Royal Society’s motto.  “Don’t take anyone’s word for it.”

Yesterday’s post showed how American science societies have taken to parroting climatist suppositions rather than applying critical intelligence to claims of a “climate crisis.” That unquestioning attitude betrays the science method expressed in the Royal Society’s motto.  Today presents Tilak Doshi describing how the same pattern appears in international institutions supposed to be objective reporters of natural conditions. His Daily Signal article is The Climate Agenda’s March Through the Institutions: Can It Be Stopped? Excerpts in italics with my bolds and added images.

A spate of stories in the media recently provides a remarkable illustration of how the globalist policy agenda of the climate-industrial complex has captured key international institutions and perverted their original organizational aims. From initially serving broad, laudable objectives for the welfare of their constituents, these institutions have been subverted over the years to serve the insistent pseudoscientific claims of climate alarmists.

The corruption of global institutions has, in turn, led to significant opposition that is becoming apparent. There is the prospect of an incoming Trump administration that is avowedly skeptical of the claims of an alleged climate crisis and is intent on exiting the U.N.’s Paris Agreement and its “net zero by 2050” policy target for a second time. This presents a welcome challenge to these corrupt institutions.

Will President Donald Trump and some of the populist parties in Europe
be capable of countering the entrenched globalist climate agenda?

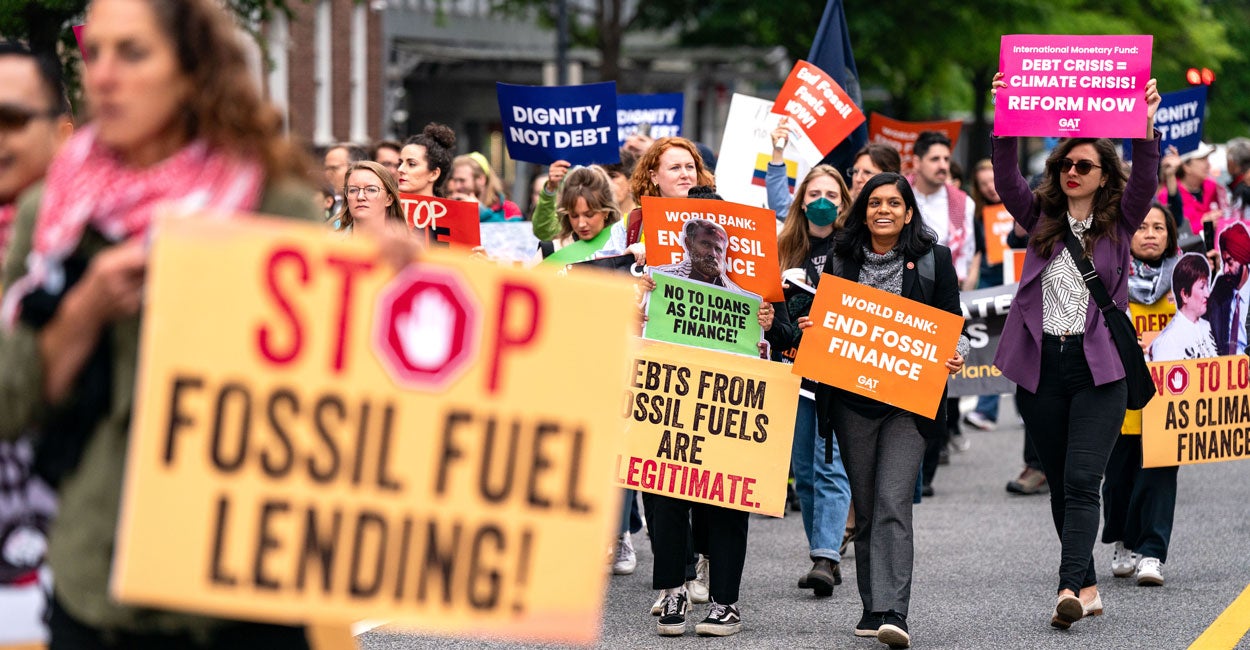
The World Bank

On Oct. 17, Oxfam published a report that shockingly found that up to $41 billion in World Bank climate finance—nearly 40% of all climate funds disbursed by the World Bank over the past seven years—is “unaccounted for between the time projects were approved and when they closed.” In other words, no one knows how the money was used. There is no paper trail revealing where the money went or what the accomplished results were.

Green cronyism, ranging from the Solyndra debacle—the waste of almost half a billion dollars of taxpayers’ money on a failed solar farm project under President Barack Obama’s watch—to President Joe Biden’s duplicitously-named Inflation Reduction Act, which will unleash an estimated $1 trillion deluge of subsidies on favored “green” industries, is nothing new. But it is instructive to trace the World Bank’s decline from its honorable founding objectives to its current status as yet another institution advocating green causes.

Dr. Jim Yong Kim, reflecting the progressive virtues of Obama, who appointed him as president of the World Bank in 2012, imposed a ban on the financing of coal-fired power stations in 2013. This was followed by a ban on investments in all new upstream oil and gas resource development projects.

The distinguished economist Deepak Lal, a former research administrator of the World Bank, remarked that Kim incredulously “over-ruled the cost-benefit estimates of coal-based power over solar and wind-based power generation produced by his own economic staff, justifying this by reference to a wish to cut global emissions of greenhouse gases.”

The World Bank’s objections to the use of fossil fuels despite their importance to economic growth and poverty alleviation—which constitute its foundational institutional objectives—can be traced to the intellectual evolution of its management under James Wolfensohn during his decade as president (1995-2005).

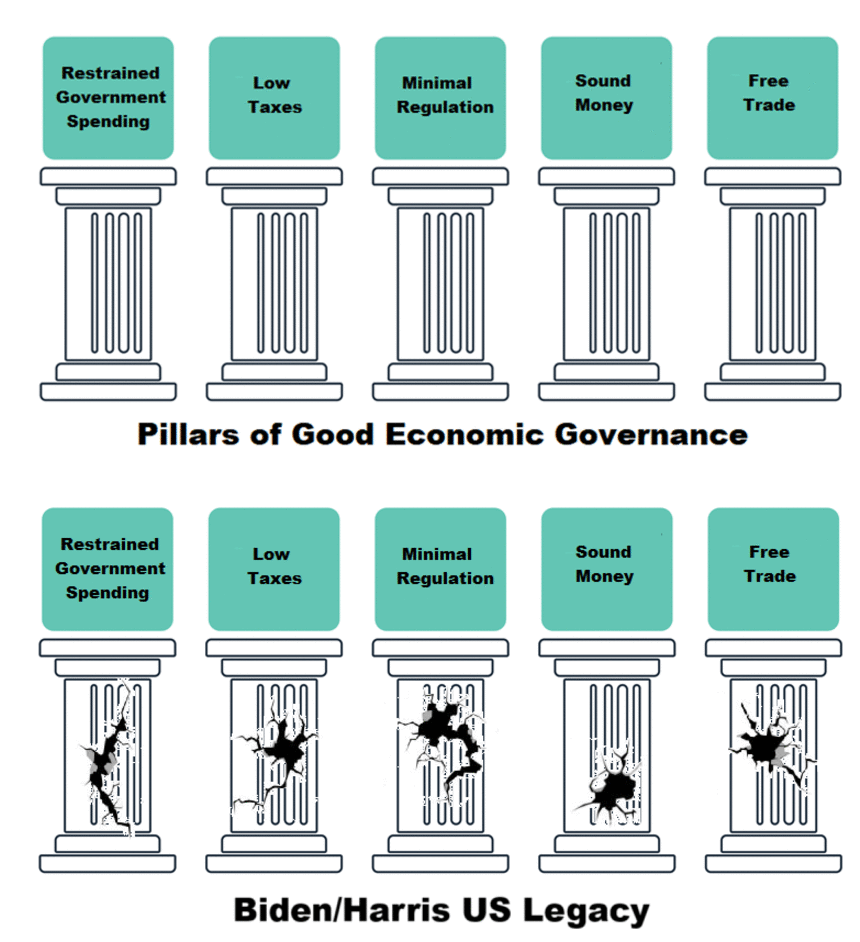
Wolfensohn traced the arc from the old regime to the new. The old was represented by the “Washington consensus” of free markets, liberal trading regimes, sound money, and entrepreneurship associated with the classical liberalism of Adam Smith.

The new intellectual environment of the World Bank’s management—personified by Joseph Stiglitz, chief economist of the World Bank (1997-2000)—was defined by the theoretical failures of the free market, especially in accounting for the alleged negative climate impacts of fossil fuel use.

Stiglitz, a climate alarmist, wrote in a 2015 court brief for a failed climate lawsuit brought on behalf of a group of children against the U.S. federal government that “fossil fuel-based economies imposed ‘incalculable’ costs on society and shifting to clean energy will pay off.” [See Climatists Make Their Case by Omitting Facts]

Rupert Darwall, a former adviser to the United Kingdom’s chancellor of the exchequer and author of “Green Tyranny,” encapsulates the betrayal of the World Bank to its founding objectives as follows:

The World Bank’s mission has been subverted by green ideologues who assert that a low-carbon world benefits the world’s poor but fail to acknowledge that making energy much more costly increases poverty. The World Bank tags itself as ‘working for a world free of poverty’ … In making its choice between development and sustainability, the World Bank has decided it is going to try and ‘save the planet’ on the backs of the poor.

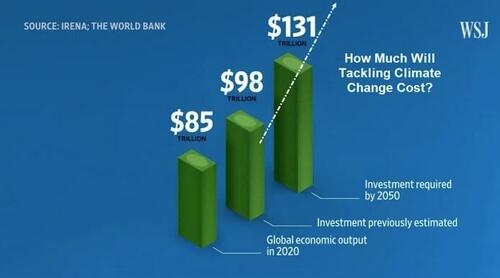
Yes, those are trillions of US$ they want to spend on an imaginary crisis.

By abdicating its founding principles for alleviating global poverty, the World Bank has taken a lead role among multilateral financial institutions in denying vast financial resources to poorer countries. It has hypocritically vetoed the right of developing countries to adopt the path of economic growth and environmental improvement that the now-rich countries had taken up successfully since the Industrial Revolution two centuries ago. The World Bank’s obsessive support for intermittent, low-yield renewable energy such as solar and wind power comes at the cost of its central charter to help the poor, an outcome that can only be described as egregiously unjust.

The UN Intergovernmental Panel on Climate Change

The U.N. IPCC issued a news release on Dec. 6 prior to the start of a “scoping” meeting in Kuala Lumpur of over 230 experts from 70 countries to draft outlines of working group contributions to the U.N. IPCC’s seventh Assessment Report (to be completed in 2029).

In the press release, the IPCC claimed that human combustion of fossil fuels “has resulted in more frequent and more intense extreme weather events that have caused increasingly dangerous impacts on nature and people in every region of the world.” This is contrary to the IPCC’s position hitherto, which is that almost all types of extreme weather events cannot be attributed with confidence to human activity.

The position of the IPCC regarding the lack of any link between climate change and extreme weather events is contrary to the almost daily headlines in the mainstream media attributing specific adverse weather events to “climate change.”

The work of eminent climate policy analysts Steve Koonin and Roger Pielke Jr. has done much to expose the pseudoscientific nature of what has been called “attribution studies.” These typically involve researchers who apply their climate models and historical observations to conclude that any particular weather event (say a hurricane or a drought) was made “more likely” or “more severe” by some magnitude in percentage units due to “human influence” (referring to the combustion of fossil fuels).

Based on the dubious claims of “attribution science,” New York Gov. Kathy Hochul signed a climate law last week that will require companies operating in New York state responsible for large amounts of planet-warming pollution to contribute to climate damage repair efforts. Under the new state law, companies responsible for the bulk of emissions from 2000 to 2018 will be on the hook for some $3 billion a year over the next 25 years.

Koonin cites the World Meteorological Organization that states that “any single event, such as tropical cyclone cannot be attributed to human-induced climate change, given the state of scientific understanding.” The IPCC’s “Special Report on Extreme Events” states that “Many weather and climate extremes are the result of natural climate variability … Even if there were no anthropogenic changes in climate, a wide variety of natural weather and climate extremes would still occur.”

Nonetheless, international organizations such as the World Bank and the IPCC have been increasingly politicized to serve climate hysteria. In this context, Chris Morrison of The Daily Sceptic finds that “[f]ears are growing that the IPCC could water down or even ditch its current finding that almost all types of extreme weather events have little or no sign of past human involvement, or any going forward to 2100.”

International Energy Agency

On Dec. 23, U.S. Sen. John Barrasso, R-Wyo., ranking member of the Senate Committee on Energy and Natural Resources, released a report documenting how the International Energy Agency “has moved away from its energy security mission to become an “energy transition” cheerleader.”

The report finds that “French President [Emmanuel] Macron’s observation that IEA has become the ‘armed wing for implementing the Paris Agreement’ is regrettably true. With the many serious energy security challenges facing the world, however, IEA should not be a partisan cheerleader. What the world needs from IEA—and what it is not receiving now—is sober and unbiased analyses and projections that educate and inform policymakers and investors. IEA needs to remember why it was established and return to its energy security mission.”

The divergence of the IEA away from its original mission to advise policymakers in its member countries with sound analysis of trends in global energy supply and demand to becoming a “cheerleader” for radical net-zero emission policy targets has not gone unnoticed over recent years. I have written on the ideological approach adopted by the IEA in its advocacy for green causes herehere, and here.

When ideological advocacy becomes the measure of achievement for the IEA, the loss of credibility and soundness of its policy advice is only to be expected. The IEA’s messianic fervour for green technologies such as solar and wind power, “green” hydrogen, batteries, and electric vehicles prevents it from asking basic questions.

If it is true that drastically cutting back on fossil fuels is consistent with higher economic growth and increased productive employment, why does the IEA recommend policymakers force countries along “net-zero” pathways? Surely, if replacing fossil fuels with wind and solar energy and electric vehicles promotes growth and employment, then wouldn’t countries such as China and India naturally race toward this best of all possible worlds without expensive green subsidies and punitive anti-fossil fuel policies?

The Trumpian Revolution Looms

Nonprofit organizations reflect the needs of their funding members, and organizations such as the World Bank, IPCC, and IEA are no different. As their funding is primarily from the U.S. and the EU, it is not surprising that they manifest the “climate emergency” predilections of the Biden administration and the largely left-socialist West European governments that see climate change as an existential threat and a national security priority. In taking up the mantle of green advocacy on behalf of their paymasters, these organizations have lost all credibility as independent and objective advisors for their member countries.

The climate-industrial complex fears the prospect of the Trump administration’s pullout of the Paris Agreement for the second time. Politico, a reliable mouthpiece for the climate establishment, expressed these fears soon after Trump’s election victory: “The world is bracing for President-elect Donald Trump to withdraw the U.S. from the Paris climate agreement for the second time—only this time, he could move faster and with less restraint.” In Europe, the emergence of populist parties has been partly propelled by the widespread rejection by EU citizens of the onerous fiscal burdens imposed by green policies.

The seismic change in policy direction that a second term “drill, baby, drill” Trump administration promises for the global climate juggernaut—represented by the three leading international agencies covered here—can only be seen as hopeful as we look forward to positive developments in energy policy in 2025.


Wyoming: Make Carbon Dioxide Great Again–No Net Zero

A bill is progressing through the Wyoming State Legislature, as described by the author in her op-ed Rethinking Carbon Dioxide – Wyoming’s Bold Move.  Excerpts in italics with my bolds and added images.

Torrington, WY (State Senator Cheri Steinmetz) January 7th, 2025 — The people of Wyoming have always believed in the value of questioning conventional wisdom, looking at the bigger picture and finding solutions that are possible and actually work. That’s the purpose of the bill titled “Make Carbon Dioxide Great Again”. This legislation is not about denying science, it is about applying science, thoroughly reevaluating the ‘climate change’ scientific assumptions and advocating for policies grounded in practicality, reality, and achievability – common sense.

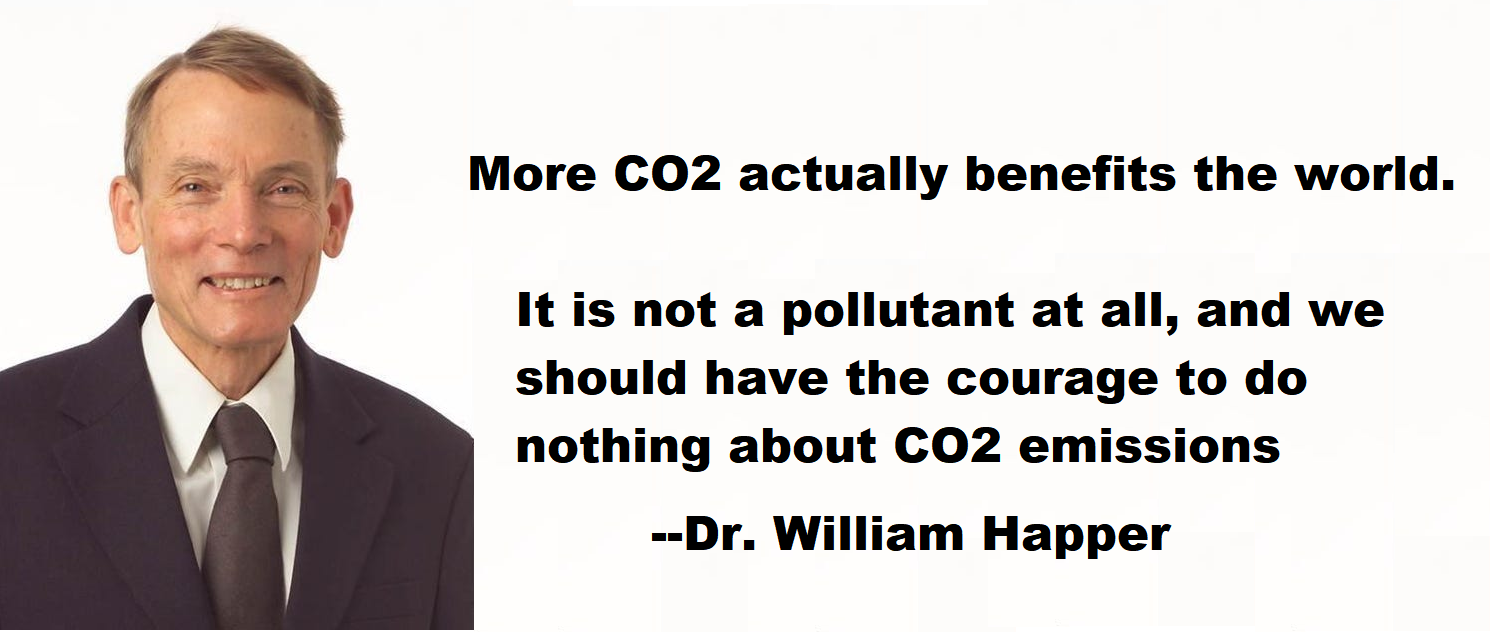
Carbon dioxide (CO2) is vital to life on Earth.

Without it, plants could not grow, and without plants, no life would survive. Scientists and farmers alike recognize that higher CO2 levels improve agricultural productivity. Plants thrive with more CO2 – they grow faster, use water more efficiently, and are more resilient to drought. NASA’s own research shows that rising CO2 has contributed to a global “greening” effect, expanding vegetation and helping ecosystems flourish. CO2 is plant food!

Yet, despite its essential role in sustaining life,
CO2 has been demonized as a pollutant.

But what impact are human driven CO2 emissions actually capable of? We are contributing a very small part of the natural carbon cycle. Current CO2 levels are among the lowest Earth has seen over its long history. There were times in the past when ecosystems flourished under much higher CO2 concentrations. Instead of vilifying this essential gas, we should be acknowledging its role in our ecosystems and industries and protect the benefits it has in our lives.

Wyoming is uniquely positioned to lead this conversation.

Our state is vital to energy production, agriculture and food industries, transportation and energy reliability and stability. We understand the real-world importance of CO2. And we understand the benefits of CO2 used directly. Our industries already use it to enhance oil recovery, making energy production more efficient. This technology exemplifies what we are capable of when we treat CO2 as a resource rather than a liability.

The bill Make Carbon Dioxide Great Again shifts how we think about CO2.

It proposes that we stop treating the essential gas as a pollutant or contaminant. It requires a clear-eyed look at how policies aimed at eliminating CO2 emissions, such as decarbonizing the West, making Wyoming carbon negative or popular “net-zero” mandates. They may sound good on paper but often come with high economic costs and questionable environmental benefits, and clearly negative effects on our people and our industries.

Wyoming must refuse to jeopardize our economy and energy security
for initiatives that will yield – at best – questionable results.

Critics of “net-zero” strategies have highlighted the risks of pursuing policy goals without fully considering their consequences. These frequently require massive investments, disruption of reliable energy systems, and the forced undue burdens on families and businesses. Instead, Wyoming advocates for a balanced approach – one that evaluates the risks and possible rewards of any CO2 management plans that will safeguard our economic stability and way of life.

This approach challenges the status quo, and that is precisely the point. Now is the time to rethink how we talk about CO2 and climate change. This bill is not about ignoring environmental concerns; it is about addressing them with clear-eyed pragmatism and truth.

Wyoming is taking a bold step forward to lead a balanced, science-based dialogue. We all stand to benefit from this. Our energy sector, agriculture, transportation and all other industries, and even the broader environment, will gain when we use CO2 wisely.

This conversation is just beginning and must spark
a national debate about the fundamental role of CO2.

It is a debate we need to have – not just in Wyoming, with our own Governor and citizens – but across the nation and with all the organizations leading the charge to “net zero.” Let us challenge the assumptions, ask the hard questions, and make sure our policies truly serve the people, industry and the environment. After all, that is the Wyoming way.

Text of Wyoming Bill     SF0092  Make carbon dioxide great again-no net zero.

AN   ACT   relating to   environmental quality;   providing legislative findings;
specifying that carbon dioxide is not a pollutant and is a beneficial substance;
providing policy statements of the state associated with carbon dioxide;
repealing low-carbon energy standard requirements; repealing conflicting provisions;
making conforming amendments;  specifying applicability;
requiring reimbursement to utility customers as specified;
requiring rulemaking; and providing for an effective date.

Be It Enacted by the Legislature of the State of Wyoming:

Section 1.    W.S. 35-11-215 is created to read:

1             SF0092

35-11-215.     Carbon dioxide;   beneficial treatment; state policy.

(a)   The legislature finds that:

  (i)    Carbon dioxide is  a foundational nutrient necessary for all life on earth. Plants need carbon dioxide along with sunlight, water and nutrients to prosper. The more carbon dioxide available for this, the better life can  flourish;

  (ii)    The carbon cycle, where carbon dioxide is reused and transferred between the atmosphere and organisms on earth, is a biological necessity for life on earth;

  (iii)    Agricultural production worldwide is outpacing population growth and breaking production records primarily due to increasing atmospheric carbon dioxide;

  (iv)    More carbon dioxide allows plants to better resist drought by using water more efficiently;

  (v)     The national aeronautics and space administration has confirmed that global vegetation is increasing from the near-polar regions to the equator. The largest contributor to this greening of  the earth is increasing carbon dioxide;

  (vi)     Carbon dioxide levels are currently at approximately four hundred twenty (420) parts per million, which is  at near-historically low concentrations.   The current carbon dioxide levels are one-sixth (1/6) of the average of  two thousand six hundred  (2,600)  parts per million over geologic time;

  (vii)     It is estimated that carbon dioxide levels  need to exceed one hundred fifty (150) parts per million to ensure the survival of plant life on earth;

  (viii)     The earth needs carbon dioxide to support  life and to  increase plant yields,  both of     which will contribute to  the health and prosperity of  all Wyoming citizens.

   (b)     It is the policy of the state of Wyoming that:

(i)       Carbon dioxide is a foundational nutrient necessary for life on earth;

(ii)       Carbon dioxide shall not be designated or treated as a pollutant or contaminant;

(iii)       The state of Wyoming shall not pursue any targets or measures that support the reduction or elimination of  carbon dioxide,  including any  “net-zero”  targets.

          Section 2.        W.S. 37-1-101(a)(intro) and 37-2-134(a)(i)  and (iv) are amended to read:

37-1-101.       Definitions.

(a)   As used in chapters 1, 2, 3, 12, and 17 and 18 of  this title:

37-2-134.       Electric generation facility closures; presumption; commission review

(a)    As used in this section:

(i)     “Dispatchable” means as defined in W.S. 37-18-101(a)(ii) a source of electricity that is available for use on demand and that can be dispatched upon request of a power grid operator or that can have its power output adjusted, according to  market needs and includes dispatchability;

(iv)    “Reliable” means as  defined in W.S. 37-18-101(a)(iv) generated electricity that is not subject to intermittent availability.

        Section    3.    W.S.    37-1-101(a)(vi)(N), 37-18-101 and  37-18-102 are repealed.

Section    4.   Not later than sixty (60) days after the effective date of this act each public utility that recovered rates from customers under W.S. 37-18-102(c)(i) or (iii),  as repealed by section 3 of this act, shall refund those rates to customers who paid them, provided that the utility shall not be  required to refund rates recovered under W.S. 37-18-102(c)(i) and (iii) that the utility had expended for carbon capture, utilization and storage technology before the effective date of this act. Refunds required under this section shall be in a form and manner specified by the public service commission

Section    5.  The public service commission shall promulgate all rules necessary to implement this act.

Section    6.  This act is effective immediately upon completion of all acts necessary for a bill to become law as provided by Article 4, Section 8 of the Wyoming Constitution.

 (END)

Ocean Even Cooler December 2024

The best context for understanding decadal temperature changes comes from the world’s sea surface temperatures (SST), for several reasons:

  • The ocean covers 71% of the globe and drives average temperatures;
  • SSTs have a constant water content, (unlike air temperatures), so give a better reading of heat content variations;
  • Major El Ninos have been the dominant climate feature in recent years.

HadSST is generally regarded as the best of the global SST data sets, and so the temperature story here comes from that source. Previously I used HadSST3 for these reports, but Hadley Centre has made HadSST4 the priority, and v.3 will no longer be updated.  HadSST4 is the same as v.3, except that the older data from ship water intake was re-estimated to be generally lower temperatures than shown in v.3.  The effect is that v.4 has lower average anomalies for the baseline period 1961-1990, thereby showing higher current anomalies than v.3. This analysis concerns more recent time periods and depends on very similar differentials as those from v.3 despite higher absolute anomaly values in v.4.  More on what distinguishes HadSST3 and 4 from other SST products at the end. The user guide for HadSST4 is here.

The Current Context

The chart below shows SST monthly anomalies as reported in HadSST4 starting in 2015 through December 2024.  A global cooling pattern is seen clearly in the Tropics since its peak in 2016, joined by NH and SH cycling downward since 2016, followed by rising temperatures in 2023 and 2024.

Note that in 2015-2016 the Tropics and SH peaked in between two summer NH spikes.  That pattern repeated in 2019-2020 with a lesser Tropics peak and SH bump, but with higher NH spikes. By end of 2020, cooler SSTs in all regions took the Global anomaly well below the mean for this period.  A small warming was driven by NH summer peaks in 2021-22, but offset by cooling in SH and the tropics, By January 2023 the global anomaly was again below the mean.

Now in 2023-24 came an event resembling 2015-16 with a Tropical spike and two NH spikes alongside, all higher than 2015-16. There was also a coinciding rise in SH, and the Global anomaly was pulled up to 1.1°C last year, ~0.3° higher than the 2015 peak.  Then NH started down autumn 2023, followed by Tropics and SH descending 2024 to the present. After 10 months of cooling in SH and the Tropics, the Global anomaly came back down, led by NH cooling the last 4 months from its peak in August. It’s now about 0.1C higher than the average for this period. Note that the Tropical anomaly has cooled from 1.29C in 2024/01 to 0.66C as of 2024/12.

Comment:

The climatists have seized on this unusual warming as proof their Zero Carbon agenda is needed, without addressing how impossible it would be for CO2 warming the air to raise ocean temperatures.  It is the ocean that warms the air, not the other way around.  Recently Steven Koonin had this to say about the phonomenon confirmed in the graph above:

El Nino is a phenomenon in the climate system that happens once every four or five years.  Heat builds up in the equatorial Pacific to the west of Indonesia and so on.  Then when enough of it builds up it surges across the Pacific and changes the currents and the winds.  As it surges toward South America it was discovered and named in the 19th century  It iswell understood at this point that the phenomenon has nothing to do with CO2.

Now people talk about changes in that phenomena as a result of CO2 but it’s there in the climate system already and when it happens it influences weather all over the world.   We feel it when it gets rainier in Southern California for example.  So for the last 3 years we have been in the opposite of an El Nino, a La Nina, part of the reason people think the West Coast has been in drought.

It has now shifted in the last months to an El Nino condition that warms the globe and is thought to contribute to this Spike we have seen. But there are other contributions as well.  One of the most surprising ones is that back in January of 2022 an enormous underwater volcano went off in Tonga and it put up a lot of water vapor into the upper atmosphere. It increased the upper atmosphere of water vapor by about 10 percent, and that’s a warming effect, and it may be that is contributing to why the spike is so high.

A longer view of SSTs

Open image in new tab to enlarge.

The graph above is noisy, but the density is needed to see the seasonal patterns in the oceanic fluctuations.  Previous posts focused on the rise and fall of the last El Nino starting in 2015.  This post adds a longer view, encompassing the significant 1998 El Nino and since.  The color schemes are retained for Global, Tropics, NH and SH anomalies.  Despite the longer time frame, I have kept the monthly data (rather than yearly averages) because of interesting shifts between January and July. 1995 is a reasonable (ENSO neutral) starting point prior to the first El Nino. 

The sharp Tropical rise peaking in 1998 is dominant in the record, starting Jan. ’97 to pull up SSTs uniformly before returning to the same level Jan. ’99. There were strong cool periods before and after the 1998 El Nino event. Then SSTs in all regions returned to the mean in 2001-2. 

SSTS fluctuate around the mean until 2007, when another, smaller ENSO event occurs. There is cooling 2007-8,  a lower peak warming in 2009-10, following by cooling in 2011-12.  Again SSTs are average 2013-14.

Now a different pattern appears.  The Tropics cooled sharply to Jan 11, then rise steadily for 4 years to Jan 15, at which point the most recent major El Nino takes off.  But this time in contrast to ’97-’99, the Northern Hemisphere produces peaks every summer pulling up the Global average.  In fact, these NH peaks appear every July starting in 2003, growing stronger to produce 3 massive highs in 2014, 15 and 16.  NH July 2017 was only slightly lower, and a fifth NH peak still lower in Sept. 2018.

The highest summer NH peaks came in 2019 and 2020, only this time the Tropics and SH were offsetting rather adding to the warming. (Note: these are high anomalies on top of the highest absolute temps in the NH.)  Since 2014 SH has played a moderating role, offsetting the NH warming pulses. After September 2020 temps dropped off down until February 2021.  In 2021-22 there were again summer NH spikes, but in 2022 moderated first by cooling Tropics and SH SSTs, then in October to January 2023 by deeper cooling in NH and Tropics.  

Then in 2023 the Tropics flipped from below to well above average, while NH produced a summer peak extending into September higher than any previous year.  Despite El Nino driving the Tropics January 2024 anomaly higher than 1998 and 2016 peaks, following months cooled in all regions, and the Tropics continued cooling in April, May and June along with SH dropping.  After July and August NH warming again pulled the global anomaly higher, September and October resumed cooling in all regions.

What to make of all this? The patterns suggest that in addition to El Ninos in the Pacific driving the Tropic SSTs, something else is going on in the NH.  The obvious culprit is the North Atlantic, since I have seen this sort of pulsing before.  After reading some papers by David Dilley, I confirmed his observation of Atlantic pulses into the Arctic every 8 to 10 years.

Contemporary AMO Observations

Through January 2023 I depended on the Kaplan AMO Index (not smoothed, not detrended) for N. Atlantic observations. But it is no longer being updated, and NOAA says they don’t know its future.  So I find that ERSSTv5 AMO dataset has current data.  It differs from Kaplan, which reported average absolute temps measured in N. Atlantic.  “ERSST5 AMO  follows Trenberth and Shea (2006) proposal to use the NA region EQ-60°N, 0°-80°W and subtract the global rise of SST 60°S-60°N to obtain a measure of the internal variability, arguing that the effect of external forcing on the North Atlantic should be similar to the effect on the other oceans.”  So the values represent sst anomaly differences between the N. Atlantic and the Global ocean.

The chart above confirms what Kaplan also showed.  As August is the hottest month for the N. Atlantic, its variability, high and low, drives the annual results for this basin.  Note also the peaks in 2010, lows after 2014, and a rise in 2021. Then in 2023 the peak was holding at 1.4C before declining.  An annual chart below is informative:

Note the difference between blue/green years, beige/brown, and purple/red years.  2010, 2021, 2022 all peaked strongly in August or September.  1998 and 2007 were mildly warm.  2016 and 2018 were matching or cooler than the global average.  2023 started out slightly warm, then rose steadily to an  extraordinary peak in July.  August to October were only slightly lower, but by December cooled by ~0.4C.

Then in 2024 the AMO anomaly started higher than any previous year, then leveled off for two months declining slightly into April.  Remarkably, May showed an upward leap putting this on a higher track than 2023, and rising slightly higher in June.  In July, August and September 2024 the anomaly declined, and despite a small rise in October, is now lower than the peak reached in 2023.

The pattern suggests the ocean may be demonstrating a stairstep pattern like that we have also seen in HadCRUT4. 

The purple line is the average anomaly 1980-1996 inclusive, value 0.18.  The orange line the average 1980-2024, value 0.39, also for the period 1997-2012. The red line is 2013-2024, value 0.67. As noted above, these rising stages are driven by the combined warming in the Tropics and NH, including both Pacific and Atlantic basins.

See Also:

2024 El Nino Collapsing

Curiosity:  Solar Coincidence?

The news about our current solar cycle 25 is that the solar activity is hitting peak numbers now and higher  than expected 1-2 years in the future.  As livescience put it:  Solar maximum could hit us harder and sooner than we thought. How dangerous will the sun’s chaotic peak be?  Some charts from spaceweatherlive look familar to these sea surface temperature charts.

Summary

The oceans are driving the warming this century.  SSTs took a step up with the 1998 El Nino and have stayed there with help from the North Atlantic, and more recently the Pacific northern “Blob.”  The ocean surfaces are releasing a lot of energy, warming the air, but eventually will have a cooling effect.  The decline after 1937 was rapid by comparison, so one wonders: How long can the oceans keep this up? And is the sun adding forcing to this process?

Space weather impacts the ionosphere in this animation. Credits: NASA/GSFC/CIL/Krystofer Kim

Footnote: Why Rely on HadSST4

HadSST is distinguished from other SST products because HadCRU (Hadley Climatic Research Unit) does not engage in SST interpolation, i.e. infilling estimated anomalies into grid cells lacking sufficient sampling in a given month. From reading the documentation and from queries to Met Office, this is their procedure.

HadSST4 imports data from gridcells containing ocean, excluding land cells. From past records, they have calculated daily and monthly average readings for each grid cell for the period 1961 to 1990. Those temperatures form the baseline from which anomalies are calculated.

In a given month, each gridcell with sufficient sampling is averaged for the month and then the baseline value for that cell and that month is subtracted, resulting in the monthly anomaly for that cell. All cells with monthly anomalies are averaged to produce global, hemispheric and tropical anomalies for the month, based on the cells in those locations. For example, Tropics averages include ocean grid cells lying between latitudes 20N and 20S.

Gridcells lacking sufficient sampling that month are left out of the averaging, and the uncertainty from such missing data is estimated. IMO that is more reasonable than inventing data to infill. And it seems that the Global Drifter Array displayed in the top image is providing more uniform coverage of the oceans than in the past.

uss-pearl-harbor-deploys-global-drifter-buoys-in-pacific-ocean

USS Pearl Harbor deploys Global Drifter Buoys in Pacific Ocean