Dr. Arnd Bernaerts Disappeared

As happened in Soviet Russia, Climate revisionists are rewriting history. Judith Curry was one of 20 leading climate scientists according to the “Climate Council” based in Australia. But in March 2016, the list was reduced to 19, and Dr Curry disappeared (here).

Now the biography of Arnd Bernaerts has disappeared from Wikipedia, despite his obvious contributions to ocean science and law. UN Undersecretary-General Satya N. Nandan: “Mr Bernaerts has given to the international community an invaluable guide to the understanding and implementation of the 1982 United Nations Convention on the Law of the Sea.” (1988).

Most likely the revisionists are unhappy with Bernaerts’ coining of phrases such as these:

Climate is the continuation of oceans by other means.

Oceans govern climate.

And his writings are extensive and contemporary, as noted on this blog under the category Oceans Make Climate, inspired by my discovery of his work:
https://rclutz.wordpress.com/2015/04/07/oceans-matter-reflecting-on-writings-by-dr-arnd-bernaerts/

You can do something against the efforts of alarmists such as William Connolley by responding to Dr. Bernaerts here.

The Deleted Biography is here.

Man Made Mild Weather (MMMW)

For some relief from the relentless stories of Catastrophic Anthropogenic Global Warming (CAGW), we turn today to a study of Man Made Mild Weather (MMMW).  CAGW also stands for Citizens Against Government Waste, not to be confused with the first acronym.  Oh wait.  (sarc/off)

Specifically this post concerns work by Dr. Arnd Bernaerts on human activities contributing to mild winters in Europe.

To start with, he is analyzing “climate” properly. Climates are plural, not singular; the term is a human construct referring to distinctly local and regional patterns and expectations of future weather. Secondly, he addresses changes observed in one particular season as a way to identify inter annual variation. Thirdly, he is well aware of oceanic fluctuations, and seeks to understand human effects in addition to natural variability.

Specifically Dr. Bernaerts studies the linkage between the Baltic and North Seas and winters in Northern Europe. His article (here) is entitled “Northern Europe’s Mild Winters. Contributions from Offshore Industry, Ships, Fishery, et cetera?”

From the Abstract:
The marine environment of North Sea and Baltic is one of the most heavily strained by numerous human activities. Simultaneously water and air temperatures increase more than elsewhere in Europe and globally, which cannot be explained with ‘global warming’.

The climatic change issue would be better understood if this extraordinary regional warming is sufficiently explained. The regional features are unique for in-depth studies due to different summer-winter conditions, shallowness of the seas, geographical structure, and main pathway for maritime weather patterns moving eastwards.

The impact of sea activities on the seasonal sea water profile structure is contributing to stronger regional warming, change in growing season, and less severe sea ice conditions. The impact of the man, whether small or large, should be understood very soon and very thoroughly.

Pay particular attention to the Discussion at the end, which includes this:

Regional seas in Northern Europe are minor from size and volume in global ocean affairs. Weather is “done” elsewhere, but every location contributes to the global picture. In the case of N-Europe it may be more significant as weather can be divided in maritime and continental influence, and due to the global air circulation from West to East, it is a gate. It may support the flow of warm wet air eastward (low pressure), or stem it by dry and cold continental air (high pressure), by diverting low pressure areas– in extreme circumstances – towards the Bering Sea or Mediterranean. In so far the North Sea and Baltic play a crucial role in how to open or close this gate.

Three facts are established: higher warming, a small shift in the seasons, and a decreasing sea ice cover. In each scenario the two sea’s conditions play a decisive role. These conditions are impaired by wind farms, shipping, fishing, off shore drilling, under sea floor gas-pipe line construction and maintenance, naval exercise, diving, yachting, and so on, about little to nothing has been investigated and is understood.

Summary:
The facts are conclusive. ‘Global Climate Change’ cannot cause a special rise in temperatures in Northern Europe, neither in the North Sea nor the Baltic or beyond. Any use of the oceans by mankind has an influence on thermo-haline structures within the water column from a few cm to 10m and more. Noticeable warmer winters in Europe are the logical consequence

Conclusion:

Two of my heroes are Dr. Pielke Sr. for his work showing how human use of the land affects climates in the locales where it occurs, and Dr. Bernaerts for exposing how human use of the ocean impacts on nearby climates.

Man-Made Ocean Warming? Yes, but it’s not CO2.

Forecasted Temperature anomalies 2 meters above ground for February 2016 in Europe


Dr Arnd Bernaerts has long studied effects in Northern European Seas. Here are excerpts from his recent publication: Offshore Wind-Parks and Northern Europe’s Mild Winters: Contribution from Ships, Fishery, et cetera? http://www.davidpublisher.org/Public/uploads/Contribute/569da5d061f90.pdf

His main point from the abstract: The marine environment of North Sea and Baltic is one of the most heavily strained by numerous human activities. Simultaneously water and air temperatures increase more than elsewhere in Europe and globally, which cannot be explained with “global warming”.

Excerpts:

Since mankind, during the course of a year, agitates the water column of North Sea and Baltic by stirring, more warmth is taken to deeper water in the summer season and rises to the surface from lower layers in the winter period, where heat is exchanged with the air until sea icing is observed. This is a process that can be seen from the beginning of September until the end of March.

Marine activities play a much bigger role in time factor and duration of ice formation. If the sea surface temperature has already reached the freezing point, any vessel shovels warmer water to the surface, or vice versa, forcing a more rapid melt… The shrinking ice cover correlates well with an increase in human activities, and subsequently leading to higher air temperature throughout the region.

Basically three facts are established: higher warming, a small shift in the seasons, and a decreasing sea ice cover. In each scenario the two seas’ conditions play a decisive role (North Sea and Baltic). These conditions are impaired by wind farms, shipping, fishing, off shore drilling, under sea floor gas-pipe line construction and maintenance, naval exercise, diving, yachting, and so on, about little to nothing has been investigated and is understood.

Summary
The facts are conclusive. “Global Climate Change” cannot cause a special rise in temperatures in Northern Europe, neither in the North Sea nor the Baltic or beyond. Any use of the oceans by mankind has an influence on thermo-haline structures within the water column from a few cm to 10m and more. Noticeable warmer winters in Europe are the logical consequence.

North Americans should not think themselves unaffected by all this.
Consider this graphic of the Siberian Express:

The more the Atlantic weather governs the situation beyond the Ural the further Polar and Siberian cold will be pushed eastwards, called ‘Siberian Express’(Fig.10). This was felt in Alaska, Canada and Eastern U.S. Many days were extremely cold with deviations from the mean of 20°C and beyond.

More information is here:

http://www.ocean-climate-law.com/12/arch/12.html

Barents Icicles

A chart of Barents Ice Cycles looks a lot like the icicles above, except upside down since Barents Sea is usually all water by September. Notice the black lines in the graph below hitting bottom near zero.

Note also the anomalies in red are flat until 1998, then decline to 2007 and then flat again.

Why Barents Sea Ice Matters

Barents Sea is No. 1, being located at the gateway between the Arctic and North Atlantic. Previous posts (here and here) have discussed research suggesting that changes in Barents Sea Ice may signal changes in Arctic Sea Ice a few years later. As well, the studies point to changes in heat transport from the North Atlantic driving the Barents Sea Ice, along with changes in salinity of the upper layer. And, as suggested by Zakharov (here), there are associated changes in atmospheric circulations, such as the NAO (North Atlantic Oscillation).

Here we look at MASIE over the last decade and other datasets over longer terms in search for such patterns.

Observed Barents Sea Ice

Below is a more detailed look at recent years.

Barents Masierrev

This graph shows that the last two years were outliers in opposite directions. 2014 was an exceptionally high annual average due to melting delayed until April, and then a much higher minimum and faster than average recovery. In contrast 2015 was high initially, became average by day 91, then dropped sharply to a meltout, followed by a slower recovery. 2012 shows the lowest Barents ice year contrasting with 2014, the highest annual extent in the last decade.

Annual average BSIE (Barents Sea Ice Extent) is 315k km2, varying between 250k and 400k over the last ten years. The volatility is impressive, considering the daily Maximums and Minimums in the record. Average Max is 781k, ranging from 608k to 936k. Max occurs on day 77 (average) with a range from day 36 to 103. Average Min is 11k on day 244, ranging from 0k to 77k, and from days 210 to 278.

In fact, over this decade, there are not many average years. Five times BSIE melted to zero, two were about average, and 3 years much higher: 2006-7 were 2 and 3 times average, and 2014 was 7 times higher at 77k.

As for Maxes, only 1 year matched the 781k average. Four low years peaked at about 740k (2006,07,08 and 14), and the lowest year at 608k (2012). The four higher years start with the highest one, 936k in 2010, and include 2011, 13, and 15.

Comparing Barents Ice and NAO
Barents Masierev

This graph confirms that Barents winter extents (JFMA) correlate strongly (0.73) with annual Barents extents. And there is a slightly less strong inverse correlation with NAO index (-0.64). That means winter NAO in its negative phase is associated with larger ice extents, and vice-versa.

Comparing Barents Ice and Arctic Annual

Barents and Arctic

Arctic Annual extents correlate with Barents Annuals at a moderately strong 0.46, but have only weaker associations with winter NAO or Barents winter averages. It appears that 2012 and 2015 interrupted a pattern of slowly rising extents.

NAO and Arctic Ice Longer Term

Fortunately there are sources providing an history of Arctic ice longer term and overlapping with the satellite era. For example:

Observed sea ice extent in the Russian Arctic, 1933–2006 Andrew R. Mahoney et al (2008)
http://seaice.alaska.edu/gi/publications/mahoney/Mahoney_2008_JGR_20thC_RSI.pdf

Russian Arctic Sea Ice to 2006

Mahoney et al say this about Arctic Ice oscillations:

We can therefore broadly divide the ice chart record into three periods. Period A, extending from the beginning of the record until the mid-1950s, was a period of declining summer sea ice extent over the whole Russian Arctic, though not consistently in every individual sea. . . Period B extended from the mid-1950s to the mid- 1980s and was a period of generally increasing or stable summer sea ice extent. For the Russian Arctic as a whole, this constituted a partial recovery of the sea ice lost during period A, though this is not the case in all seas. . . Period C began in the mid-1980s and continued to the end of the record (2006). It is characterized by a decrease in total and MY sea ice extent in all seas and seasons.

Comparing Arctic Ice with winter NAO index

The standardized seasonal mean NAO index during cold season (blue line) is constructed by averaging the monthly NAO index for January, February and March for each year. The black line denotes the standardized five-year running mean of the index. Both curves are standardized using 1950-2000 base period statistics.

The graph shows roughly a 60 year cycle, with a negative phase 1950-1980 and positive 1980 to 2010. As described above, Arctic ice extent grew up to 1979, the year satellite ice sensing started, and declined until 2007. The surprising NAO uptick recently coincides with the anomalous 2012 and 2015 meltings.

As of January 2016 NAO has gone negative for the first time in months.

Summary

If the Barents ice cycle repeats itself over the next decades, we should expect Arctic ice extents to grow as part of a natural oscillation. The NAO atmospheric circulation pattern is part of an ocean-ice-atmosphere system which is driven primarily by winter changes in the North Atlantic upper water layer.

Self-Oscillating Sea Ice System

Self-Oscillating Sea Ice System  See here.


Arctic Sea Ice: Self-Oscillating System

The Climate System is Self-Oscillating: Sea Ice Proves It.

Scientists have studied the Arctic for a long time at the prestigious AARI: Arctic and Antarctic Research Institute St. Petersburg, Russia. V. F. Zakharov has published a complete description supported by research findings under this title: Sea Ice In the Climate System A Russian View (here)

Below I provide excerpts from this extensive analysis to form a synopsis of their view: Component parts of the climate system interact so that Arctic Sea Ice varies within a range constrained by those internal forces.

Self-Oscillating Sea Ice System

Self-Oscillating Sea Ice System

The most probable regulator of the physical geographical process can be found from analysis of the relationships between the components of the climate system. It is not necessary to investigate the cause-effect relationships between all these components in succession. It is sufficient to choose one of them, let us say sea ice, and consider its direct interaction with the atmosphere and the ocean – in the climate system and the significance of internal mechanisms in the natural process. Pg 1

The idea that the ice area growth at present can be achieved by changes in only the haline structure of the upper ocean layer, as a result of surface Arctic water overflowing onto warmer but more saline water, is supported both by calculations and empirical data. Pg. 46

First of all, it should be noted that the signs of temperature and salinity anomalies coincide in most cases: a decreased salinity corresponds to enhanced temperature and vice versa. Such similarity in the change of these parameters is impossible to explain from the point of view of the governing role of thermal conditions in the atmosphere with regard to the ocean, as the air temperature increase and decrease can result only in the change of the thermal state of sea surface layer not its salinity. Pgs. 48-49

Thus, the presented facts suggest that the most significant cause of changes in the ice cover extent are the changes in the vertical water structure in the upper ocean layer, rather than the changes of thermal conditions in the atmosphere. These changes are induced by fluctuations in the horizontal dimensions of the halocline, which are governed in turn by the expansion or reduction of the surface Arctic water mass. Pg. 49

It follows from the above that, under present day conditions, the changes in the area of the Arctic sea ice during the colder period of the year can be induced only by the change in the haline structure of the upper ocean layer. Indirectly, this change will also affect the thermal state of the atmosphere. Pg. 56

It is important to note that the ice effect on the atmosphere is not limited to the thermal effect. That it can produce a significant effect on atmospheric circulation is already evident from the fact that the Arctic anticyclone, considered by Viese [13] as a regulator of atmospheric processes in the Northern polar region, could form as a pressure formation only in the conditions of the ice regime in the Arctic. Pg. 56


Zacharov fig.24

Zakharov fig.24

An analysis of cause-effect relationships does not leave any doubt in what direction and in what order the climate signal propagates in the atmosphere-ocean-polar ice system. This is not the direction and order usually assumed to cause present climate change. When it has become clear that the changes in the ocean, caused by disturbances of its freshwater balance, precede changes in the extent of sea ice, and the latter the changes in the atmosphere, then there was nothing left but for us to acknowledge self oscillation to be the most probable explanation for the development of the natural process. Pg. 58

Maybe the most convincing evidence of the Arctic sea ice stability is its preservation during the last 700,000 years despite vast glacial- interglacial fluctuations. The surface air temperature in the Arctic during the interglacial periods was higher by several degrees than present day temperatures. Pg. 44

Conclusion:

The remarkable stability of our planetary climate system derives from feedbacks between internal parts of the system, providing the oscillations we observe as natural variability. Arctic Sea Ice is a prime example.

Inside Barents Ice Crystal Ball

On a previous post (here), I linked to a recent study positing that variations in Barents Sea ice extent are predictive of Arctic extent for at least 1-2 years later. In other words, they concluded based upon measurements of ice extent and ocean heat transfers: As winter ice extent goes in Barents Sea, so goes annual ice extent across the Arctic ocean. The physical cause is changing fluxes of warm North Atlantic water penetrating through the Barents Sea into the rest of the Arctic. They acknowledge that other factors, especially winds are also in play, but believe that the ocean influx (also affected by winds) makes the largest influence. The full study is here.

Arctic Ice Dynamics

Here’s how researchers are connecting the dots:
NAO (North Atlantic Oscillation)► BSO(Heat transport by Atlantic Water (AW) through Barents Sea Opening)► Winter ice extent in Barents Sea► Winter ice extent in Arctic Ocean► Annual ice extents in Barents and Arctic Ocean.

A key scientist in this work is Randi Ingvaldsen of Geophysical Institute, University of Bergen, Institute of Marine Research. Several of her published articles are part of her doctoral thesis available here.  It comprises an informative look into the extensive body of research in this area.

The Barents Sea climate fluctuates between warm and cold periods. By comparing decade by decade we found that although the 1990s had high temperatures, both the 1930s and the 1950s were warmer. This indicates that the warming of the 1990s may very well be related to natural variability rather than anthropogenic effects.

The above results indicate a positive correlation between the NAO winter index and the area occupied by AW, a result clearly evident when investigating the total area across the BSO occupied by AW (Figure 6d). Earlier investigations have shown a positive correlation between the NAO winter index and the mean AW temperature in the BSO (also evident in
Figure 6e). This means that both the temperature and the extent of AW increase with increasing NAO winter index (Figure 6 a and d-e), although with different lags.

In summary, this preliminary investigation has shown that both the mean temperature and lateral extent of AW in the BSO is positively correlated to the strength of the Icelandic low, although with lags.

The extensive bibliography in the linked studies shows that these results are built upon the efforts of many researchers over decades. There are many references to empirical research efforts in recent times (e.g. an array of moorings in the NE Barents Sea):

The pathway and transformation of water from the Norwegian Sea across the Barents Sea and through the St. Anna Trough are documented from hydrographic and current measurements of the 1990s. . .The westward flow originates in the Fram Strait branch of Atlantic Water at the Eurasian continental slope, while the eastward flow constitutes the Barents Sea branch, continuing from the western Barents Sea opening.

In earlier decades, the Atlantic Water advected from Fram Strait was colder by almost 1 K as compared to the 1990s, while the dense Barents Sea water was colder by up 1 K only in a thin layer at the bottom and the salinity varied significantly. However, also with the resulting higher densities, deep Eurasian Basin water properties were met only in the 1970s. The very low salinities of the Great Salinity Anomaly in 1980 were not discovered in the outflow data. We conclude that the thermal variability of inflowing Atlantic water is damped in the Barents Sea, while the salinity variation is strongly modified through the freshwater conditions and ice growth in the convective area off Novaya Zemlya.

http://www.sciencedirect.com/science/article/pii/S0967063702001255

The evidence says Arctic ice varies from a variety of natural factors:


Based on these observational data, Polyakov et al. (2003) concluded that the “examination of records of fast ice thickness and ice extent from four Arctic marginal seas (Kara, Laptev, East Siberian, and Chukchi) indicates that long-term trends are small and generally statistically insignificant, while trends for shorter records are not indicative of the long-term tendencies due to strong low-frequency variability in these time series, which places a strong limitation on our ability to resolve long-term trends”. “Correlation analysis shows that dynamical forcing (wind or surface currents) is at least of the same order of importance as thermodynamical forcing for the ice extent variability in the Laptev, East Siberian, and Chukchi Seas. Source: http://www.climate4you.com/

Conclusion:

As with everything else in the climate system, Arctic ice dynamics are complex and our understanding is growing but still incomplete. And like the rest of the climate system, the more we learn, the more evident it is that fossil fuel emissions have little to do with it. We should take seriously other ways humans impact the climate system, be it from our use of the seas, as Dr. Bernaerts points out, or from using the land, as Dr. Pielke has documented.

There’s no denying climate change. Climate is changing: Not much; Not quickly; And not lately. (Credit: David Siegel here)

Footnote November 16:  

Some additional reflections:

This line of Arctic ice research is interesting because it challenges typical thinking about northern climates such as Barents.

Firstly, it goes beyond simplistic, value-laden notions, such as “less Arctic ice is a bad thing” (popular), or “less Arctic ice is a good thing” (not popular). These researchers are not making those judgments but are asking a purely scientific question: Why? Why is there more ice some years and less ice other years? And they know that any explanation is tested by how well it predicts future ice extents.

Secondly, this line of research requires a shift in focus from the summer melts in August-September, to pay more attention to the action in the winter, especially December-April. The proposed mechanism of heat transfer by means of Atlantic water happens almost entirely in that time frame, when most people leave the Arctic alone in the dark.

Finally, there is humility in making the predictions, recognizing the complexity of the situation, and how effects lag in time.  Certainly, the lack of ice in Barents this last April is a basis for thinking extents there and across the Arctic will be down next April. But there happens to be a cold Blob of surface water in the North Atlantic presently, and that may affect the result. That is the way of science:  make predictions, make observations and adapt the theory accordingly.

Everywhere Elsewhere Climate Claims

We often hear reports that something is occurring around the world, and then someone responds: “That’s not happening where I live.” And the rebuttal is, “Your neighborhood is not typical of the rest of the world.” In other words, the claim is: this trend is going on everywhere elsewhere despite your not observing it.

For a month now we have been reading in the media about how July was the hottest month in recorded history.

“July was Earth’s hottest month on record, NOAA says” http://www.bbc.com/news/world-us-canada-34009289

And at the same time, we read reports about how cool the summer was in Canada, in the US, in the UK, in parts of Europe and how cold was the winter in Australia.

“What a washout! A British summer to forget. In the UK July was colder than average, and we had 140% of average rainfall.” http://www.theguardian.com/uk-news/2015/aug/16/washout-british-summer-witness-holiday-experts

“The July contiguous U.S. average temperature was 73.9°F, 0.2°F above the 20th century average and ranked near the middle in the 121-year period of record.” http://www.ncdc.noaa.gov/sotc/national/201507

“Wetter than normal summer for most of Canada except B.C.” http://www.vancitybuzz.com/2015/08/wetter-than-normal-summer-canada-except-bc/

“A large swath stretching from eastern Scandinavia into western Siberia was cooler than average, with part of western Russia much cooler than average. Cooler than average temperatures were also observed across parts of eastern and southern Asia and scattered areas in central and northern North America.” (Source: NOAA)

So the question arises: Is there global warming unseen in most observations? How would we know what was observed in July and whether it was unusual or not?

NOAA provides this analysis of July 2015.

Continental Temperature Anomalies July 2015

CONTINENT ANOMALY (1910-2000) TREND (1910-2015) RANK
°C °F °C °F (OUT OF 106 YEARS)
North America 0.53 0.95 0.08 0.14 Warmest 16ᵗʰ
Coolest 90ᵗʰ
Ties: 1941
South America 1.43 2.57 0.14 0.25 Warmest 5ᵗʰ
Coolest 102ⁿᵈ
Europe 1.53 2.75 0.12 0.21 Warmest 6ᵗʰ
Coolest 101ˢᵗ
Africa 1.2 2.16 0.1 0.18 Warmest 2ⁿᵈ
Coolest 105ᵗʰ
Asia 0.7 1.26 0.07 0.13 Warmest 10ᵗʰ
Coolest 97ᵗʰ
Oceania 0.57 1.03 0.11 0.19 Warmest 26ᵗʰ
Coolest 81ˢᵗ

https://www.ncdc.noaa.gov/sotc/global-regions/201507

The table shows that no continent had the warmest July ever.  Africa came close and also South America, which means a milder mid-winter than usual in the southern hemisphere.  So how come they claim a record July?

The answer is provided by another NOAA analysis.

Global Analysis of July 2015

JULY ANOMALY RANK RECORDS
°C °F (OUT OF 136 YEARS) YEAR(S) °C °F
Global
Land +0.96 ± 0.18 +1.73 ± 0.32 Warmest 6th 1998 1.11 2
Coolest 131st 1884 -0.68 -1.22
Ocean +0.75 ± 0.07 +1.35 ± 0.13 Warmest 1st 2015 0.75 1.35
Coolest 136th 1911 -0.5 -0.9
Land and Ocean +0.81 ± 0.14 +1.46 ± 0.25 Warmest 1st 2015 0.81 1.46
Coolest 136th 1904, 1911 -0.47 -0.85


So there you have it.  Once again the ocean is making the climate, with July SSTs higher because of the Blob and the long-developing El Nino.  And we can expect that with all the heat now being released upward from the water, there will be cooling of SSTs and a La Nina in response.

Follow the Water–Arctic Ocean Flywheels

The motto of oceanography should be: “It’s not that simple.”

Dallas Murphy wrote that in a book containing his reflections from numerous voyages with ocean scientists, entitled Follow the Water: Exploring the Sea to Discover Climate. The author goes on to say:

“One reason why the ocean has been left out of the climate-change discussion is that its internal mechanisms and its interactions with the atmosphere are stunningly complex. That the ocean has been left out has helped pitch the discussion toward unproductive, distracting extremes–either global warming is bunk or sea levels are about to rise twenty feet–and to frame the issue as a matter of opinion, like the place of prayer in public schools.”

He also quotes respected Oceanographer Carl Wunsch: “One of the reasons oceanography has a flavor all it’s own lies in the brute difficulty of observing the Ocean.”

A previous post on the Climate Water Wheel referred to the metaphor of the ocean serving as a thermal flywheel in our planetary climate due to the massive storage of solar energy in bodies of water.  Another post provided some basics on the dynamics of sea ice.

Now, in keeping with the motto above, we shall see that indeed, it is not that simple when we look more closely inside the Arctic Ocean. For example, consider this map from Woods Hole Oceanographic Institution (WHOI):

“Follow the water: Cold, relatively fresh water from the Pacific Ocean enters the Arctic Ocean through the Bering Strait. It is swept into the Beaufort Gyre and exits into the North Atlantic Ocean through three gateways (Fram, Davis, and Hudson Straits). Warmer, denser waters from the Atlantic penetrate the Arctic Ocean beneath colder water layers, which lie atop the warmer waters and act as a barrier preventing them from melting sea ice.

Once in the Arctic Ocean basin, the water is swept into a mammoth circular current—driven by strong winds—called the Beaufort Gyre (BG). Mighty Siberian and Canadian rivers also drain into the gyre to create a great reservoir of relatively fresh water. Winds trap this water in a clockwise flow, but periodically, the winds shift and the gyre weakens, allowing large volumes of fresh water to leak out. This is “the flywheel,” said WHOI physical oceanographer Andrey Proshutinksy, and when it turns off, fresh water flows toward the North Atlantic.

The water exits the Arctic Ocean via several “gateways.” It can flow through the Fram Strait, between northeast Greenland and Svalbard Island, and then branch around either side of Iceland. It can flow around the west side of Greenland through Baffin Bay and out Davis Strait. It may also flow through a maze of Canadian islands and out Hudson Strait.
These gateways are two-way: They also let in the warmer Atlantic waters that—if not for the halocline—could melt Arctic sea ice.”

http://www.whoi.edu/oceanus/feature/is-global-warming-changing-the-arctic

The BG Flywheel System

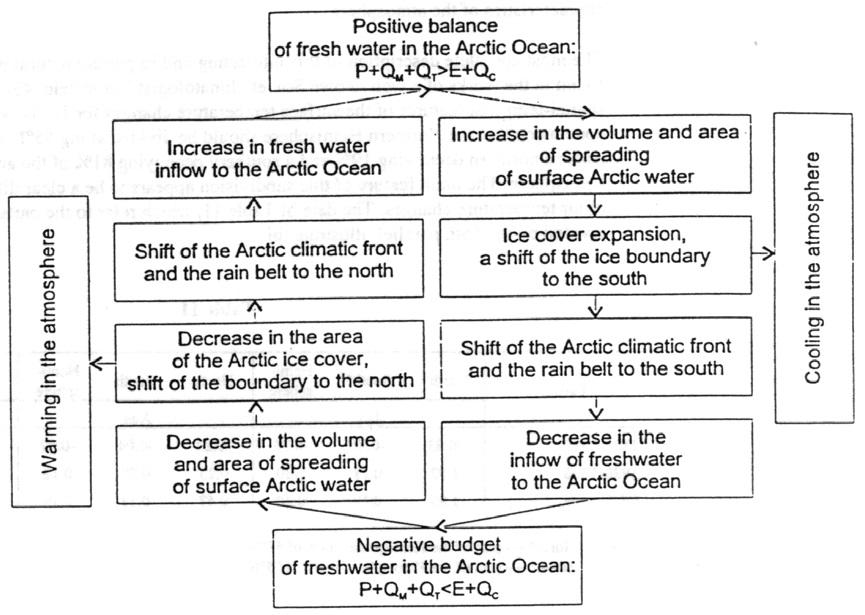
The research indicates that the complexity can be imagined as a series of flywheels, interacting and combining to moderate the short term effects of weather and changes in circulations of water and winds. Note that this conception shows the ocean flywheel as having four components or layers that operate in their own patterns while being interconnected.

And, as the flywheel system depicts, the ocean components are stratified by both temperature and salinity (saltiness). When sea ice forms, it releases salt into surface waters. These waters become denser and sink to form the Arctic halocline, a layer of cold water that acts as barrier between sea ice and deeper warmer water that could melt the ice. (Illustration by Jayne Doucette, WHOI)

More from WHOI:

Summarizing several hypotheses introduced recently in the publications mentioned above we conclude that the oceanic BG is a major part of the Arctic climate system and is responsible for:

a) Stabilization of the anticyclonic circulation of sea ice and upper ocean layers
b) Accumulation and release of liquid fresh water and sea ice from the BG
c) Ventilation of the ocean in coastal polynyas and openings along shelf-break
d) Regulation of the circulation and fractional redistribution of the summer and winter Pacific waters in the Arctic Ocean
e) Regulation of pathways of the freshwater from the Arctic to the North Atlantic

The sea ice flywheel is an intermediate link between the atmosphere and ocean. Also, sea ice is a product of the atmosphere and ocean interactions. It transfers momentum from the atmosphere to the ocean modifying it depending on sea ice concentration, thickness and its surface and bottom roughness and regulates heat and mass exchange between the atmosphere and ocean. Sea ice flywheel of the system is responsible for:

a) Regulation of momentum and heat transfer between the atmosphere and ocean
b) Accumulation and release of fresh water or salt during melting-freezing cycle
c) Redistribution of fresh water sources through involvement of the first year ice from the marginal seas into the BG circulation and keeping it there for years and transforming it into highly ridged and thick multi-year ice under converging conditions of the BG ice motion.
d) Memorizing of the previous years conditions and slowing down variations in order to avoid abrupt changes
e) Protection of ocean from overcooling or overheating (the latter is extremely important for polar biology)

http://www.whoi.edu/page.do?pid=66596

Conclusion:

Our planet’s climate has changed so little over thousands of years that alarms have been sounded over less than 1 degree celsius of estimated average warming since the Little Ice Age ended 150 years ago. But actually, our Modern Warming period was preceded by the Medieval Warm period, the Roman, and the Minoan Warm periods. Each of them was slightly cooler than the previous, and all of them warmer than now.

If you are looking for explanations why our moderate climate persists over millennia and varies only within a tight range of temperatures, give a thought to the role of the Arctic flywheel system.

Postscript:

Of course, even this is far from the whole story. As the map above shows, there’s lots more than the Beaufort Gyre going on. For example, the Transpolar Current drives flows of ice and water on the European side, in addition to the Beaufort Gyre acting on the North American side.

And despite the emphasis above on the Pacific water, the Atlantic Gulf stream supplies most of the water entering the Arctic.

“The Arctic Ocean is permanently supplied with new water from the Gulf Current, which enters the sea close at the surface near Spitsbergen. This current is called the West Spitsbergen current. The arriving water is relatively warm (6 to 8°C) and salty (35.1 to 35.3%) and has a mean speed of ca. 30 cm/sec-1. The warm Atlantic water represents almost 90% of all water masses the Arctic receives. The other ~10% comes via the Bering Strait or rivers. Due to the fact that the warm Atlantic water reaches usually the edge of the Arctic Ocean at Spitsbergen in open water, the cooling process starts well before entering the Polar Sea.”

Dueling Encyclicals

With the Vatican declaring UN IPCC science as Christian Truth, I am reminded of Aristotle (384 to 322 BC) who said:

“Give me a child until he is 7 and I will show you the man.”

If Aristotle knew what we know today about how oceans make the climate, how might he convey that meaning to one of his young Greek students?

Perhaps he would tell the story this way.

Poseidon, Lord of the Oceans

I am Poseidon and I rule the oceans, and with them I make the climate what it is.

I store the sun’s energy in my ocean water so that our world is neither too hot nor too cold.

I add water and energy into the air and together we spread warmth from the tropics to the poles. There are many obstacles and delays along the way, and there are clashes between hot and cold, which you know as storms.

The land masses make basins to collect water and energy and I send heat to each basin to form its own climate. Water heat is transported slowly, between basins and from equator to pole and back again.

The water in the air returns as rain falling on land and sea. Near the poles the water freezes and stays, sometimes for many years, until rejoining the ocean. Always the water returns and the cycles continue.

Do not be afraid of the future. Respect the oceans, take care of the land and each other, and all will be well.

The Climate According to Poseidon

How About That Blob? (June 13 Update)

June 13, 2015

As hoped for by Paris COP promoters, and by Californians looking for El Nino precipitation, the Blob in the North Pacific has intensified and may at least partly fulfill both expectations.

HADSST3 results for May are now in, and the sea surface temperature warming anomaly is up:

Global +0.12C over last May,
NH +0.16C over last May.

That will show up also in air temperature estimates, since 71% of the earth’s surface is covered by oceans. For example, UAH TLT anomalies show Global oceans +0.06C over last May, but Global land -0.1C, so Global UAH is only up +0.02C over May 2014. (Note: UAH uses satellites to measure air temperatures many meters above land or ocean, while surface datasets like HADCRUT, BEST, GISTEMP use the measured SSTs in their global mean temperature estimates).

The Blob difference shows up in UAH in the NH results: NH anomaly is +0.07 over last year, with the same increase showing over land and ocean.  Interestingly, UAH shows the North Pole cooler than a year ago, the TLT over the Arctic being -0.06 less than a year ago.  The South Pole land air temps are a whopping -0.2C colder than last May.

As far as Arctic Ice is concerned, the Blob probably caused the Bering Sea to melt out more than one month earlier than last year.  About 10% of the water entering the Arctic Ocean comes from Bering, so there should be some impact on ice melting the immediate BCE region (Beaufort, Chukchi, East Siberian Seas). So far, in that region, 2015 is tracking last year’s melt at a slightly lower extent -4%, not yet a significant effect from the Blob.

More on Arctic Ice melt season here:

https://rclutz.wordpress.com/2015/06/02/arctic-ice-watch-june-daily/

Background on the Blob

Many have noticed the warm water anomaly in the Northern Pacific, which shows up as a weak El Nino, but somewhat unexpected and out of the ordinary pattern. The warm Pacific SST last year almost pushed 2014 to a new record average surface temperature, and fossil fuel activists are pinning their Paris hopes on this year.

So it is timely for the Meteorologist who named this event to provide a clear explanation of the natural causes of the Blob phenomenon.

From Nicholas Bond (excerpted from post linked below):

Blob 101
The development of the blob of unusually warm water can be attributed largely to an unusual weather pattern that set up shop over a large region extending from the North Pacific Ocean across North America from October 2013 into February 2014.

This pattern featured a strong and long-lasting weather pattern with higher-than-normal pressure – called a ridge – over the ocean centered offshore of the Pacific Northwest. This ridge of high pressure reduced the number and intensity of storms making landfall, leading to reduced precipitation west of the Continental Divide compared to seasonal norms.

In a study published earlier this month, my colleagues and I fingered the stubborn high-pressure ridge mentioned above, and in particular the weak winds associated with it. The result was a lower-than-normal rate in how quickly heat is transferred from the ocean to the atmosphere, and slower movement of cooler water into the formation region of the blob.
In other words, the unusual atmospheric conditions produced less cooling than typical for the season from fall 2013 through much of the following winter, yielding the sea surface temperature anomaly pattern. So we can essentially blame the ridge for the blob, but what caused the ridge in the first place?

The ocean circulation – that is, the currents – and the weather during the past year, which was unusual in its own right, combined to cause the blob to evolve into a wide strip of relatively warm water along the entire West Coast of North America (see image, below).

This happens to be a pattern that has occurred before in association with decades-long shifts in ocean temperature known as the Pacific Decadal Oscillation (PDO). Previous expressions of the PDO have had major and wide-ranging impacts on the marine ecosystem including salmon and other species of fish; recent developments are receiving a great deal of attention from fishery-oceanographers along the West Coast.

http://theconversation.com/what-is-the-warm-blob-in-the-pacific-and-what-can-it-tell-us-about-our-future-climate-40140