The Hottest Year Shell Game

When it comes to climate science, always keep eyes on the prize.
The Distorted Reporting of Global Average Temperature 2025 and its relevance to the Paris Agreement
The video by Philosophical Investigations uncovers some misleading claims by people who should know better. For those who prefer reading, below is a transcript with my bolds and added images.
With the end of year 2025, the crucial questions to be answered by climate scientists were:
♦ how much has global average temperature increased since the pre-industrial period 1850 to 1900, and
♦ how does this increase compare to the Paris Agreement overarching goals?
These goals being to hold the increase in the global average temperature less than 2 degrees Celsius above pre-industrial levels and pursue efforts to limit the temperature increase to 1.5 degrees Celsius above pre-industrial levels. Note the relevance of the term pre-industrial.
The IPCC uses the reference period 1850 to 1900 to represent pre-industrial temperature. The period 1850 to 1900 and the term pre-industrial are to a large extent interchangeable in the discussion that follows. We can now provide examples of how the global average temperature at year end 2025 was reported.
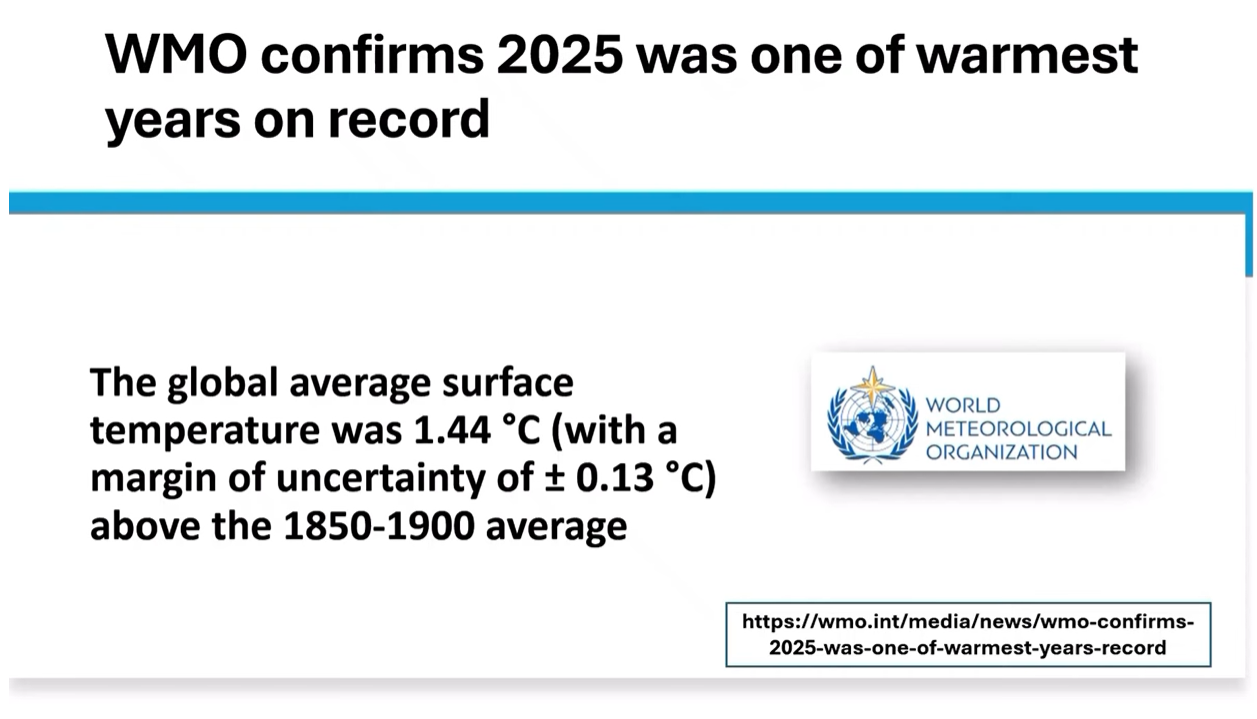
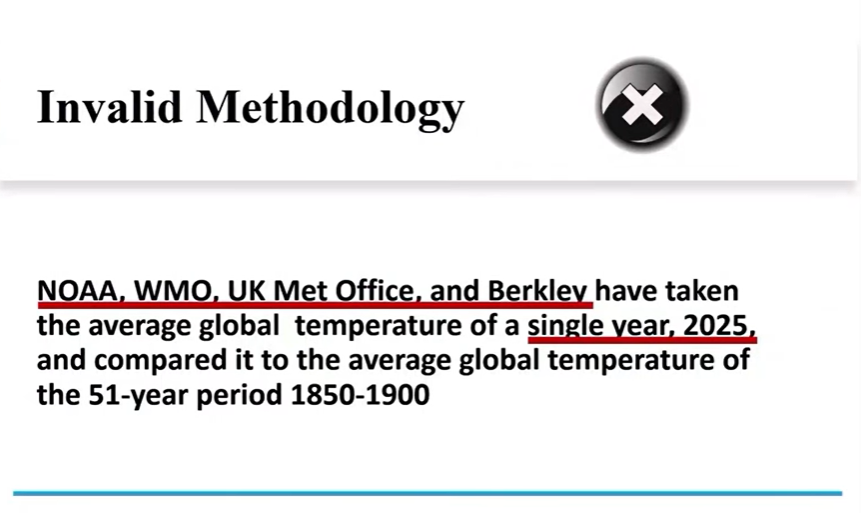
Berkeley Earth reported that in 2025 the global annual average temperature was estimated at 1.44 degrees Celsius above pre-industrial levels. The WMO reported that the global average surface temperature was 1.44 degrees Celsius above the 1850 to 1900 average. The UK Met Office reported that 2025 was 1.41 degrees Celsius above the 1850 to 1900 global average.
NOAA reported that 2025 exceeded the pre-industrial 1850 to 1900 average by 1.34 degrees Celsius. All these figures appear to measure the amount of global warming as being very close to the Paris Agreement lower limit of 1.5 degrees Celsius above pre-industrial levels. Just to double check this channel calculated global warming using the standard IPCC methodology and the official published NOAA data, the global average temperature anomaly 1850 to 1900 equals minus 0.165 degrees Celsius.
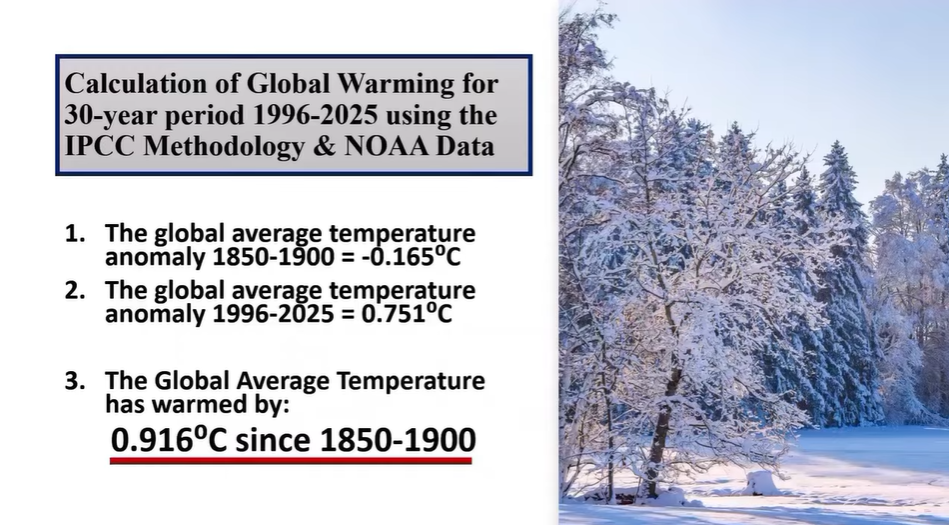
The global average temperature anomaly for the 30 year period 1996 to 2025 equals plus 0.751 degrees Celsius. Therefore, the global average temperature has warmed by 0.916 degrees Celsius since 1850 to 1900. This is a large discrepancy from the NOAA 2025 report of 1.34 degrees Celsius.
To be specific, it is a discrepancy of 46.28%. So, how did such a large discrepancy come about?
A brief background and analysis will reveal a somewhat disturbing answer. The 2016 Paris Agreement did not specify how to measure any increase in global average temperature, nor did it specify what precisely was meant by pre-industrial levels. To correct this lack of scientific clarity in the Paris Agreement, the IPCC walked its readers through the process of defining global warming.
First, it specified that the reference period 1850 to 1900 is to be used to represent pre-industrial temperature. Once scientists had defined pre-industrial, the next step is to calculate the amount of warming at any given time relative to that reference period. Warming is defined as the increase in the 30-year global average of combined air temperature over land and water temperature at the ocean surface relative to the 1850 to 1900 pre-industrial period.
[Note: One important reason that the period 1850-1900 serves as a useful baseline of climate utopia is that almost no one has any idea what the climate looked like back then, much less the climate impacts experienced. Most modern climate records start in the 20th century, and to the extent that the IPCC considers pre-20th climate it is in terms of physical quantities and not impacts or risks.

Estimated decadal deaths related to weather and climate for four decades: 1870s, 1920s, 1970s, and 2020s (estimated based on deaths over the past decade). These estimates are highly uncertain and 1870s and 1920s numbers are certainly underestimates. They should be interpreted as orders of magnitude and not as precise figures. Sources: Davis 2017, Our World in Data
The figure above shows estimated decadal deaths related to weather and climate extremes for four decades, each separated by a half-century, starting with the 1870s.]
Why 30 years? The 30-year time span accounts for the effect of natural variability, which can cause global temperatures to fluctuate from one year to the next. An earlier report had also emphasised that due to natural variability, trends based on short records that are very sensitive to the beginning and end dates, do not in general reflect long-term climate trends. That covers the necessary background.
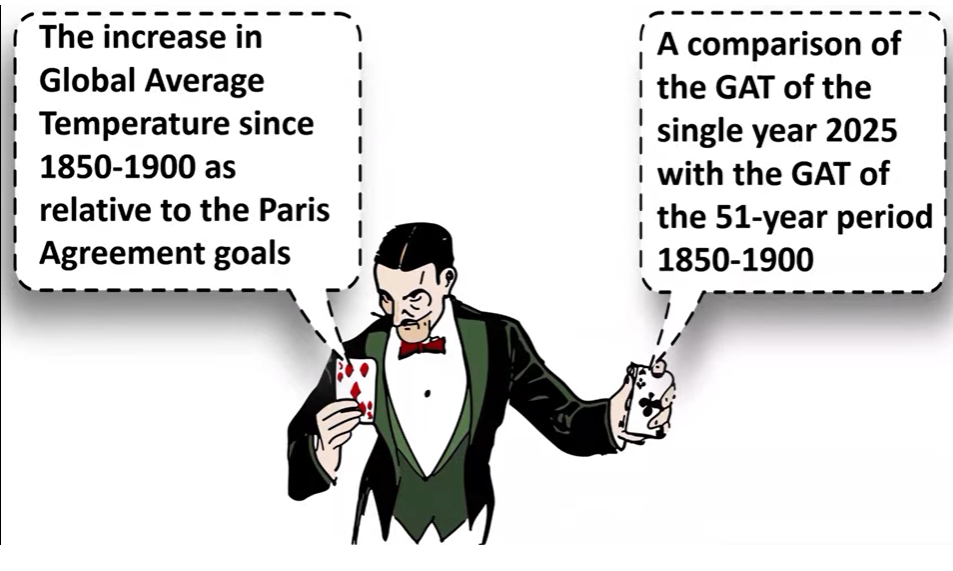
Now, the analysis of the critical question. Why does the IPCC methodology give a calculation of 0.916°C but NOAA reports 1.34°, WMO reports 1.44°C, UK Met Office reports 1.41°C, Berkeley Earth reports 1.44°C? It is disturbing to highlight that the reason for the discrepancies involves a certain amount of guile leading to misinformation. On the one hand, it seems as if we are being informed of the increase in global average temperature since 1850-1900 as related to the Paris Agreement goals.
But in fact, we are merely being informed of a comparison of the global average temperature of the single year 2025 with the global average temperature of the 51-year period 1850-1900. A comparison which is absolutely irrelevant with respect to the Paris Agreement goals. And quite emphatically, does nothing to answer the questions how much has global average temperature increased since the pre-industrial period 1850-1900 and how does this increase compare to the Paris Agreement overarching goals?
This is because, instead of comparing a 30-year global average temperature
with the 51-year period 1850-1900, these organisations have
compared a single year 2025 with 1850-1900.
This is an invalid methodology that produces the exact results these organisations have duly reported. This can be demonstrated quite easily by again using NOAA data but substituting the 30-year period 1996-2025 with the 1-year period 2025-2025. The global average temperature anomaly 1850-1900 remains the same at minus 0.165 degrees celsius.
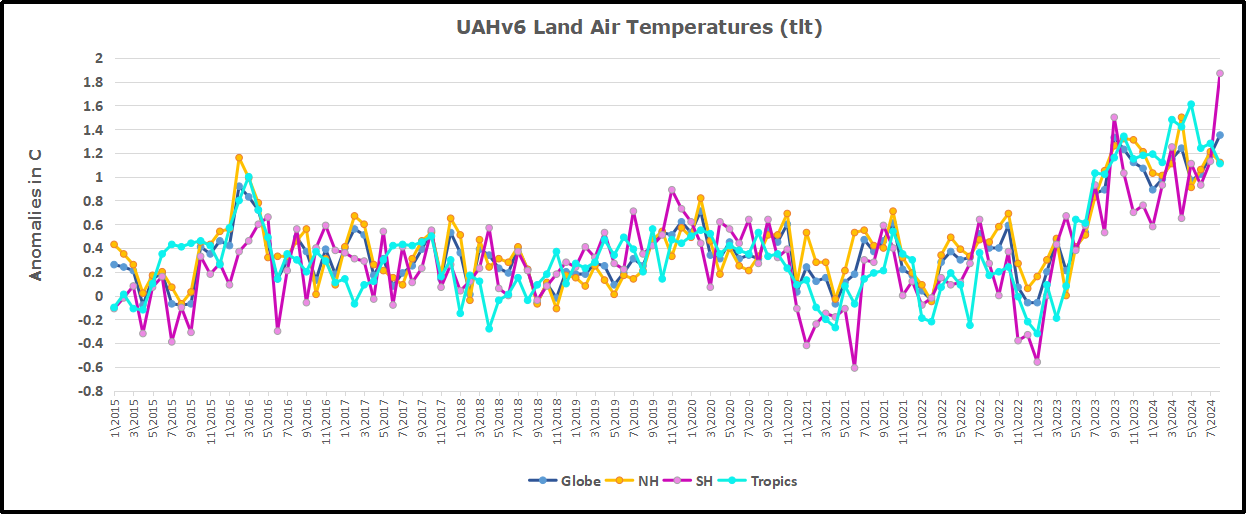
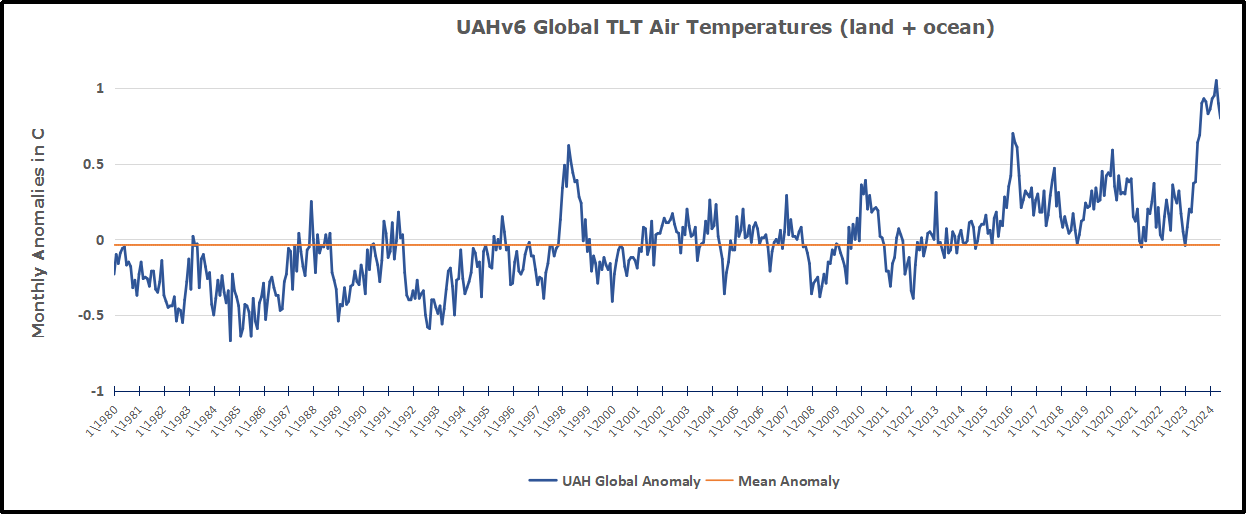
The global average temperature anomaly for this single year 2025 equals plus 1.17 degrees celsius. The global average temperature was therefore claimed to have warmed by 1.335 degrees celsius, which rounds up to 1.34 degrees celsius, exactly as reported by NOAA. All these organisations underlined and previously quoted are guilty of using this invalid methodology.
Why would these seemingly august and respected organisations do this when they knew, as stated by the UK Met Office, that a 30-year period is more relevant than the average for a single or small number of years when considering the agreement on climate change? Could it possibly be that the figure of 1.34 sounds more alarming and much closer to the Paris Agreement of 1.5 than does the valid figure of 0.916? And that is why these organisations have deviated from the standard methodology. It is difficult to believe but it is a possibility. Whatever the answer to this elusive question may be, we now provide definitive answers to the crucial questions that were to be answered by climate scientists at end of year 2025.
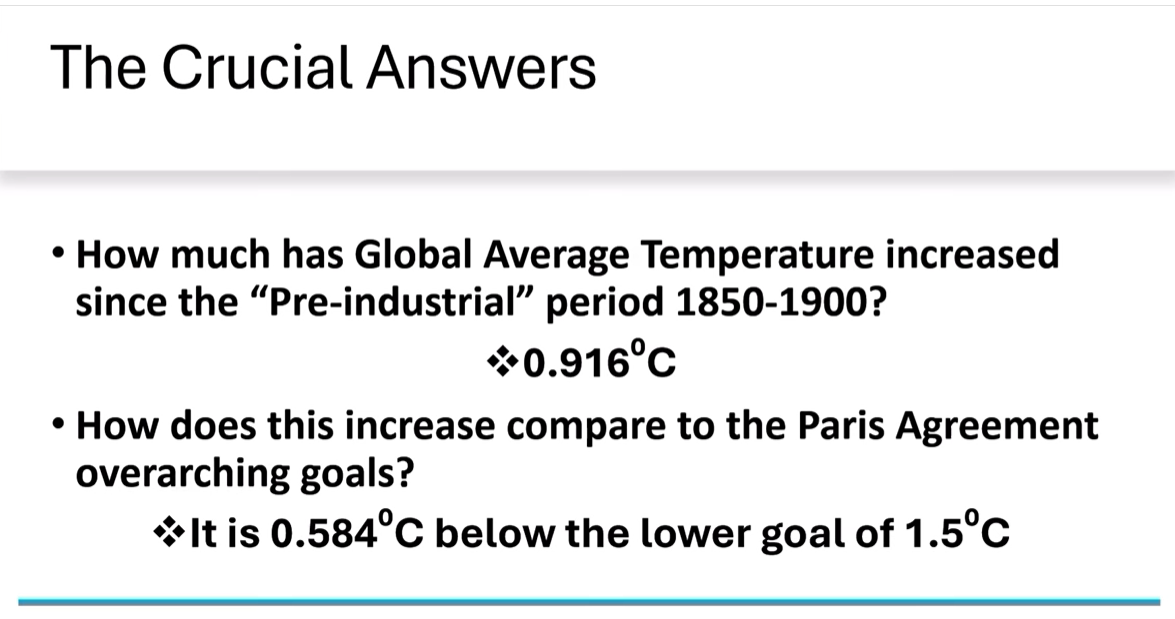
How much has global average temperature increased since the pre-industrial period 1850-1900? 0.916 degrees celsius. How does this increase compare to the Paris Agreement overarching goals? It is 0.584 degrees celsius below the lower limit of 1.5 degrees celsius. That concludes the main points of this video but we could not resist a two-minute post-script.
It may be argued that the statement 2025 exceeded the pre-industrial 1850-1900 average by 1.34 degrees celsius was merely intended to give the reader a feel for how much warmer it is now compared to the 1850-1900 period. There are two points to make in such a case. The first point is that 1850-1900 was an unusually cold period. It was in fact part of the Little Ice Age. The IPCC states that the Little Ice Age was characterised by multiple expansions of mountain glaciers worldwide. It was a roughly defined period but generally occurred between 1400 and 1900.
The second point is that it seems silly to compare the warm year 2025 to a cold average of 51 years.
Why not compare 2025 to some of the warmer years that took place during 1850-1900? For example 1878. In this case 2025 was 1.04 degrees celsius warmer than 1878. This difference is not close to the Paris Agreement 1.5 degrees celsius. Or take 1877. In this case 2025 was 1.05 degrees celsius warmer than 1877. Again not close to the Paris Agreement 1.5 degrees celsius.
It could be surmised that perhaps this is why the single year 2025 was instead compared to the 51-year average of an unusually cold period. It may be very difficult to believe but it is a possibility that was the reason. Whatever the reason, there is no doubt that all the organisations underlined and quoted have ignored the scientific methodology and advice of the IPCC that short records are very sensitive to the beginning and end dates and do not, in general, reflect long-term climate trends.
See Also: