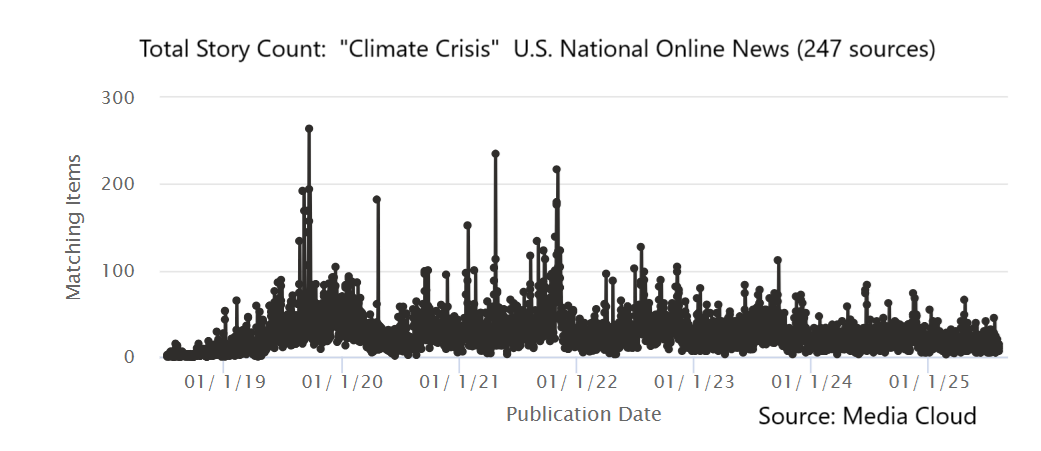
Why Climate Doomsters Can’t Recant
Ted Nordhaus writes at The EcoModernist Why I Stopped Being a Climate Catastrophist,
And why so many climate pragmatists can’t quit catastrophism. Excerpts in italics with my bolds and added images.
In the book Break Through, Michael Shellenberger and I argued that if the world kept burning fossil fuels at current rates, catastrophe was virtually assured. I no longer believe this hyperbole. Yes, the world will continue to warm as long as we keep burning fossil fuels. And sea levels will rise. About 9 inches over the last century, perhaps another 2 or 3 feet over the course of the rest of this century. But the rest of it? Not so much.
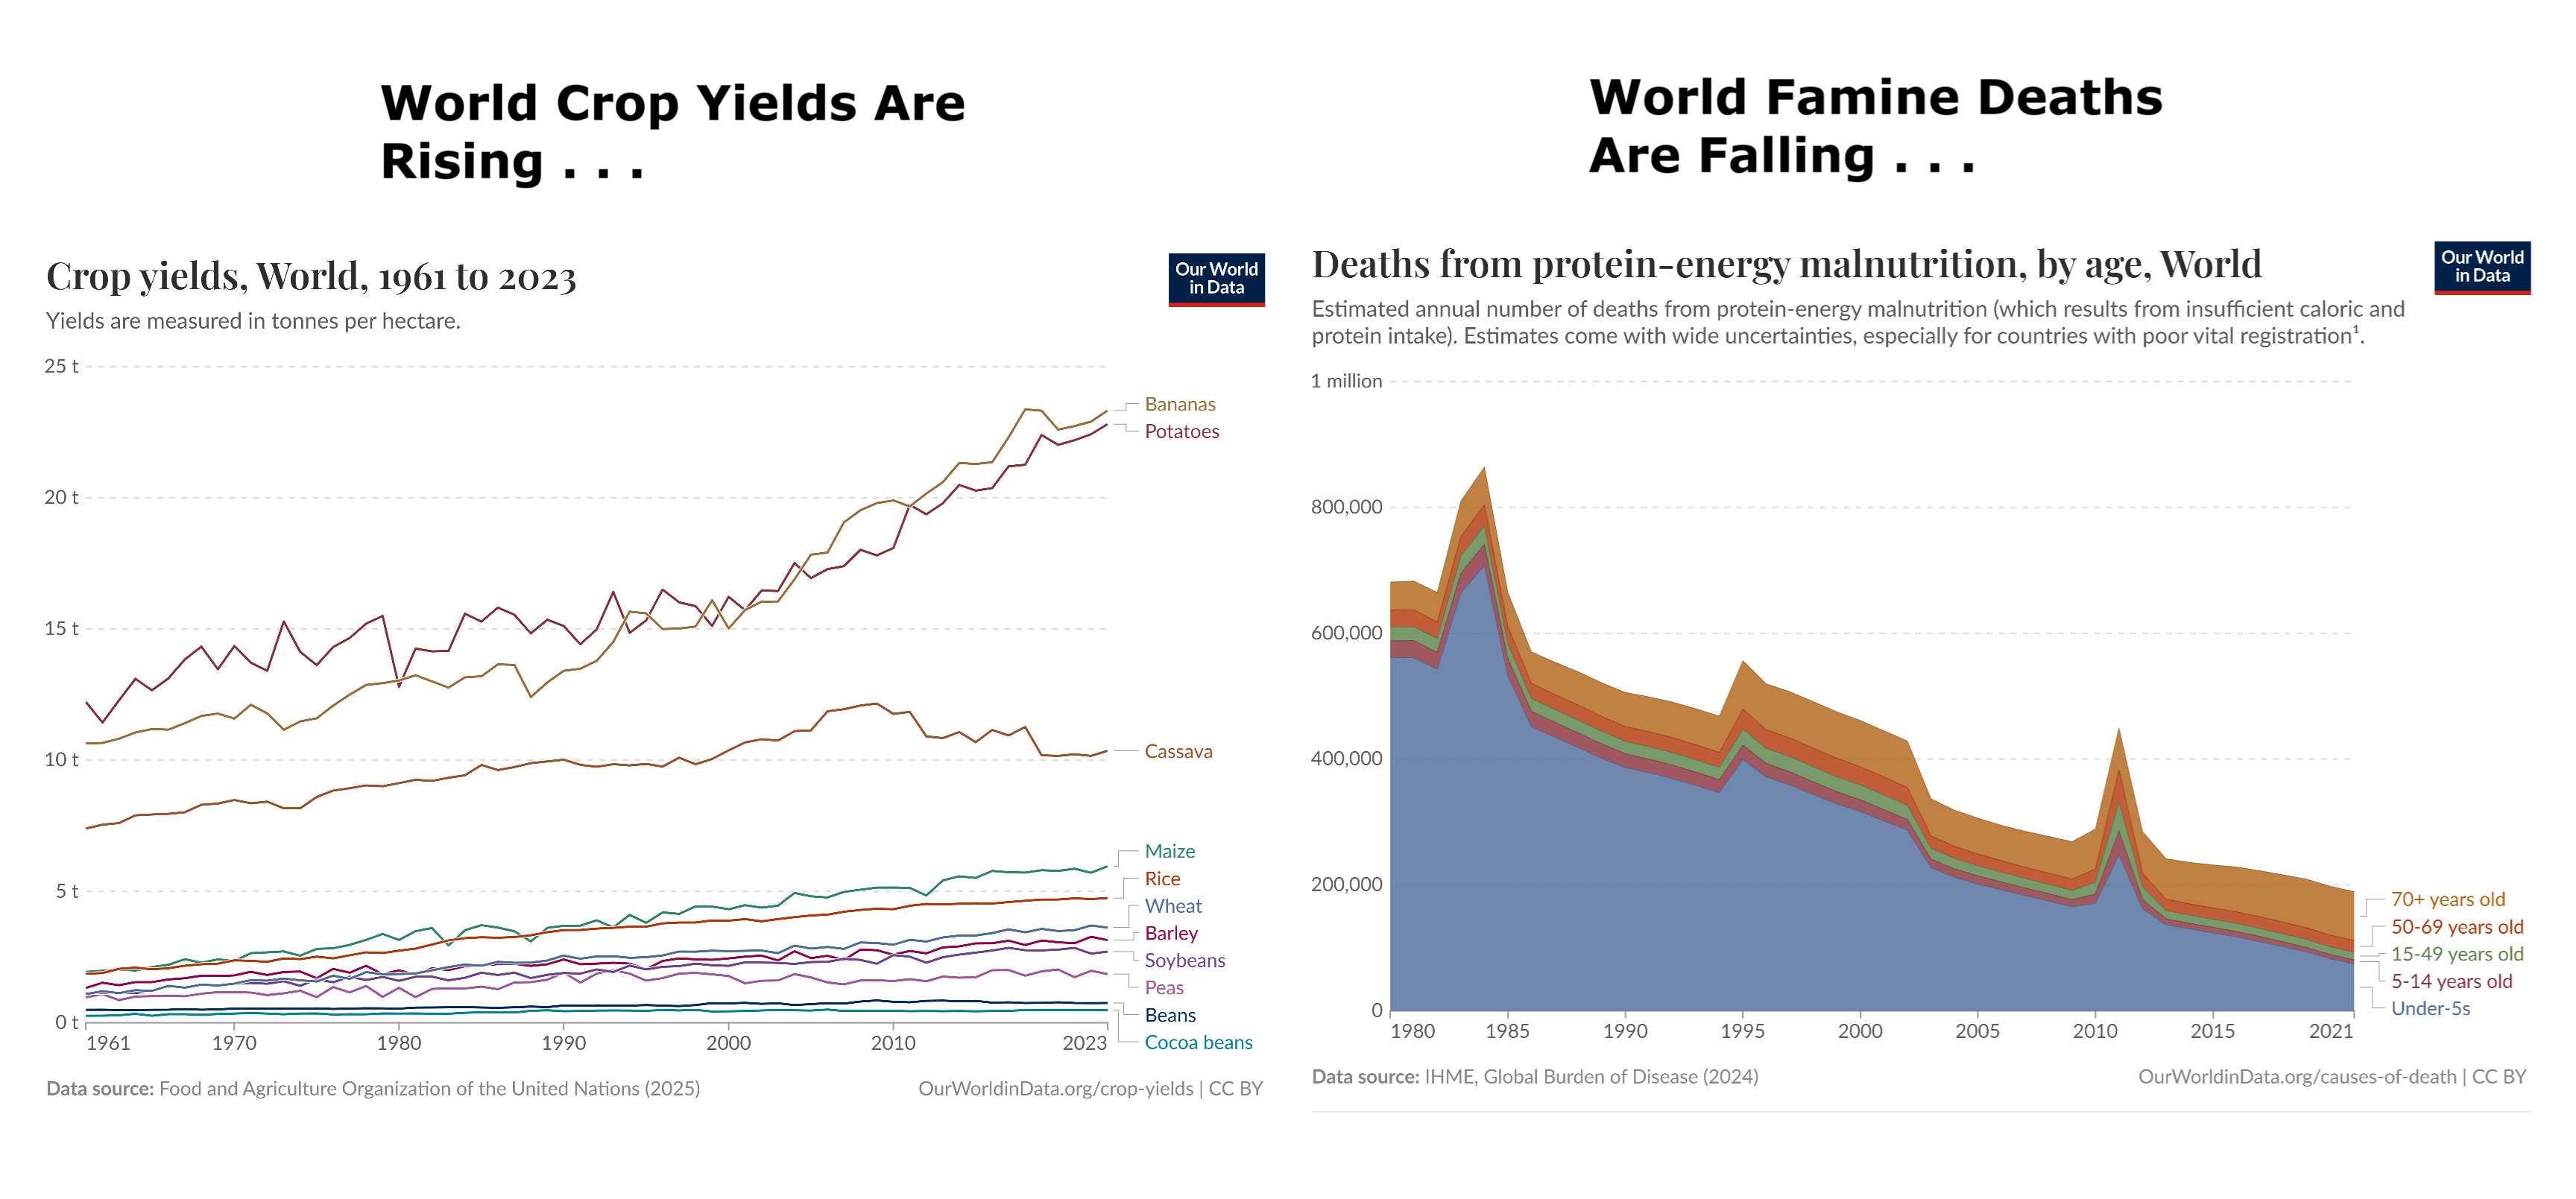
There is little reason to think that the Amazon is at risk of collapsing over the next 50 years. Agricultural yield and output will almost certainly continue to rise, if not necessarily at the same rate as it has over the last 50 years. There has been no observable increase in meteorological drought globally that might trigger the resource wars that the Pentagon was scenario planning back then.
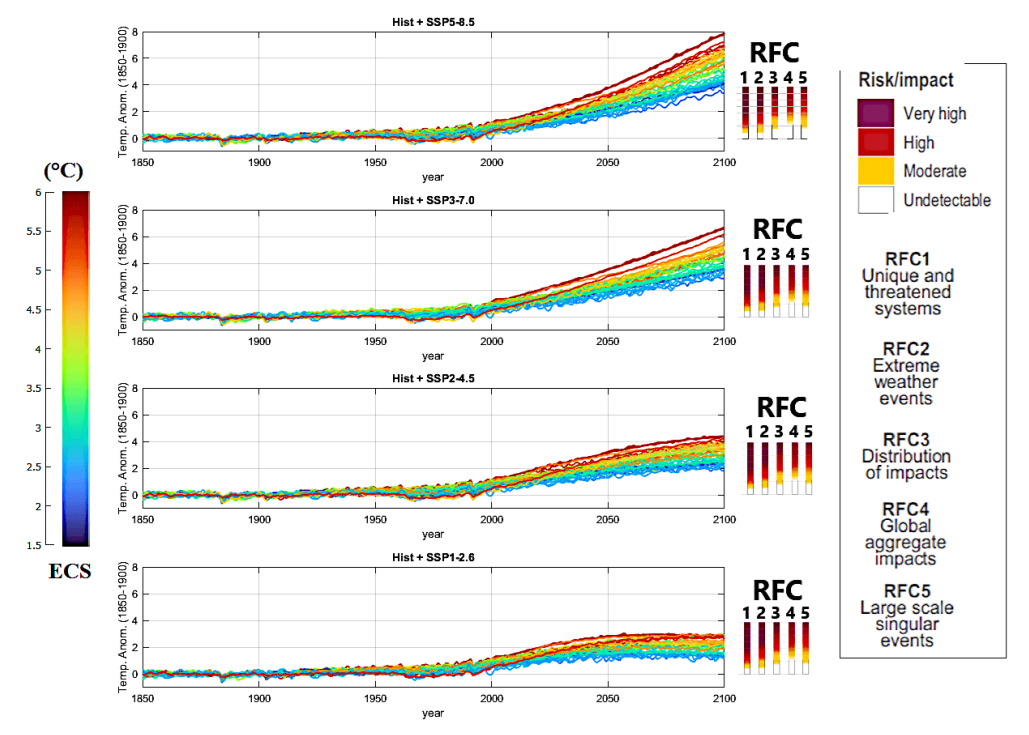
Figure 3: CMIP6 GCM ensemble mean simulations spanning from 1850 to 2100, employing historical effective radiative forcing functions from 1850 to 2014 (see Figure 1C) and the forcing functions based on the SSP scenarios 1-2.6, 2-4.5, 3-7.0, and 5-8.5. Curve colors are scaled according to the equilibrium climate sensitivity (ECS) of the models. The right panels depict the risks and impacts of climate change in relation to various global Reasons for Concern (RFCs) (IPCC, 2023). (Adapted from Scafetta, 2024).
At the time that we published Break Through, I, along with most climate scientists and advocates, believed that business as usual emissions would lead to around five degrees of warming by the end of this century. As Zeke Hausfather, Glen Peters, Roger Pielke Jr, and Justin Richie have demonstrated over the last decade or so, that assumption was never plausible. The class of scenarios upon which it was based assumed very high population growth, very high economic growth, and slow technological change. None of these trends individually track at all with actual long term global trends.
Fertility rates have been falling, global economic growth slowing,
and the global economy decarbonizing for decades.
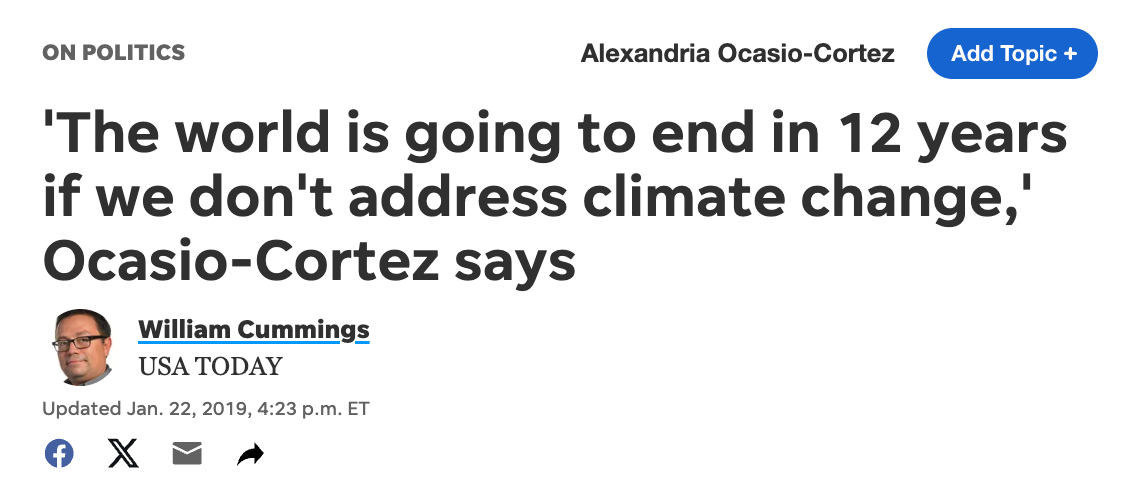
As a result of these dynamics, most estimates of worst case warming by the end of the century now suggest 3 degrees or less. But as consensus around these estimates has shifted, the reaction to this good news among much of the climate science and advocacy community has not been to become less catastrophic. Rather, it has been to simply shift the locus of catastrophe from five to three degrees of warming. Climate advocates have arguably become more catastrophic about climate change in recent years, not less.

When Is Weather Climate Change?
For me, the cognitive dissonance began as I became familiar with Roger Pielke Jr’s work on normalized hurricane losses, in the late 2000s. This was around the time that a lot of messaging from the climate advocacy community had started to focus on extreme weather events, not just as harbingers for the storms of our grandchildren, to borrow the title of James Hansen’s 2009 book, but as being fueled by climate change in the present.
If you want to know why Pielke has been so demonized over the last
15 years by climate activists and activist climate scientists,
it’s because he got in the way of this new narrative.
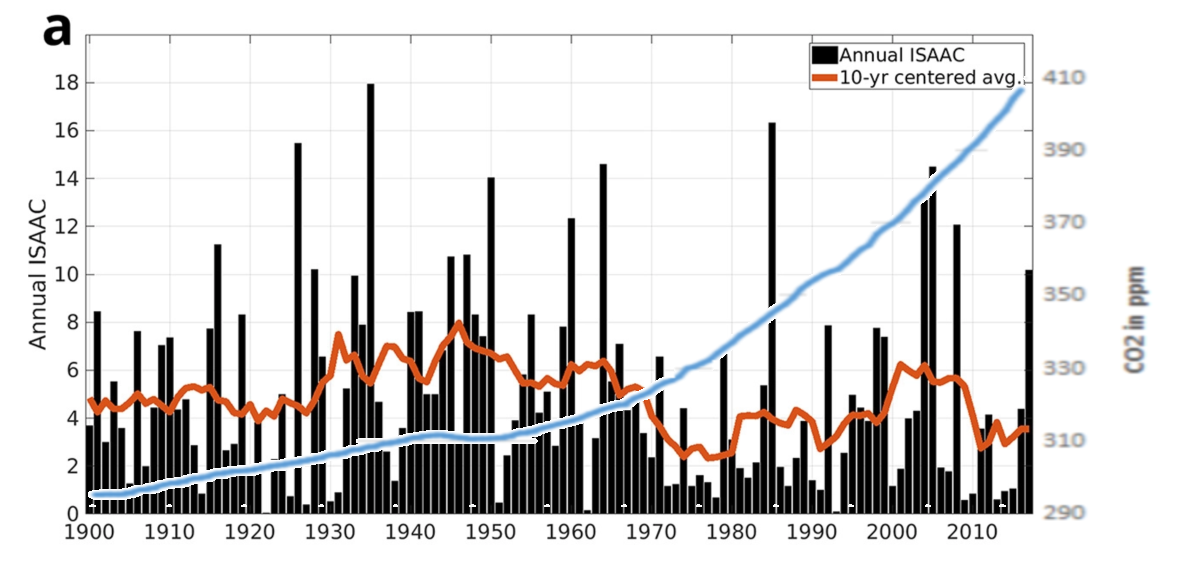
Integrated Storm Activity Annually over the Continental U.S. (ISAAC)
Pielke’s work, going back to the mid-1990s showed, again and again, that the normalized economic costs of climate related disasters weren’t increasing, despite the documented warming of the climate. And unlike a lot of researchers who sometimes produce studies that cut against the climate movement’s chosen narratives, he wasn’t willing to be quiet about it. Pielke got in the way of the advocacy community at the moment that it was determined to argue that present day disasters were driven by climate change and got run over.
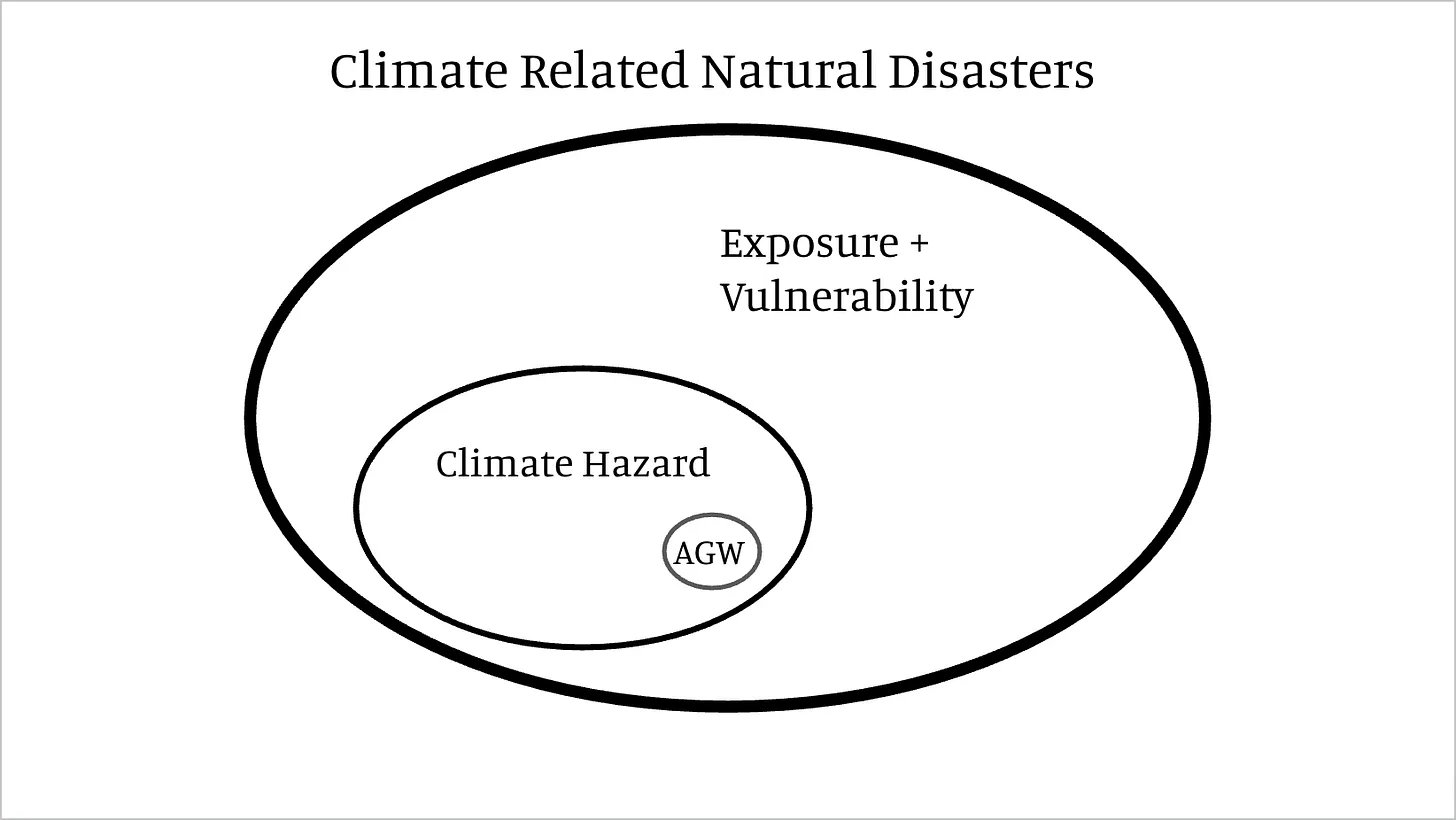
Put these two factors together—the outsized influence that exposure and vulnerability have on the cost of extreme climate and weather phenomena, and the very modest intensification that climate change contributes to these events, when it plays any role at all—and what should be clear is that climate change is contributing very little to present day disasters. It is a relatively small factor in the frequency and intensity of climate hazards that are experienced by human societies, which in turn play a small role in the human and economic costs of climate related disasters compared to non-climate factors.

This also means that the scale of anthropogenic climate change that would be necessary to very dramatically intensify those hazards, such that they overwhelm the non-climate factors in determining the consequences of future climate related events, is implausibly large.
A Sting in the Tail?
For a long time, even after I had come to terms with the fundamental disconnect between what climate advocates were saying about extreme events and the role that climate change could conceivably be playing, I held on to the possibility of catastrophic climate futures based upon uncertainty. The sting, as they say, is in the tail, meaning so-called fat tails in the climate risk distribution. These are tipping points or similar low probability, high consequence scenarios that aren’t factored into central estimates. The ice sheets could collapse much faster than we understand or the gulf stream might shut down, bringing frigid temperatures to western Europe, or permafrost and methane hydrates frozen in the sea floor might rapidly melt, accelerating warming.
But like the supposed collapse of the Amazon, once you look more closely at these risks they don’t add up to catastrophic outcomes for humanity. While sensationalist news stories frequently refer to the collapse of the gulf stream, what they are really referring to is the slowing of the Atlantic Meridian Overturning Circulation (AMOC). AMOC helps transport warm water to the North Atlantic and moderates winter temperatures across western Europe. But its collapse, much less its slowing, would not result in a hard freeze across all of Europe. Indeed, under plausible conditions in which it might significantly slow, it would act as a negative feedback, counterbalancing warming, which is happening faster across the European continent than almost any place else in the world.
Permafrost and methane hydrate thawing, meanwhile, are slow processes not fast ones. Even irreversible melting would occur over millennial timescales, fast in geological terms but very slow in human terms. The same is true of accelerated melting of ice caps. Even under very high warming scenarios, broadly acknowledged today as improbable, the Greenland and West Antarctic ice sheets contribute around a meter of sea level rise by the end of this century. Those processes would continue far into the future. But even very accelerated scenarios for rapid disintegration of ice sheets unfold over many centuries, not decades.

Moreover, the problem with grounding strong precautionary claims in these known unknowns is that doing so demands strong remedies in the present in response to future risks that are both unquantifiable and unfalsifiable, a problem made even worse by the fact that “fat tail” proponents generally then proceed to ignore the fact that the unknown, unquantifiable, and unfalsifiable risks they are referring to are incredibly low probability and instead set about centering them in the climate discourse.
Clean Energy Without Catastrophism
Why do so many smart people, most trained as scientists, engineers, lawyers, or public policy experts, and all who will tell you, and I say this not ironically, that they “believe in science,” get the science of climate risk so badly wrong?
There are, in my view, several reasons. The first is that highly educated people with high levels of science literacy are no less likely to get basic scientific issues wrong than anyone else when the facts conflict with their social identities and ideological commitments. Yale Law Professor Dan Kahan has shown that people who are highly concerned about climate change actually have less accurate views about climate change overall than climate skeptics and that this remains true even among partisans with high levels of education and general science literacy. Elsewhere, Kahan and others have demonstrated that on many issues, highly educated people are often more likely to stubbornly hold onto erroneous beliefs because they are more expert at defending their political views and ideological commitments.
The second reason is that there are strong social, political, and professional incentives if you make a living doing left of center climate and energy policy to get climate risk wrong. The capture of Democratic and progressive politics by environmentalism over the last generation has been close to total. There is little tolerance on the Left for any expression of materialist politics that challenge foundational claims of the environmental movement. Meanwhile the climate movement has effectively conflated consensus science about the reality and anthropogenic origins of climate change with catastrophist claims about climate risk for which there is no consensus whatsoever.

Whether you are an academic researcher, a think tank policy wonk, a program officer at an environmental or liberal philanthropy, or a Democratic Congressional staffer, there is simply no benefit and plenty of downside to questioning, much less challenging, the central notion that climate change is an existential threat to the human future. It’s a good way to lose friends or even your job. It won’t help you get your next job or your next grant. And so everyone, mostly falls in line. Better to go along to get along.
Finally, there is a widespread belief that one can’t make a strong case for clean energy and technological innovation absent the catastrophic specter of climate change. “Why bother with nuclear power or clean energy if climate change is not a catastrophic risk,” is a frequent response. And this view simply ignores the entire history of modern energy innovation. Over the last two centuries, the world has moved inexorably from dirtier and more carbon intensive technologies to cleaner ones. Burning coal, despite its significant environmental impacts, is cleaner than burning wood and dung. Burning gas is cleaner than coal. And obviously producing energy with wind, solar, and nuclear is cleaner than doing so with fossil fuels.

There is a view among most climate and clean energy advocates that the risk of climate change both demands and is necessary to justify a much faster transition toward cleaner energy technologies. But as a practical matter, there is no evidence whatsoever that 35 years of increasingly dire rhetoric and claims about climate change have had any impact on the rate at which the global energy system has decarbonized and by some measure, the world decarbonized faster over the 35 years prior to climate change emerging as a global concern than it did in the 35 years since.
Despite some tonal, tactical, and strategic differences, this basic view of climate risk, and corresponding demand for a rapid transformation of the global energy economy is broadly shared by the climate activists and the pragmatists. The impulse is millenarian, not meliorist.
Underneath the real politik, technocratic wonkery, and appeals
to scientific authority is a desire to remake the world.
For all its worldly and learned affect, what that has resulted in is the creation of an insular climate discourse on the Left that may be cleverer by half than right wing dismissals of climate change but is no less prone to making misleading claims about the subject, ignoring countervailing evidence, and demonizing dissent. And it has produced a politics that is simultaneously grandiose and maximalist and, increasingly, deeply out of touch with popular sentiment.