HCQ Hit Job by Big Pharma Data Miners

The hands of frontline medical practitioners have been tied treating Covid19 cases because the drugs that work on the virus work against Big Pharma profits. Computers were employed to produce attack papers  overwhelming the growing confidence that HCQ  helps patients.  A recent paper later on describes how medical science is corrupted to follow the money rather than fight disease.

Context:  The Attack Against Medical Practitioners Using HCQ

What happened in the publishing and press worlds is summarized by Elizabeth Woodworth, Canadian Health Sciences librarian specialized in medical statistics. Leaked: “Deadly” Hydroxychloroquine (HCQ) to treat Covid 19: How the World’s Top Medical Journals, The Lancet and NEJM, Were Cynically Exploited by Big Pharma  Excerpts in italics with my bolds.

On May 22, 2020, the time-honoured Lancet[vi]– one of the world’s two top medical journals – published the stunning claim that 671 hospitals on six continents were reporting life-threatening heart rhythms in patients taking hydroxychloroquine (HCQ) for Covid-19.

The headlines that followed were breath-taking.

Although wider access to the drug had recently been urged in a petition signed by nearly 500,000 French doctors and citizens,[vii] WHO and other agencies responded to the article by immediately suspending the clinical trials that may have cleared it for use.

North American headlines did not mention that HCQ has been on the WHO list of essential drugs since the list began in 1977. Nor did they mention an investigative report on the bad press that hydroxychloroquine had been getting prior to May 22, and how financial interests had been intersecting with medicine to favour Gilead’s new, more expensive drug, Remdesivir.[viii]

The statistics behind the headlines

As a Canadian health sciences librarian who delivered statistics to a large public health agency for 25 years, I sensed almost immediately that the article had to be flawed.

Why? Because health statistics are developed for different purposes and in different contexts, causing them to exist in isolated data “stovepipes.”[ix] Many health databases, even within a single region or country, are not standardized and are thus virtually useless for comparative research.

On May 28, an open letter from 200 scientists to the authors and The Lancet requested details of the data and an independent audit. The letter was “signed by clinicians, medical researchers, statisticians, and ethicists from across the world.”[xii]

The authors declined to supply the data, or even the hospital names. Meanwhile, investigative analysis was showing the statistics to be deeply flawed.[xiii][xiv]

If this were not enough, the lead author was found to be in a conflict of interest with HCQ’s rival drug, Remdesivir:  In view of the foregoing, the article was retracted by three of its authors on June 5.

How did this fraud get past The Lancet reviewers in the first place?

The answer emerges from what has remained an obscure French interview, although it has been quoted in the alternative media.[xvi]

On May 24, a closed-door Chatham House expert meeting about Covid included the editors-in-chief of The Lancet and the NEJM. Comments regarding the article were leaked to the French press by a well-known health figure, Dr. Philippe Douste-Blazy,[xvii] who felt compelled to blow the whistle.

His resulting BFM TV interview was posted to YouTube with English subtitles on May 31,[xviii] but it was not picked up by the English-speaking media.

These were The Lancet editor Dr. Richard Horton’s words, as reported by Dr. Douste-Blazy:

“If this continues, we are not going to be able to publish any more clinical research data because pharmaceutical companies are so financially powerful today, and are able to use such methodologies as to have us accept papers which are apparently methodologically perfect, but which, in reality, manage to conclude what they want to conclude.” [xix]

Doust-Blazy made his own comments on Horton’s words:

“I never thought the boss of The Lancet could say that. And the boss of the New England Journal of Medicine too. He even said it was ‘criminal’. The word was used by them.”[xx]

The final words in Doust-Blazy’s interview were:

“When there is an outbreak like Covid, in reality, there are people like us – doctors – who see mortality and suffering. And there are people who see dollars. That’s it.”[xxi]

The scientific process of building a trustworthy knowledge base is one of the foundations of our civilization. Violating this process is a crime against both truth and humanity.

Evidently the North American media does not consider this extraordinary crime to be worth reporting.

How the Science was Rigged Against HCQ

This paper describes how scientific data can be manipulated to serve an agenda. Clinical Efficacy of Chloroquine derivatives in COVID-19 Infection: Comparative meta-analysis between the Big data and the real world  Excerpts in italics with my bolds.

In the context of a pandemic with an unknown virus, development of new drugs is a major opportunity for “big pharma” industry, and this is potentially associated with a very high risk of conflicts of interest. This led us to consider these conflicts of interest as a moderator variable in the present work. As major financial issues are at stake, and may impact the interpretation of scientific data, we felt it was important to mention that none of us have conflict of interest with any pharmaceutical company.

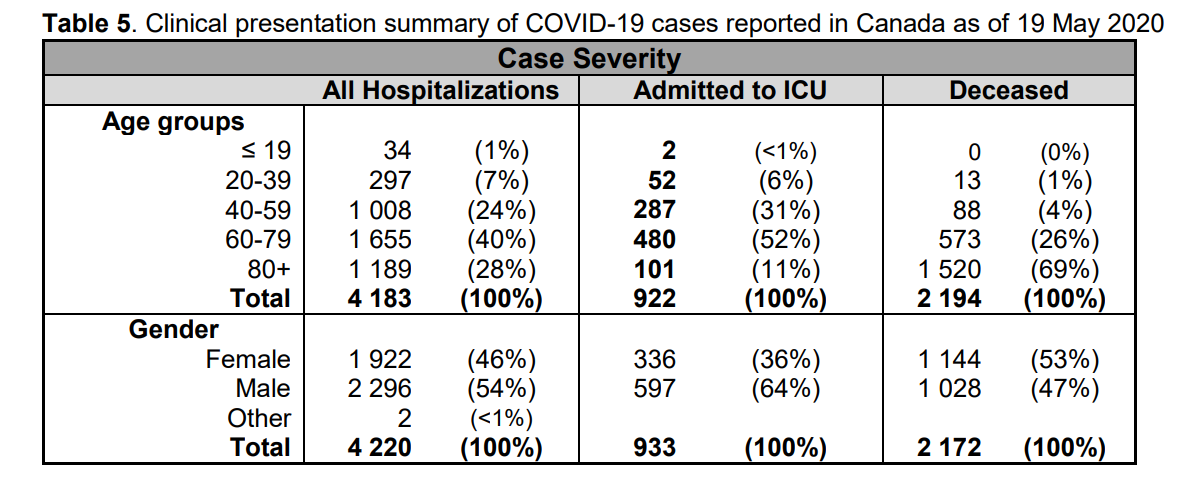
The following outcomes were considered: hospitalization rate, duration of cough, duration of fever, clinical cure, lymphocyte count, C-reactive protein level, Interleukin-6 level, thoracic CT-scan imaging, aggravation to severe, death, transfer to intensive care unit (ICU), ventilation, length of hospital stay and persistent viral shedding as assessed by PCR.

Only studies comparing a group of COVID19 patients treated with a chloroquine derivative to a control group without chloroquine derivatives were included. Non-comparative (single arm) studies and studies comparing two groups treated with chloroquine derivatives at different dosages or with different delay of treatment were excluded. Studies were classified as “big data” studies when conducted on electronic medical records extracted by public health specialists and epidemiologists who did not care COVID106 19 patients themselves. Conversely, studies were classified as “clinical studies” when mentioning details of treatments (dosages, duration, contraindications, monitoring…) and conducted by authors physicians (infectious diseases and internal medicine specialists, and pulmonologists) who cared for COVID-19 patients themselves.

Twenty studies were identified involving 105,040 patients (19,270 treated patients) from nine countries (Brazil, China, France, Iran, Saudi Arabia, South Korea, Spain, and USA). Big data observational studies were associated with conflict of interest, lack of treatment dosage and duration, and absence of favorable outcome. Clinical studies were associated with favorable outcomes and details on therapy. Among clinical studies, three of four randomized controlled trials reported a significant favorable effect.

Among clinical studies, a significant favorable summary effect was observed for duration of cough (Odds ratio (OR), 0.19, p = .00003), duration of fever (0.11, p = .039), clinical cure (0.21, p = .0495), death (0.32, p = 4.1×10⁻⁶) and viral shedding (0.43, p = .031). A trend for a favorable effect was noted for the outcome “death and/or ICU transfer” (0.29, p = .069) with a point estimate remarkably similar to that observed for death (∼0.3). In conclusion, a meta-analysis of publicly available clinical reports demonstrates that chloroquine derivatives are effective to improve clinical and virological outcomes but, more importantly, it reduces mortality by a factor 3 in patients infected with COVID-19. 

 All “big data” studies reported a lack of beneficial effect of the treatment and were significantly more likely associated with “Cons” variable (5/5 vs 3/15, p = .004). This was also observed by examination of the meta-analysis forest plot (Figure 2, Table S3 to S8). In addition, both “conflicts of interest” (p = .01) and “not described treatment protocol” variables (p = .004) were associated with “Cons” variable. Conversely, clinical studies were more likely to report a favorable effect of chloroquine derivatives in COVID-19 patients (p <.05). Consistently, clinical studies with detailed treatment protocol were more likely associated with the observation of a favorable effect of the treatment (p < .05).

In the big data analyses, 4 comparisons reported a significant effect, and all were deleterious (4/4). In the clinical studies, 17 comparisons reported a significant effect, and all were beneficial.

The clinical studies used a standardized treatment protocol with methods that included assessment of contraindications, daily dosage, adjuvant measures and duration of treatment with at least 48 hours of treatment before the objective could be assessed. For example, assessment of kalemia and electrocardiogram is critical prior to treatment, especially when the chloroquine derivative is combined with AZ (37). At the same time, we observed that virtual big data studies did not mention these elements and considered the presence of chloroquine derivative prescription in electronic records in a binary fashion. Obviously, the number of patients included in the database analyses was much higher than the number of patients included in the clinical studies, because these databases are made up of thousands of electronic medical records (EMR). As mentioned in the past (4), this type of studies have tremendous statistical power but are limited by clinical inaccuracy that makes their conclusions difficult to believe.

The major elements of this study are that, overall there is an extremely significant difference between the analyses of data not collected directly by the doctors who cared for patients and the studies carried out by the physicians who set up these studies and cared for patients, including the randomized studies. The second thing is that in these studies conducted electronically, the treatment is never really specified, with the dosage and duration of treatment making it impossible to assess efficacy (dose too low) or toxicity (dose too high). In addition to this major bias, we also noted a significant bias when the authors had conflicts of interest due to their relationship with industrialists trying to market molecules in the same therapeutic framework competing with HCQ.

Overall, and as previously published, the relevance of the analysis of important medical data depends on clinical accuracy (4). Indeed, the discrepancy between clinicians and epidemiologists reflects a major trend, that of the analysis of large medical data, with database warehouse more or less well filled by individuals who are not directly included in the work reported. This analysis is unrelated to the observations made by physicians who are in direct contact with patients and which lead to divergent interpretations and opposite conclusions, which are of real interest and show that the world predicted by Baudrillard (39); that of a parallel world of numerical analysis completely disconnected from reality; is being born.

Under these conditions, a meta-analysis allowing for the combination of different studies makes it possible to identify a general trend. This makes it possible to reconcile the chloroquine derivative efficacy that many doctors have perceived with the results of the first published studies. This meta-analysis is based on several studies, including four RCTs, and identifies a favorable trend toward the benefit of chloroquine derivatives in the treatment of COVID-19 patients, enabling us to make a grade I recommendation for its use against the disease.

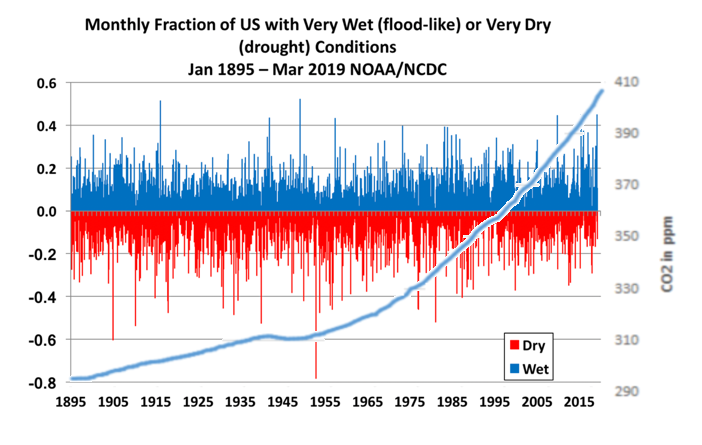
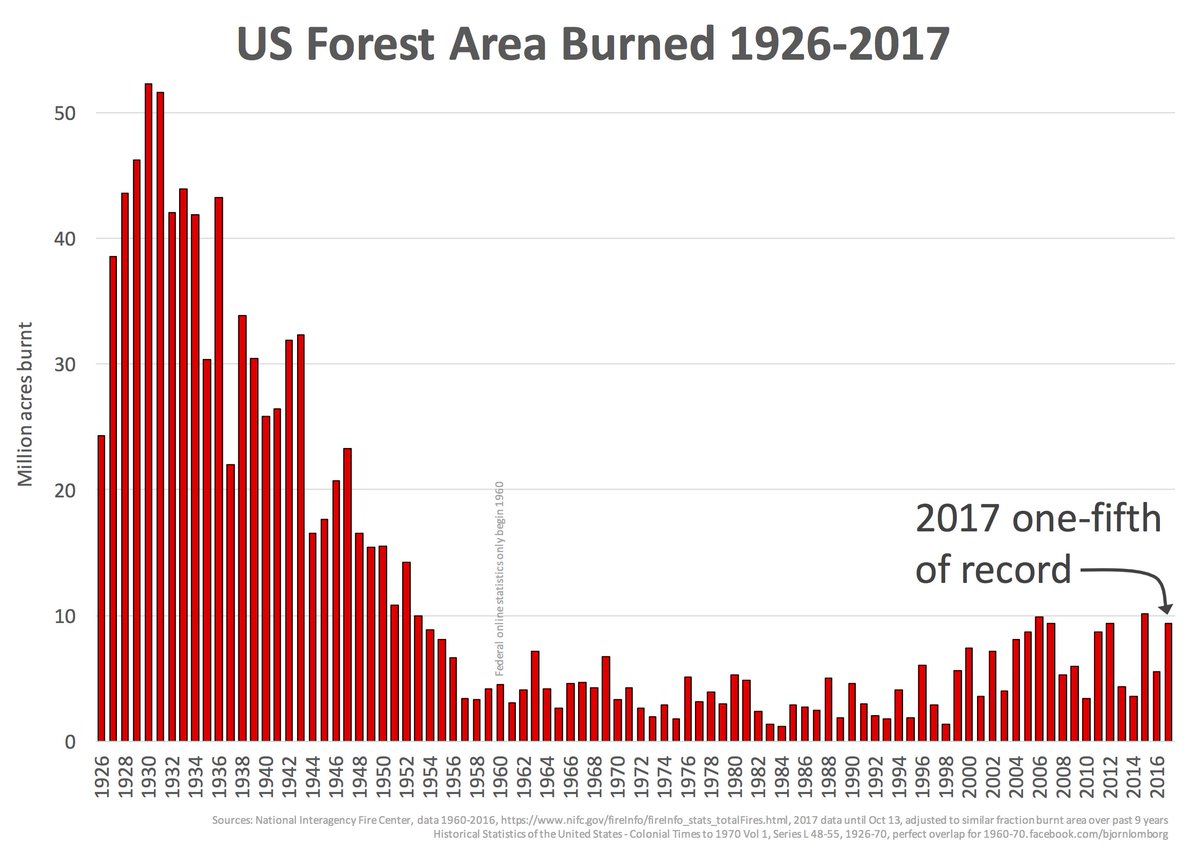
Footnote:  The “parallel world of numerical analysis disconnected from reality” sounds a lot like climate science.  We are in a Brave New World where narratives are primary, while facts and data are servants to the agenda. See Climate Science Was Broken

More Bad News for Big Pharma:

Doctors in Italy, Israel and U.S. say the coronavirus may be losing its potency and becoming less deadly even as it spreads. Some wonder if there will be enough cases around when a vaccine becomes available. See Covid Decline in Canada and World June 8


In search of Covid19 Recoveries

In reporting on Covid19 pandemic, governments have provided information intended to frighten the public into compliance with orders constraining freedom of movement and activity. Statistics of interest to the public have been hidden; for example only cumulative numbers are presented to show ever increasing cases and deaths. For example, the above map of the Canadian experience is all cumulative, and the curve will continue upward as long as cases can be found and deaths attributed.  As shown below, we can work around this myopia by calculating the daily differentials, and then averaging newly reported cases and deaths by seven days to smooth out lumps in the data processing by institutions.

A second major deficiency is lack of reporting of recoveries, including people infected and not requiring hospitalization or, in many cases, without professional diagnosis or treatment. The only recoveries presently to be found are limited statistics on patients released from hospital. The only way to get at the scale of recoveries is to subtract deaths from cases, considering survivors to be in recovery or cured. Comparing such numbers involves the delay between infection, symptoms and death. Herein lies another issue of terminology: a positive test for the SARS CV2 virus is reported as a case of the disease COVID19. In fact, an unknown number of people have been infected without symptoms, and many with very mild discomfort.

For this discussion let’s assume that anyone reported as dying from COVD19 tested positive for the virus at some point prior. A recent article by Nic Lewis at Climate Etc. referred to evidence that the average time from infection to symptoms is 5.1 days, and from symptoms to death 18.8 days. A separate issue, of course, is that 95+% of those dying had one or more co-morbidities contributing to the patient’s demise. Setting aside the issue of dying with/from Covid19, it is reasonable to assume that 24 days after testing positive for the virus, survivors can be considered recoveries.

Recoveries are calculated as cases minus deaths with a lag of 24 days. Daily cases and deaths are averages of the seven days ending on the stated date. Recoveries are # of cases from 24 days earlier minus # of daily deaths on the stated date. Since both testing and reports of Covid deaths were sketchy in the beginning, this graph begins with daily deaths as of April 24, 2020 compared to cases reported on May 31, 2020. Another view of the data is shown below.

The scale of testing has increased and is now well above 35,000 a day, while positive tests (cases) are dwindling.  The shape of the recovery curve resembles the case curve lagged by 24 days, since death rates are a small portion of cases.  The recovery rate has grown from 83% to 96% steady over the last 11 days.  This approximation surely understates the number of those infected with SAR CV2 who are healthy afterwards, since antibody studies show infection rates multiples higher than confirmed positive tests. In absolute terms, cases are now down to 364 a day and deaths 41 a day, while estimates of recoveries are 986 a day.

Background from previous post May 31, 2020
It took a lot of work, but I was able to produce something akin to the Dutch advice to their citizens.

The media and governmental reports focus on total accumulated numbers which are big enough to scare people to do as they are told.  In the absence of contextual comparisons, citizens have difficulty answering the main (perhaps only) question on their minds:  What are my chances of catching Covid19 and dying from it?  The map shows a lot of cases, and the chart looks like an hockey stick, going upward on a straight line. So why do I say canadians are safer than it looks like from such images?

First let’s look at daily numbers to see where we are in this process.  All the statistics come from Canada Public Health Coronavirus disease (COVID-19): Outbreak update.

By showing daily tests, new cases and reported deaths, we can see how the outbreak has built up, peaked and declined over the last 2.5 months.  The green line shows how testing grew to a sustained daily rate of 29,000, with a recent drop and recovery (all numbers are smoothed with 7 day averages ending with the stated date.) Note that the curve is now descending after peaking at 1800 on April 22, now down to 893 new cases per day.  This lower rate of infections is despite the highest rate of testing since the outbreak began. Deaths have also peaked at 177 on May 6, down to 104 May 30. (Reported deaths bumped upward yesterday due to a data transmission catchup in Quebec, explained below).  The percentage of people testing positive is down to 3%, and deaths are 0.42% of the tests administered.

But it matters greatly where in Canada you live.  In the map at the top, Quebec is the dark blue province leading the nation in both cases and deaths.  Quebec has always celebrated being a distinct society, but not in this way. Below is the same chart for the Quebec epidemic from the same dataset. The province has about 23% of the national population and does about 26% of the tests.  But Quebec contributes 56% of the cases and 64% of the deaths, as of yesterday.  Here how the outbreak has gone in La Belle Province.

The Quebec graph is more lumpy showing cases peaking May 1-9, including several days inflated by data catchups. Cases have dropped off recently, from 1100 May 7 down to 521 yesterday.  Deaths are also slowing, declining from 110 on May 7 to 71 May 30. Yesterday the reported deaths in Quebec jumped to 202 due to 165 previously unrecorded data, while the actual new deaths were 37 . The animation below shows the epidemic in Canada with and without Quebec statistics.

But clearly everywhere else in Canada, people are much safer than those living in Quebec.  So what is going on?

To enlarge image, open in new tab.

The graph shows that people in Quebec are dying in group homes, the majority in CHSLD (long term medical care facilities) and also in PSR (private seniors’ residences).  The huge majority of Quebecers in other, more typical living arrangements have very little chance of dying from this disease. Not even prisoners are much at risk.

Of course the other dimension is years of age, since this disease has punished mostly people suffering from end-of-life frailties.  A previous post reported that the Netherlands parliament was provided with the type of guidance everyone wants to see.

For canadians, the most similar analysis is this one from the Daily Epidemiology Update: :

The table presents only those cases with a full clinical documentation, which included some 2194 deaths compared to the 5842 total reported.  The numbers show that under 60 years old, few adults and almost no children have anything to fear.

Update May 20, 2020

It is really quite difficult to find cases and deaths broken down by age groups.  For Canadian national statistics, I resorted to a report from Ontario to get the age distributions, since that province provides 69% of the cases outside of Quebec and 87% of the deaths.  Applying those proportions across Canada results in this table. For Canada as a whole nation:

Age  Risk of Test +  Risk of Death Population
per 1 CV death
<20 0.05% None NA
20-39 0.20% 0.000% 431817
40-59 0.25% 0.002% 42273
60-79 0.20% 0.020% 4984
80+ 0.76% 0.251% 398

In the worst case, if you are a Canadian aged more than 80 years, you have a 1 in 400 chance of dying from Covid19.  If you are 60 to 80 years old, your odds are 1 in 5000.  Younger than that, it’s only slightly higher than winning (or in this case, losing the lottery).

As noted above Quebec provides the bulk of cases and deaths in Canada, and also reports age distribution more precisely,  The numbers in the table below show risks for Quebecers.

Age  Risk of Test +  Risk of Death Population
per 1 CV death
0-9 yrs 0.13% 0 NA
10-19 yrs 0.21% 0 NA
20-29 yrs 0.50% 0.000% 289,647
30-39 0.51% 0.001% 152,009
40-49 years 0.63% 0.001% 73,342
50-59 years 0.53% 0.005% 21,087
60-69 years 0.37% 0.021% 4,778
70-79 years 0.52% 0.094% 1,069
80-89 1.78% 0.469% 213
90  + 5.19% 1.608% 62

While some of the risk factors are higher in the viral hotspot of Quebec, it is still the case that under 80 years of age, your chances of dying from Covid 19 are better than 1 in 1000, and much better the younger you are.

Mr. Trudeau, Take Down This Wall !

Climate Problem? Data say no.

An recent article is The Crucial Question That Requires Asking: Is There a Climate Problem?  As David Simon explains, so many take the “climate problem” as a given without looking at the evidence. Excerpts in italics with my bolds and images.

In “Coronavirus and the Climate,” Wall Street Journal columnist Walter Russell Mead swallows the big lie about global warming.

Mead’s column posted on June 15 begins by sharing a projection that draconian coronavirus lockdown measures will reduce 2020 global CO2 emissions by about the amount that the United Nations Environment Program has determined is supposedly needed annually “if the world is to have any chance of keeping the average temperature from rising more than 1.5 degrees Celsius.”

Mead then laments that most of these measures “aren’t economically sustainable.” Teleworking adopted during the lockdown may become the norm for many rather than the exception, but “[a] campaign to ‘cut the commute’ globally won’t solve the climate problem.”

But Mead never considers the key question: is there is a “climate problem”? He simply accepts as undeniable scientific truth that keeping the earth’s temperature from rising more than 1.5 degrees is necessary to prevent catastrophic harm.

The scientific evidence does not support this proposition. There are speculative, pseudo-scientific projections and models that purport to show that global warming will lead to climate doom. But actual scientific data instead show that global warming has not been harmful and presents no danger to future generations.

First, rather than imperiling human life, the data show that global warming saves lives.

A 2015 study by 22 scientists from around the world found that cold kills over 17 times more people than heat.

The scientists examined over 74 million deaths in Australia, Brazil, Canada, China, Italy, Japan, South Korea, Spain, Sweden, Taiwan, Thailand, the United Kingdom, and the United States in 1985-2012. The data they compiled show that cold caused 7.29 percent of these deaths, while heat caused only 0.42 percent. The data also show that “moderately hot and cold temperatures” caused 88.85 percent of the temperature-related deaths, while “extreme” temperatures caused only 11.15 percent. See Climate Medicine

Second, the number of natural disaster deaths declined by over 80 percent as the earth’s temperature has been rising.

NASA data show that since 1920, the earth’s temperature has risen by 1.25 degrees Celsius. Since 1920, world population also has quadrupled from less than two billion to over seven and half billion. Yet during this period, EM-DAT (The International Disaster Database) data show that the number of people killed by natural disasters has declined from almost 55,000 per year to less than 10,000 per year. See Data vs. Models #3: Disasters

Third, the global air pollution death rate has fallen by almost 50 percent since 1990.

University of Oxford economist Max Roser and researcher Hannah Ritchie show in Our World in Data that “since 1990 the number of deaths per 100,000 people have nearly halved,” declining from 111.28 to 63.82.

Fourth, even the Cassandras acknowledge that any impact on the nation’s economy is likely to be minimal.

The National Bureau of Economic Research estimated in 2019 that if the earth’s temperature rises by 0.01 degrees Celsius per year through 2100, total U.S. GDP in 2100 will be 1.88 percent lower in 2100 than it would otherwise be.

Yet based on the Congressional Budget Office’s estimate of a 1.4 percent annual real long-term potential labor force productivity growth rate, the nation’s per person GDP will be about 204 percent higher by 2100. With the reduction that NBER estimates based on global warming, GDP per person would be an almost indistinguishable 200 percent higher.

The NBER’s extreme case projection that if the earth’s temperature rises by 0.04 degrees Celsius per year through 2100 (five times the actual rate of increase since 1880), total U.S. GDP will be 10.52 percent lower in 2100 than it would otherwise be, similarly would leave GDP per person about 172 percent higher.

In other words, after taking account of the supposedly harmful impact of global warming, U.S. income per person in 2100 will be about triple today’s level.

See Also Crunching Climate $$$

Don’t swallow the big lie. Check the data. Global warming has not been harmful and presents no danger to future generations.

More Data Against Claims of a Climate Problem: Eleven Empty Climate Claims

From a previous post, below are a series of rebuttals of the 11 most common climate alarmists’ claims such as those made in the recently released Fourth National Climate Assessment Report.[2] The authors of these rebuttals are all recognized experts in the relevant fields.  H/T Joseph D’Aleo for compiling work by many experts at his website ACRESEARCH Fact Checking Climate Claims.  Excerpts in italics with my bolds.

For each alarmist claim, a summary of the relevant rebuttal is provided below along with a link to the full text of the rebuttal, which includes the names and the credentials of the authors of each rebuttal.

Claim: Heat Waves are increasing at an alarming rate and heat kills.
Fact:  They have been decreasing since the 1930s in the U.S. and globally.

There has been no detectable long-term increase in heat waves in the United States or elsewhere in the world. Most all-time record highs here in the U.S. happened many years ago, long before mankind was using much fossil fuel. Thirty-eight states set their all-time record highs before 1960 (23 in the 1930s!). Here in the United States, the number of 100F, 95F and 90F days per year has been steadily declining since the 1930s. The Environmental Protection Agency Heat Wave Index confirms the 1930s as the hottest decade.

Days over 95F vs. CO2Detailed Rebuttal and Authors: Heat Waves (08/19/19)

Claim: Global warming is causing more hurricanes and stronger hurricanes.
Fact:  Hurricane activity is flat to down since 1900, landfalls in the US are declining

The long-term linear trend in the number and intensity of global hurricane activity has remained flat or down. Hurricane activity does vary year-to-year and over longer periods as short-term ocean cycles like El Nino/La Nina and multidecadal cycles in the Pacific (PDO) and Atlantic (AMO) ocean temperature regimes favor changes in activity levels and some basins over others.

Credible data show this is true despite much better open ocean detection than before the 1960s when many short-lived storms at sea would have been missed as there were no satellites, no aircraft reconnaissance, no radar, no buoys and no automated weather stations.


Detailed Rebuttal and Authors: AC Rebuttal Hurricanes (10/19/19).

Claim: Global warming is causing more and stronger tornadoes.
Fact:  The number of strong tornadoes have declined over the last half century

Tornadoes are failing to follow “global warming” predictions. Strong tornadoes have seen a decline in frequency since the 1950s. The years 2012, 2013, 2014, 2015 and 2016 all saw below average to near record low tornado counts in the U.S. since records began in 1954. 2017 rebounded only to the long-term mean. 2018 ranked well below the 25thpercentile. Tornadoes increased this spring as extreme cold and late snow clashed with southeast warmth to produce a series of strong storms with heavy rains and severe weather including tornadoes. May ranked among the biggest months and the season rebounded after 7 quiet years above the 50th percentile.

Detailed Rebuttal and Authors: AC Rebuttals Tornadoes (08/20/19)

Claim: Global warming is increasing the magnitude and frequency of droughts and floods.
Fact: Droughts and floods have not changed since we’ve been using fossil fuels

Our use of fossil fuels to power our civilization is not causing droughts or floods. NOAA found there is no evidence that floods and droughts are increasing because of climate change.

The number, extend or severity of these events does increase dramatically for a brief period of years at some locations from time to time but then conditions return to more normal. This is simply the long-established constant variation of weather resulting from a confluence of natural factors.

Detailed Rebuttal and Authors: AC Rebuttals Droughts and Floods (08/22/19

Claim: Global Warming has increased U.S. Wildfires.
Fact: Wildfires have been decreasing since 1800s. The increase in damage in recent years is due to population growth in vulnerable areas and poor forest management.

Wildfires are in the news almost every late summer and fall. The National Interagency Fire Center has recorded the number of fires and acreage affected since 1985. This data show the number of fires trending down slightly, though the acreage burned had increased before leveling off over the last 20 years.

The NWS tracks the number of days where conditions are conducive to wildfires when they issue red-flag warnings. It is little changed.

Detailed Rebuttal and Authors: AC Rebuttal Wildfires 080719

Claim: Global warming is causing snow to disappear.
Fact: Snowfall is increasing in the fall and winter in the Northern Hemisphere and North America with many records being set.

This is one claim that has been repeated for decades even as nature showed very much the opposite trend with unprecedented snows even in the big coastal cities. Every time they repeated the claim, it seems nature upped the ante more.

Alarmists have eventually evolved to crediting warming with producing greater snowfall, because of increased moisture but the snow events in recent years have usually occurred in colder winters with high snow water equivalent ratios in frigid arctic air.

Detailed Rebuttal and Authors: AC Rebuttal Snow (09/19/19)

Claim: Global warming is resulting in rising sea levels as seen in both tide gauge and satellite technology.
Fact: The rate of global sea level rise on average has fallen by 40% the last century. Where it is increasing – local factors such as land subsidence are to blame.

This claim is demonstrably false. It really hinges on this statement: “Tide gauges and satellites agree with the model projections.” The models project a rapid acceleration of sea level rise over the next 30 to 70 years. However, while the models may project acceleration, the tide gauges clearly do not.

All data from tide gauges in areas where land is not rising or sinking show instead a steady linear and unchanging sea level rate of rise from 4 up to 6 inches/century, with variations due to gravitational factors. It is true that where the land is sinking as it is in the Tidewater area of Virginia and the Mississippi Delta region, sea levels will appear to rise faster but no changes in CO2 emissions would change that.

Detailed Rebuttal and Authors: Rebuttal – Sea Level (01/18/19)

Claim: Arctic, Antarctic and Greenland ice loss is accelerating due to global warming.
Fact: The polar ice varies with multidecadal cycles in ocean temperatures. Current levels are comparable to or above historical low levels

Satellite and land surface temperature records and sea surface temperatures show that both the East Antarctic Ice Sheet and the West Antarctic Ice Sheet are cooling, not warming and glacial ice is increasing, not melting. Satellite and land surface temperature measurements of the southern polar area show no warming over the past 37 years. Growth of the Antarctic ice sheets means the sea level rise is not being caused by melting of polar ice and, in fact, is slightly lowering the rate of rise. Satellite Antarctic temperature records show 0.02C/decade cooling since 1979. The Southern Ocean around Antarctica has been getting sharply colder since 2006. Antarctic sea ice is increasing, reaching all-time highs. Surface temperatures at 13 stations show the Antarctic Peninsula has been sharply cooling since 2000.

Arctic temperature records show that the 1920s and 1930s were warmer than in the 2000s. Official historical fluctuations of Arctic sea ice begin with the first satellite images in 1979. That happens to coincide with the end of the recent 1945–1977 global cold period and the resulting maximum extent of Arctic sea ice. During the warm period from 1978 until recently, the extent of sea ice has diminished, but increased in the past several years. The Greenland ice sheet has also grown with cooling after an anomalously warm 2012.

Detailed Rebuttal and Authors: AC Rebuttal Arctic, Antarctic and Greenland (05/19/19)

Claim: Global warming responsible for record July warmth in Alaska.
Fact:  Alaska July 2019 heat records resulted from a warm North Pacific and reduced ice in the Bering Sea late winter due to strong storms. The opposite occurred with record cold in 2012.

Alaska climate (averages and extremes) varies over time but the changes can be explained by natural variability in the North Pacific Ocean, which controls the climate regime in downstream land areas. These ocean temperature regimes (modes of the Pacific Decadal Oscillation or PDO) improves season-to-season and year-to-year climate forecasts for North America because of its strong tendency for multi-season and multi-year persistence. The PDO correlates well with tendencies for El Nino and La Nina, which have a major impact on Alaska and much of North America.

See Rebuttal: AC Rebuttal- Alaska’s hot July caused by global warming (08/21/19)

Claim: Rising atmospheric CO2 concentrations are causing ocean acidification, which is catastrophically harming marine life.
Fact: When life is considered, ocean acidification is often found to be a non-problem, or even a benefit.

The ocean chemistry aspect of the ocean acidification hypothesis is rather straightforward, but it is not as solid as it is often claimed to be. For one thing, the work of a number of respected scientists suggests that the drop in oceanic pH will not be nearly as great as the IPCC and others predict. And, as with all phenomena involving living organisms, the introduction of life into the analysis greatly complicates things. When a number of interrelated biological phenomena are considered, it becomes much more difficult, if not impossible, to draw such sweeping negative conclusions about the reaction of marine organisms to ocean acidification. Quite to the contrary, when life is considered, ocean acidification is often found to be a non-problem, or even a benefit. And in this regard, numerous scientific studies have demonstrated the robustness of multiple marine plant and animal species to ocean acidification—when they are properly performed under realistic experimental conditions.

Detailed Rebuttal and Author: AC Rebuttal – Ocean Acidification (02/04/19)

Claim: Carbon pollution is a health hazard.
Fact: Carbon dioxide (CO2) is an odorless invisible trace gas that is plant food and it is essential to life on the planet. It is not a pollutant.

The term “carbon pollution” is a deliberate, ambiguous, disingenuous term, designed to mislead people into thinking carbon dioxide is pollution. It is used by the environmentalists to confuse the environmental impacts of CO2 emissions with the impact of the emissions of unwanted waste products of combustion. The burning of carbon-based fuels (fossil fuels – coal, oil, natural gas – and biofuels and biomass) converts the carbon in the fuels to carbon dioxide (CO2), which is an odorless invisible gas that is plant food and it is essential to life on the planet.
Detailed Rebuttal and Authors: AC Rebuttal Health Impacts (02/04/19)

Claim: CO2-induced climate change is threatening global food production and harming natural ecosystems.
Fact: The vitality of global vegetation in both managed and unmanaged ecosystems is better off now than it was a hundred years ago, 50 years ago, or even a mere two-to-three decades ago thanks in part to CO2.

Such claims are not justified; far from being in danger, the vitality of global vegetation in both managed and unmanaged ecosystems is better off now than it was a hundred years ago, 50 years ago, or even a mere two-to-three decades ago.

With respect to managed ecosystems (primarily the agricultural enterprise), yields of nearly all important food crops have been rising for decades (i.e., the Green Revolution). Reasons for these increases are manifold, but they have mainly occurred in response to continuing advancements in agricultural technology and scientific research that have expanded the knowledge or intelligence base of farming (e.g., fertilizers, pesticides, irrigation, crop selection and breeding, computers, machinery and other devices).

Spatial pattern of trends in Gross Primary Production (1982- 2015). Source: Sun et al. 2018.

Detailed Rebuttal and Authors: AC Rebuttal Agriculture and NaturalEcosystems_Idso020619 (1)

Conclusion:

The well-documented invalidation of the “three lines of evidence” upon which EPA attributes global warming to human -caused CO2 emissions breaks the causal link between such CO2 emissions and global warming.

This in turn necessarily breaks the causal chain between CO2 emissions and the alleged knock-on effects of global warming, such as loss of Arctic ice, increased sea level, and increased heat waves, floods, droughts, hurricanes, tornadoes, etc. These alleged downstream effects are constantly cited to whip up alarm and create demands for ever tighter CO2 regulation. EPA explicitly relied on predicted increases in such events to justify the Endangerment Finding supporting its Clean Power Plan. But as shown above, there is no evidence to support such claims, and copious empirical evidence that refutes them.

Disunity Over Going Green

Joel Kotkin writes at Real Clear Energy The Green Civil War. Excerpts in italics with my bolds and images.

Like many contemporary social movements—#metoo, Black Lives Matter, the Women’s March—the environmental lobby has tended to create an atmosphere of unanimity. In its struggle to win public and elite opinion, it has frequently evoked “science” as something settled and immutable, warning that those who dissent are either self-serving or seriously deranged.

Yet in recent months, there has been growing criticism about the current green orthodoxy, including from people long associated with environmental causes. This has been most widely seen in the strange case of the Michael Moore–produced Planet of Humans, which exposes the rapacious profit-seeking and gratuitous environmental damage caused by the renewable energy industry.

Critics have attempted to get Moore’s film de-platformed, and the green establishment has pressured distributors not to take the film. Such censorious behavior is increasingly common among the greens. Some veteran climate scientists—such as Roger Pielke and Judith Curry, Greenpeace founder Patrick Moore, and former members of the UN International Panel on Climate Change—have been demonized and marginalized for deviating from what Curry has described as an overly “monolithic” approach to the issue of climate change. Some political leaders even seem ready to take dissenters to court in an effort to ban their ideas by legal means. Not only energy companies but think tanks and dissident scientists have been targeted for criminal prosecution. These tactics are all too reminiscent of the medieval Inquisition.

The Green War on the Working Class

Moore’s apostasy may be better known but lacks the breadth of Michael Shellenberger’s new book, Apocalypse Never. A green zealot from his high school years, the Berkeley-based Shellenberger has worked on protecting habitats for endangered species and has battled climate change. His book, like Moore’s movie, exposes the hypocrisy of the green elite but, importantly, offers a more hopeful approach than Moore’s Malthusian worldview.

Like Moore, Shellenberger has become utterly disillusioned with the self-serving and often counterproductive policies pushed by the green lobby. He demonstrates how green policies backed by oligarch-funded nonprofits have often worked against the economic interests of people in Africa, Southeast Asia, and South America, often leaving them with little recourse but to pillage their own natural environments.

Shellenberger blasts green nonprofits for blocking new energy development—dams, gas plants, pipelines—in these countries. Such actions may seem noble enough to the rich of the West, but it slows the manufacturing growth that could allow these countries to become rich enough to accommodate such things as habitat preservation. People working in textile or garment plants need not rely on the jungle for their survival, reducing the need to consume its bounty.

“Rainforests in the Amazon and elsewhere in the world can only be saved if the need for economic development is accepted, respected, and embraced,” Shellenberger states. “By opposing many forms of economic development in the Amazon, particularly the most productive forms, many environmental NGOs, European governments, and philanthropies have made the situation worse.”

Green plans to raise energy prices, eliminate cars, and ban fossil fuel development also have stirred fierce opposition from the working class, whether in pro-Trump middle America, or among France’s gilets jaune. But it’s not just the proverbial angry white men. In California, some 200 local civil rights leaders have filed lawsuits against the state’s regulators, arguing that the state’s climate policies are essentially discriminatory toward poor people and minorities.

Challenging Religious Orthodoxy

Even before Black Lives Matter, mainstream American journalism was being transformed into an extended-stay resort for the woke. Shellenberger calls out “stealth environmental activists working as journalists” who report the most drastic environmental projections while ignoring any contrary perspectives. “Much of what people are being told about the environment, including the climate, is wrong, and we desperately need to get it right,” he insists, suggesting that he is “fed up with the exaggeration, alarmism, and extremism that are the enemy of a positive, humanistic, and rational environmentalism.”

Shellenberger places his hopes on “competition from outside traditional news media institutions,” having seen the gullibility of most reporters. For decades, they have embraced notions, first seen in Paul Ehrlich’s 1968 book, The Population Bomb, that humanity would “breed ourselves to extinction” if birthrates were not severely curtailed. Reporters also widely hailed the Club of Rome report in 1972, which took a similar apocalyptic approach, predicting massive shortages of natural resources unless there was a shift to lower birthrates, slower economic growth, less material consumption, and, ultimately, less social mobility.

Many of these apocalyptic predictions, like those in the Middle Ages, proved exaggerated or even plain wrong. Contrary to environmentalist dogma from the 1970s, natural resources, including energy and food, did not run out but became more available than anyone expected. So why the constant hyping and hysteria? Because what Shellenberger calls “the apocalyptic environmental tradition” demands it.

In a way that perhaps only someone bitten by the green bug could understand, Shellenberger labels environmentalism as “the dominant secular religion of the educated, upper-middle-class elite in most developed and many developing nations.” This applies, he reports, not only to seemingly deranged cults like Britain’s Extinction Rebellion but also to august environmental groups like the Sierra Club or Friends of the Earth. Christianity offered guidance for how one should live and conduct one’s personal affairs in a manner pleasing to God, but the green movement seeks to steer people toward a life in better harmony with nature.

Like medieval Catholicism, the green faith foresees impending doom caused by human activity; human sin was the primary reason for the world’s problems in medieval times, and has been rediscovered by environmentalists. “Apocalyptic environmentalism gives people a purpose: to save the world from climate change, or some other environmental disaster,” Shellenberger writes. “It provides people with a story that casts them as heroes“.”

Needed: A New Human-Centered Approach to the Environment

Perhaps what is most revolutionary about Shellenberger’s book is his call for a new, more human-centered, environmentalism. In contrast to the green movement’s jihad against material progress, he suggests that only by making people more affluent will they be able to afford the environmental redress that the planet, in fact, needs.

Rather than battle industrialism, greens need to appreciate what technological progress has done for the environment. The development of plastics helped reduce demand for ivory, hawksbill turtles, whale oil, and the despoiling of old forests. Dealing pragmatically, as opposed to religiously, with environmental concerns, means accepting the reality that some forms of efficient energy production, such as natural gas or nuclear, need to be part of a cleaner future. “It is only by embracing the artificial that we can save what’s natural,” he states.

The key to environmental success lies in affluence. “Richer countries are more resilient,” he says, quoting MIT climate scientist Kerry Emanuel, “so let us focus on making people richer and more resilient.” Countries like the United States, the United Kingdom, and particularly Scandinavia become cleaner, in large part, because they can afford to do so and also must respond to popular pressures. Poor autocratic and officially socialist states, like those of the former Soviet bloc and China, did not face the same pressures for a cleaner environment.

In the future, to succeed, environmental policy has to consider human concerns, particularly those of the working and middle classes. It needs not only to “protect the natural environment but also to achieve the goal of universal prosperity.” Thus Shellenberger speaks of “a positive, humanistic, and rational environmentalism.” Like any movement in a still-democratic society, he suggests, environmentalists can win over the population not by terrorizing them but by showing that we can protect nature without stomping out all natural human aspirations.

When PC Backfires

The classical criticism of liberalism is mistaking right thinking for right action, IOW confusing theology with ethical behavior.  For a true liberal, stating the right answer resolves an issue.  Those who aren’t ideologues realize that actions speak louder than words, or as Texans say:  “Money Talks, BS Walks,” i.e. put up or shut up.

Political Correctness is the powerful current manifestation of liberal mistaken morality.  Today come reports demonstrating the disconnect between words and accountability.

Example #1: A mayor in Washington state changed her mind about the BLM protests when she was damaged personally.  Washington state mayor now calls BLM protests ‘domestic terrorism’ after her home vandalized  Excerpts in italics with my bolds.

A Washington state mayor was fine with the Black Lives Matter protests that followed George Floyd’s death in police custody.

But that was until vandals damaged her home, according to reports.

Now, Mayor Cheryl Selby of Olympia refers to the protests as “domestic terrorism,” according to The Olympian.

“I’m really trying to process this,” Selby told the newspaper Saturday, after the rioters’ Friday night spree left her front door and porch covered with spray-painted messages. “It’s like domestic terrorism. It’s unfair.

Earlier this month, Selby issued a statement saying Olympia would not impose a curfew on protesters demonstrating against Floyd’s death.

“Let me be clear: The City of Olympia supports the peaceful protests that highlight the racial injustices black people continue to endure at the hands of police in the United States.”

Olympia, she said, was “not without sin in this matter.”

Example #2: Another BLM supporter, ESPN writer Chris Martin Palmer, who commented “Burn it all down,” when retweeting a photo of a Minneapolis building in flames in late May, had a different reaction when rioters came close to his house, The Sporting News reported.

“Get these animals TF out of my neighborhood,” Palmer wrote. “Go back to where you live.”

Example #3:  The Facts in Rayshard Brooks Case Don’t Point to Murder

Michael Stern writes at USA Today:

From the horrifying flashpoint of Floyd’s killing came weeks of cops punching, gassing and shooting peaceful protesters and journalists. Then, on Friday night, a white Atlanta police officer shot and killed a Black man in a Wendy’s parking lot after an altercation. It took less than 48 hours for the wildfire of racism allegations to spread, for Atlanta’s mayor to fire the officer,for the police chief to resign, and for an angry mob to seek vindication by burning the hamburger restaurant to the ground.

But not every white officer who shoots an African American man is motivated by racism, and not every police shooting is a crime. Facts matter. Here are the facts leading up to the shooting. 

Rayshard Brooks was killed after resisting arrest, attacking two police officers, taking an officer’s Taser and shooting it at a police officer. The decision by the Times’ editorial board to intentionally omit this last fact is damning proof of its effort to create a narrative that serves a social agenda, despite evidence that supports a contrary conclusion.

That a man died is tragic. But the protests, celebrity outcry and general media capitulation that equates Brooks’ death with that of George Floyd, and countless other African Americans who were murdered at the hands of flagrant police misconduct, is wrong.

In a headline reminiscent of the National Enquirer, the Los Angeles Times ran an editorial Tuesday titled: “Atlanta police killed a Black man for being drunk at Wendy’s.” No. Mr. Brooks was not killed for being drunk.

Example #4: A Backlash Against Democratic Control of Cities?

Yet in the midst of the national upheaval over police brutality and claims of systemic racism, it also highlights the fact that Democrats have been in control of nearly every major urban center in America for decades. It’s worth looking at a list:

  • Atlanta has been controlled by Democrats for the past 140 years.
  • Democrats, including Nancy Pelosi’s father and eldest brother, have held the mayor’s office in Baltimore for all but eight of the last 89 years.
  • In Chicago, Democrats have been in charge of the nation’s third-largest city exclusively since 1931.
  • Detroit has been run continuously by Democrats since 1962, including 39 years of stewardship by African-American mayors between 1974 and 2013.
  • In Los Angeles, 13 of the past 15 mayoral terms have been held by Democrats. Their control of the city began in 1961 and was interrupted by Republican Dick Riordan’s two terms from 1993-2001.
  • Democrats have held control in Philadelphia since 1952.
  • City Hall in Seattle was, by design, nonpartisan until 1990 when three-term incumbent Charles Royer left the mayor’s office. The year before, Seattle was named one of the “best managed cities in the nation.” Since then, Democrats have run the city exclusively, including through the recent turmoil and the uproar resulting from the city’s first gay mayor, Ed Murray, resigning after multiple allegations of child sex abuse.
  • Finally, there is New York, where Rudy Giuliani’s two terms as mayor from 1993-2001 followed by Michael Bloomberg’s 12-year tenure as a Democrat-turned-Republican-turned-Independent gives the city some claim to bipartisan management over the last three decades. Even so, Democrats have long had a lock on the City Council and the place was run exclusively by Democrats for the 25 years between 1969 and 1994. For the last six years it has been helmed by Bill de Blasio, one of the most outspoken progressive Democrats in America.

Whatever problems exist today in America’s major cities, and in their respective police forces, they are not bipartisan in nature. Republicans have been shut out of the governing apparatus of these cities and excluded from any serious discussion of policy solutions for decades.

There is a disconnect between the Democratic Party’s rhetoric and how it governs “minority-majority” cities. This is a far bigger issue than one election and ultimately has little to do with Donald Trump. It’s about accountability — about which of the two major political parties can build a better future for those living in America’s storied, but long-troubled, urban centers.

See Also:  When a Hate Cult Took the Streets


Solar Cyles in Earth Atmosphere

H/T to Ireneusz Palmowski for pointing me to this presentation of a paper Regional and temporal variability of solar activity and galactic cosmic ray effects on the lower atmosphere circulation by S. Veretenenko and M. Ogurtsov  Advances in Space Research · February 2012.

Background

A previous post Quantifying Natural Climate Change presented a study by Dan Pangburn demonstrating that earth temperature fluctuations can be explained by oceanic and solar variations.  The oceanic factors are elaborated in numerous posts here under the category Oceans Make Climate.  The solar mechanisms are more mysterious, making it more difficult to show how solar activity influences cooler or warmer eras.  Cosmoclimatology is a theory advanced by Svensmark that draws a connection between GCRs (Galactic Cosmic Rays) and cloudiness.

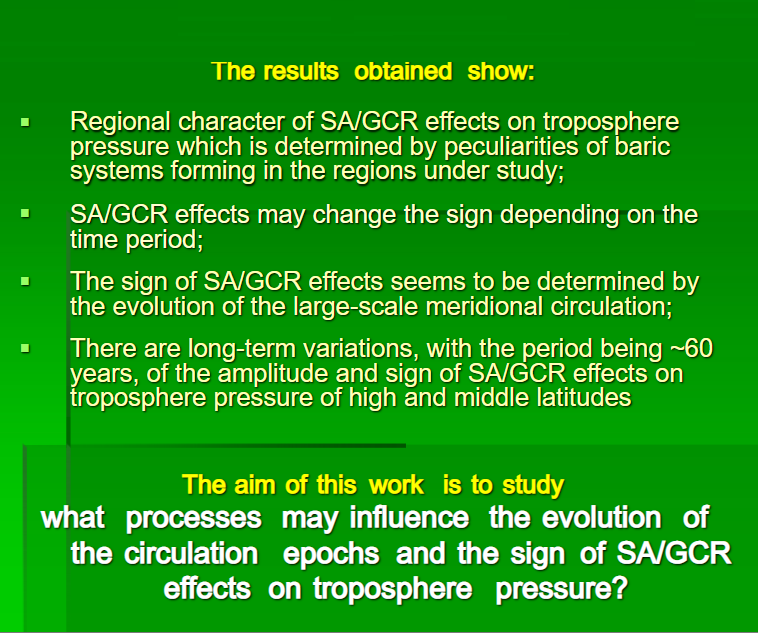
This post presents evidence from Russian scientists describing how those same Cosmic Rays (GCR) have a dramatic top-down effect on atmospheric circulation by interacting with ozone in the stratosphere.  The basic idea is that the climate effects from increasing cosmic rays vary according to Arctic polar vortex shifts from fast and strong, to weak and wavy, resulting in alternating climate epochs.

The published paper can be accessed by the linked title at the top.  The slide presentation is here.

Conclusions: In the paper three important findings are described. Text in italics with my bolds.

1. Disturbances of the lower atmosphere circulation associated with solar activity and galactic cosmic ray variations take place over the entire globe, with the processes developing in different latitudinal belts and regions being closely interconnected. The SA/GCR effects on pressure variations reveal a distinct latitudinal and regional character depending on the circulation peculiarities in the regions under study. The spatial structure of pressure variations correlated with SA/GCR variations is closely related to their influence on the main elements of the large-scale atmospheric circulation, namely on the polar vortex, planetary frontal zones and extratropical cyclones and anticyclones.

2. The temporal structure of the SA/GCR effects on pressure variations at high and middle latitudes of the Northern hemisphere is characterized by a pronounced ~60-year periodicity which is apparently related to the epochs of the large-scale atmospheric circulation. The reversals of the correlation sign between pressure and sunspot numbers were detected in the 1890s, 1920s, 1950s and in the early 1980s. The sign of the SA/GCR effects seems to depend on the evolution of meridional processes in the atmosphere which, in turn, is determined by the state of the polar vortex.

3. A mechanism of SA/GCR influences on the troposphere circulation is likely to involve changes in the evolution of the polar vortex in the stratosphere of high latitudes. Intensification of the polar vortex associated with solar activity and cosmic ray variations may contribute to the increase of temperature contrasts in planetary frontal zones and, then, to the intensification of extratropical cyclogenesis.


Comment and Further Discussion

It takes some effort to grasp the import of this research.  If I understand correctly, they looked at the impact of increasing GCRs during periods of quiet SA, and found the effects on earth atmosphere differed depending on another factor: strength or weakness of the polar vortex, which is an internal feature of the Arctic region.  At one point, the paper says:

Vangengeim–Girs classification defines three main forms of circulation: the westerly (zonal) form W, the easterly form E and the meridional form C. A distinguishing feature of the form W is the development of zonal circulation when the pressure field is characterized by small amplitude waves rapidly moving from west to east. The forms C and E are characterized by the development of meridional processes in the  atmosphere when slowly moving or stationary large-amplitude waves are observed in the pressure field.

Fig. 9. Top panel: annual frequencies of occurrence (number of days during a year) of the main forms of the large-scale circulation (20-year running averages) (a); Bottom panel: correlation coefficient R(SLP,Rz) between mean yearly values of pressure in the region of the polar vortex center and sunspot numbers for sliding 17-year periods (b) and the Fourier spectrum of the annual frequency of occurrence of the meridional circulation C (c). The vertical dotted lines indicate the moments of the correlation sign reversals.

The data in Fig. 9a show the evolution of annual frequency of occurrence (expressed as a number of days during a year) of these circulation forms. The time variation of the correlation R(SLP,Rz) in the region of the Arctic polar vortex is presented in Fig. 9b. Comparing these data, we can see that the latest reversal of the correlation sign in the early 1980s was preceded by noticeable changes in the evolution of all the circulation forms. Since the late 1970s the frequency of occurrence of the zonal form W has been increasing. The frequency of the meridional form C started increasing too, with a simultaneous decrease of the frequency of the form E.

The results presented in Fig. 9 show that the time behavior of the correlation between pressure at high and middle latitudes and SA/GCR variability depends on the evolution of meridional processes in the atmosphere. In the epochs of increasing frequency of the meridional circulation C (~1920–1950 and since the 1980s) we can see that an increase of GCR fluxes in the 11-year solar cycle is accompanied by an intensification of polar anticyclones (an increase of the troposphere pressure at polar latitudes), an intensification of extratropical cyclogenesis (a decrease of pressure at polar fronts at middle latitudes) and a weakening of the equatorial trough (an increase of pressure at low latitudes). The long-term GCR effects on extratropical cyclogenesis during these epochs are in good agreement with the GCR effects on the development of baric systems detected on the time scale of a few days.  These epochs coincide with the periods of a strong polar vortex. 

In the epochs of decreasing meridional circulation C (~1890–1920 and ~1950–1980), corresponding to a weak polar vortex, we observe the spatial distribution of the correlations between the troposphere pressure and GCR intensity with the opposite sign: an increase of GCR isaccompanied by a weakening of polar anticyclones, a weakening of extratropical cyclogenesis and an intensification of the equatorial trough.

A possible reason for these correlation reversals may be significant changes in a dynamic coupling between the troposphere and the stratosphere during the periods of a weak and strong polar vortex. According to the data of Perlwitz and Graf (2001), the stratosphere may influence the troposphere only when the polar vortex is strong. When the vortex is weak, only the troposphere influences the stratosphere. So, if GCR (or some other factor of solar activity) produce any effect in the stratosphere in the period of a strong vortex (i.e., in the period of increasing meridional circulation), this effect may be transferred to the troposphere and we can see a pronounced correlation of extratropical cyclogenesis with GCR intensity. As the strength of the vortex reveals ~60-year variations (Gudkovich et al., 2009; Frolov et al., 2009), which influence the circulation state, this can explain the detected temporal variability of the SA/GCR effects.

And thus we can appreciate the summary slide shown at the top.  It would appear that we have been in a period of weak and wavy polar vortices as well as strong GCRs (minimal solar activity),  a continuation of the epoch since 1982 (on the left). It also suggests that the ~60 year vortex cycle is due for a shift to the epoch on the right.

Sister Cities: Minneapolis and Mogadishu

I was born in St. Paul, Minnisota, so it saddens me to see the Twin Cities falling down like the Twin Towers.  How did  “failed states” come about in the USA resembling collapsed social order in places like Somalia? There are differences, of course:  Mogadishu was blown up by Islamist Jihadists, whereas Minneapolis suffers at the hands of “Woke” Jihadists, in the streets and in positions of governance. Otherwise, the disdain for unbelievers looks similar, along with the intent to separate the sheep from the goats, with the latter as the underclass, tolerated as long as they submit and take their punishment.

Anger in Mogadishu after police kill civilian in COVID-19 curfew

Protests in Somalia after fatal shooting of at least one person by police enforcing coronavirus-related restrictions.

There has been growing anger among some residents over alleged abuses by security forces, including beatings while enforcing virus-related restrictions.

Shouts of “No police, no curfew” could be heard as protesters took to the streets and damaged a police landmark at a city roundabout.

The country’s police chief on Saturday fired the commissioner in charge of security in Bondhere district where the shooting took place.

In other Somali news:

10 killed as minibus hits roadside bomb near Mogadishu ( 2 weeks earlier)

Governor killed in suicide bombing claimed by al-Shabab (3 weeks earlier)

Black pain is ours: Minneapolis Somali community rallies over Floyd killing

Somali community, being both Muslim and Black, plays unique role within protest movement

Minneapolis hosts a large Somali-American community, the biggest Somali diaspora group in the United States, according to the American Community survey in 2017.

They began coming to the US as early as the 1980s, but more emigrated in the 1990s to escape a civil war in Somalia.

Somalis began resettling in Minneapolis after securing jobs at meat-packaging plants, and have since opened businesses and established deep roots in the city.

Ali said that the community has since struggled with its identity, as many of the older generation are averse to being considered Black Americans.

Still, most of the younger Somalis who grew up in the US have aligned themselves with the Black Lives Matter movement, especially after witnessing discrimination and racism at the hands of law enforcement, she said.

Being seen as both Black and Muslim, Minneapolis resident Haji Yussuf said, sometimes means facing multiple forms of discrimination.

“Somalis are Black. So, a white cop or a bad cop doesn’t really see a difference. He sees Black, and then when he hears the name, the racism is even more pronounced,” said Yussuf, who ran for Congress before dropping out and endorsing eventual winner Congresswoman Ilhan Omar.

Ilhan Omar, the Somali-American congresswoman who represents the district where Floyd was killed, on Friday introduced a resolution alongside Black Congresswoman Ayanna Pressley condemning police brutality, racial profiling and the excessive use of force by law enforcement.

Omar calls for dismantling Minnapolis Police.

At least in the US, people vote and get the government they choose.  How remarkable in 2020 to witness elected officials preside over destruction and social division, claiming to be responsibly executing their office to serve and protect the citizenry.  Wake up and smell the smoke. You too, Seattle.


Update 2020 Divide: Producers vs. Parasites

Update June 14, 2020:  The New Face of Diversity

The silent march in Seattle on Friday shows how diversity looks according to BLM.  Those who think like us but don’t look like us are tolerated, so long as they know their place at the bottom.  Look at how the parade was organized.  From KOMO in Seattle.  In italics with my bolds;

In Seattle, marchers met at Judkins Park at 1 p.m. and start marching to Jefferson Park just after 2 p.m.

Organizers say the march was a black-led event and asked participants to respect the march procession order, starting with Black Lives Matter Seattle-King County leadership, followed by (in order) black youth, black community members, people of color, elected and appointed officials, political candidates, white allies and bicyclists.

Rosa Parks refused to ride in the back of the bus.  Should non-Blacks submit to 2nd, 3rd, or lower class citizenship?  This is pure Marxist class warfare, with no redeeming qualities, and adding segregation on top.  What is on offer is pitched street battles to throw the rascals (whites) out, destroy their monuments, place BLM leaders in power, and impose their will upon the others.

Background

In 2015 I posted on the US socio-political climate after Trump entered the contest.  Animal Farm and Climate Change.  The introduction went this way:Animal Farm2

George Orwell’s Animal Farm is a masterpiece of a simple story suggesting so many realities of societies. Among many things, it shows how a basic dichotomy mobilizes people (or creatures) for social or political action. The image above expresses the heart of the story whereby some animals took power over the others out of fear of humans.

Consider another dichotomy:    Producers Good, Parasites Bad.

Bumper Sticker

Bumper Sticker

People who are astounded by Donald Trump’s candidacy are overlooking how widely and deeply felt is this distinction between those who produce and those who take, and not only in the Tea Party but far beyond. The power arises from the emotional investment in the branding, no matter how illogical or mistaken it may be. Those who don’t feel it, don’t “get it.” Add in the envy of someone so rich he can say anything unbounded by Political Correctness, and Trump becomes a force to be reckoned with. It remains to be seen whether his followers are voters beyond being fans.

 2020 Update

Against all odds, and to his own surprise, Trump went on to win the Presidency and survive a fierce resistance from entrenched partisans who voted for his opponent.  Now that effort to unseat him is intensifying leading up to this year’s general election.  The rioting triggered by George Floyd’s death shows that the Producer/Parasite dichotomy is now overlaid with racial bigotry:  Black Lives Good/ White Lives Bad.  Premium brand items were targeted in the looting, justified by saying:  “People deserve to have nice things.”

The Parasite claim comes through the the Black Lives Matter manifesto calling for freebies.  #BlackLivesMatter movement bizarrely demands: “Reparations for…full and free access for all Black people (including undocumented and currently and formerly incarcerated people) to lifetime education…retroactive forgiveness of student loans, and support for lifetime learning programs.”  See When a Hate Cult Took the Streets

The producer/parasite divide also appeared in governors’ priorities during lockdowns:  Public Workers Essential/ Private Workers Nonessential. As some observed, knowledge workers and employees paid with tax dollars didn’t miss a check while taxpaying workers who make things were laid off. See Bad Idea: Politicians Decide Essential Business

And this gets at the heart of the contradiction between socialists’ focus on redistributing wealth vs. capitalists’ emphasis on producing wealth.  In the current meme, capitalism and its artifacts must be destroyed to make way for the people’s paradise. It is remarkable that the ideological divide is opening up at all levels,  Federal, State and City, including national policies and pandemic relief, state post-covid regulations and city policing priorities.

Another twist:  This is not your stereotypical uprising of the poor against the rich.  Ed West explains how and why upper middle class youth are in revolt against the “system” they see aligned against them.  The essay at Unherd is Why the rich are revolting. Excerpts in italics with my bolds.

The Great Awokening and the 2020 protests are the product of growing radicalisation among the upper-middle-class

That year (1968), the United States was rocked by riots, assassinations and political crisis, and half a century later, history seems to be, if not repeating itself, then certainly rhyming. Yet while there are huge differences between the 1968 and 2020 disturbances, the one continuous theme running through both uprisings, and indeed all revolutions down the years, is the prominent role of the middle class. In particular, the upper-middle-class, the haute bourgeoise, are the driving force behind revolt and disorder throughout history, especially — as with today — when they feel they have no future.

Today’s unrest involves two sections of US society, African-Americans and upper-middle-class whites, who together form the axis of the Democratic Party, but it is the latter who are far more engaged in racial activism. The “Great Awokening”, the mass movement focused on eradicating racism in America and with a quasi-religious, almost hysterical feel to it, is dominated by the upper middle class.

The rich have always paradoxically been radical, something G.K. Chesterton observed over a hundred years ago when he wrote “You’ve got that eternal idiotic idea that if anarchy came it would come from the poor. Why should it? The poor have been rebels, but they have never been anarchists: they have more interest than anyone else in there being some decent government. The poor man really has a stake in the country. The rich man hasn’t; he can go away to New Guinea in a yacht. The poor have sometimes objected to being governed badly; the rich have always objected to being governed at all. Aristocrats were always anarchists.”

The wider Great Awokening, of which the 2020 disturbances are a part, is a very elite phenomenon, with progressive activists nearly twice as likely as the average American to make more than $100,000 a year, nearly three times as likely to have a postgraduate degree, and only one-quarter as likely to be black. Likewise with the radicalisation of American academia, with the safe spaces movement most prevalent at elite colleges, where students were much more likely to disinvite speakers or express more extreme views.

Climate protesters disrupt Yale-Harvard football game. Nov. 23, 2019.

Meanwhile, the expansion of the university system has created what Russian-American academic Peter Turchin called ‘elite overproduction’, the socially dangerous situation where too many people are chasing too few elite places in society, creating “a large class of disgruntled elite-wannabes, often well-educated and highly capable… denied access to elite positions”.

So while around half of 18-year-olds are going onto college, only a far smaller number of jobs actually require a degree. Many of those graduates, under the impression they were joining the higher tier in society, will not even reach managerial level and will be left disappointed and hugely indebted. Many will have studied various activist-based subjects collectively referred to as ‘grievance studies’, so-called because they rest on a priori assumptions about power and oppression. Whether these disciplines push students towards the Left, or if it is just attending university that has this effect, people are coming out of university far more politically agitated.

This has been bubbling up for years — and then along came the coronavirus, throwing millions of people out of work, many from exactly the sort of sections most likely to cause trouble. And what makes it slightly spooky is that a few years back Turchin predicted that there would be a violent flashpoint in American politics — in 2020.

2020 Divide: Producers vs. Parasites

In 2015 I posted on the US socio-political climate after Trump entered the contest.  Animal Farm and Climate Change.  The introduction went this way:Animal Farm2

George Orwell’s Animal Farm is a masterpiece of a simple story suggesting so many realities of societies. Among many things, it shows how a basic dichotomy mobilizes people (or creatures) for social or political action. The image above expresses the heart of the story whereby some animals took power over the others out of fear of humans.

Consider another dichotomy:    Producers Good, Parasites Bad.

Bumper Sticker

Bumper Sticker

People who are astounded by Donald Trump’s candidacy are overlooking how widely and deeply felt is this distinction between those who produce and those who take, and not only in the Tea Party but far beyond. The power arises from the emotional investment in the branding, no matter how illogical or mistaken it may be. Those who don’t feel it, don’t “get it.” Add in the envy of someone so rich he can say anything unbounded by Political Correctness, and Trump becomes a force to be reckoned with. It remains to be seen whether his followers are voters beyond being fans.

 2020 Update

Against all odds, and to his own surprise, Trump went on to win the Presidency and survive a fierce resistance from entrenched partisans who voted for his opponent.  Now that effort to unseat him is intensifying leading up to this year’s general election.  The rioting triggered by George Floyd’s death shows that the Producer/Parasite dichotomy is now overlaid with racial bigotry:  Black Lives Good/ White Lives Bad.  Premium brand items were targeted in the looting, justified by saying:  “People deserve to have nice things.”

The Parasite claim comes through the the Black Lives Matter manifesto calling for freebies.  #BlackLivesMatter movement bizarrely demands: “Reparations for…full and free access for all Black people (including undocumented and currently and formerly incarcerated people) to lifetime education…retroactive forgiveness of student loans, and support for lifetime learning programs.”  See When a Hate Cult Took the Streets

The producer/parasite divide also appeared in governors’ priorities during lockdowns:  Public Workers Essential/ Private Workers Nonessential. As some observed, knowledge workers and employees paid with tax dollars didn’t miss a check while taxpaying workers who make things were laid off. See Bad Idea: Politicians Decide Essential Business

And this gets at the heart of the contradiction between socialists’ focus on redistributing wealth vs. capitalists’ emphasis on producing wealth.  In the current meme, capitalism and its artifacts must be destroyed to make way for the people’s paradise. It is remarkable that the ideological divide is opening up at all levels,  Federal, State and City, including national policies and pandemic relief, state post-covid regulations and city policing priorities.

Another twist:  This is not your stereotypical uprising of the poor against the rich.  Ed West explains how and why upper middle class youth are in revolt against the “system” they see aligned against them.  The essay at Unherd is Why the rich are revolting. Excerpts in italics with my bolds.

The Great Awokening and the 2020 protests are the product of growing radicalisation among the upper-middle-class

That year (1968), the United States was rocked by riots, assassinations and political crisis, and half a century later, history seems to be, if not repeating itself, then certainly rhyming. Yet while there are huge differences between the 1968 and 2020 disturbances, the one continuous theme running through both uprisings, and indeed all revolutions down the years, is the prominent role of the middle class. In particular, the upper-middle-class, the haute bourgeoise, are the driving force behind revolt and disorder throughout history, especially — as with today — when they feel they have no future.

Today’s unrest involves two sections of US society, African-Americans and upper-middle-class whites, who together form the axis of the Democratic Party, but it is the latter who are far more engaged in racial activism. The “Great Awokening”, the mass movement focused on eradicating racism in America and with a quasi-religious, almost hysterical feel to it, is dominated by the upper middle class.

The rich have always paradoxically been radical, something G.K. Chesterton observed over a hundred years ago when he wrote “You’ve got that eternal idiotic idea that if anarchy came it would come from the poor. Why should it? The poor have been rebels, but they have never been anarchists: they have more interest than anyone else in there being some decent government. The poor man really has a stake in the country. The rich man hasn’t; he can go away to New Guinea in a yacht. The poor have sometimes objected to being governed badly; the rich have always objected to being governed at all. Aristocrats were always anarchists.”

The wider Great Awokening, of which the 2020 disturbances are a part, is a very elite phenomenon, with progressive activists nearly twice as likely as the average American to make more than $100,000 a year, nearly three times as likely to have a postgraduate degree, and only one-quarter as likely to be black. Likewise with the radicalisation of American academia, with the safe spaces movement most prevalent at elite colleges, where students were much more likely to disinvite speakers or express more extreme views.

Climate protesters disrupt Yale-Harvard football game. Nov. 23, 2019.

Meanwhile, the expansion of the university system has created what Russian-American academic Peter Turchin called ‘elite overproduction’, the socially dangerous situation where too many people are chasing too few elite places in society, creating “a large class of disgruntled elite-wannabes, often well-educated and highly capable… denied access to elite positions”.

So while around half of 18-year-olds are going onto college, only a far smaller number of jobs actually require a degree. Many of those graduates, under the impression they were joining the higher tier in society, will not even reach managerial level and will be left disappointed and hugely indebted. Many will have studied various activist-based subjects collectively referred to as ‘grievance studies’, so-called because they rest on a priori assumptions about power and oppression. Whether these disciplines push students towards the Left, or if it is just attending university that has this effect, people are coming out of university far more politically agitated.

This has been bubbling up for years — and then along came the coronavirus, throwing millions of people out of work, many from exactly the sort of sections most likely to cause trouble. And what makes it slightly spooky is that a few years back Turchin predicted that there would be a violent flashpoint in American politics — in 2020.

Media Blowing on Embers of Covid Fear

Alex Berenson explains in a twitter thread (here). Text in italics with my bolds

1/ This panic is likely to prove even more embarrassing than previous panics. Here’s why: the media is both confused and conflating several different data points in an effort to stir hysteria. (Stop me if you’ve heard this before.)

What do I mean?
2/ So: you’ve heard positive tests are up in several states. True. The media refers to these as “cases,” as if positive tests have clinical significance by themselves. They do not. The vast majority of people with positive tests do not become ill enough to need hospitalization

3/ Much less intensive care or ventilator support. For people under 50, this is true in the extreme. But the daily age distribution of positive tests is rarely if ever supported…

4/ Second: you’ve heard overall hospitalizations are up in some states. This is also true. THIS IS A FEATURE, NOT A BUG. Overall hospitalizations are rising because people are returning to hospitals for elective (and in some cases very necessary) surgeries that were postponed

5/ Now, in some of these states COVID-related hospitalizations have also risen (though they make up a tiny fraction of overall hospitalizations). Scary, right?

No. When people go to the hospital for elective surgeries they are now routinely tested for COVID...

6/ Whether or not they are symptomatic. Hospitals have financial and legal as well as medical incentives to do this. IF THEY ARE POSITIVE, hospitals will report them as COVID patients (since, technically, they are), EVEN IF THEY HAVE NO COVID SYMPTOMS.

7/ This fact accounts for the bizarre disconnect between the fact the number of people going to emergency rooms with influenza-like or COVID-like symptoms is NOT rising (and remains in the low single digits) even in states reporting more hospitalizations…

8/ As well as the fact that fewer hospitalized cases are now progressing to ventilators (I can’t swear to this in every state, but it appears to be a trend)…

9/ And the fact that deaths no longer seem to have any relationship to case counts in many states (true even accounting for the fact that deaths lag).

The question you should be asking yourself: why aren’t Europe and Asia seeing post-lockdown spikes if this trend is real?

10/ And don’t say masks. Masks are not routine in Europe. So either COVID is somehow different post-lockdown in Europe (and different in different states, too)… or this is just one last gasp of panic porn.

And if you want confirmation from epidemiologists, here Facts about Covid-19 from Swiss Policy Research.

Fully referenced facts about Covid-19, provided by experts in the field, to help our readers make a realistic risk assessment. (Regular updates below)

“The only means to fight the plague is honesty.” (Albert Camus, 1947)

Overview

1.According to the latest immunological and serological studies, the overall lethality of Covid-19 (IFR) is about 0.1% and thus in the range of a strong seasonal influenza (flu).

2. Even in global “hotspots”, the risk of death for the general population of school and working age is typically in the range of a daily car ride to work. The risk was initially overestimated because many people with only mild or no symptoms were not taken into account.

3. Up to 80% of all test-positive persons remain symptom-free. Even among 70-79 year olds, about 60% remain symptom-free. Over 95% of all persons develop at most moderate symptoms.

4. Up to 60% of all persons may already have a certain cellular background immunity to Covid19 due to contact with previous coronaviruses (i.e. common cold viruses).

5. The median or average age of the deceased in most countries (including Italy) is over 80 years and only about 4% of the deceased had no serious preconditions. The age and risk profile of deaths thus essentially corresponds to normal mortality.

6. In many countries, up to two thirds of all extra deaths occurred in nursing homes, which do not benefit from a general lockdown. Moreover, in many cases it is not clear whether these people really died from Covid19 or from weeks of extreme stress and isolation.

7. Up to 30% of all additional deaths may have been caused not by Covid19, but by the effects of the lockdown, panic and fear. For example, the treatment of heart attacks and strokes decreased by up to 60% because many patients no longer dared to go to hospital.

8. Even in so-called “Covid19 deaths” it is often not clear whether they died from or with coronavirus (i.e. from underlying diseases) or if they were counted as “presumed cases” and not tested at all. However, official figures usually do not reflect this distinction.

9. Many media reports of young and healthy people dying from Covid19 turned out to be false: many of these young people either did not die from Covid19, they had already been seriously ill (e.g. from undiagnosed leukaemia), or they were in fact 109 instead of 9 years old. The claimed increase in Kawasaki disease in children also turned out to be false.

10. The normal overall mortality per day is about 8000 people in the US, about 2600 in Germany and about 1800 in Italy. Influenza mortality per season is up to 80,000 in the US and up to 25,000 in Germany and Italy. In several countries Covid19 deaths remained below strong flu seasons.

11. Regional increases in mortality can occur if there is a collapse in the care of the elderly and sick as a result of infection or panic, or if there are additional risk factors such as severe air pollution. Special regulations for dealing with the deceased sometimes led to additional bottlenecks in funeral or cremation services.

12. In countries such as Italy and Spain, and to some extent the UK and the US, hospital overloads due to strong flu waves are not unusual. In addition, up to 15% of doctors and health workers are now being put into quarantine, even if they develop no symptoms.

13. The often shown exponential curves of “corona cases” are misleading, as the number of tests also increased exponentially. In most countries, the ratio of positive tests to tests overall (i.e. the positive rate) remained constant at 5% to 25% or increased only slightly. In many countries, the peak of the spread was already reached well before the lockdown.

14. Countries without curfews and contact bans, such as Japan, South Korea or Sweden, have not experienced a more negative course of events than other countries. Sweden was even praised by the WHO and now benefits from higher immunity compared to lockdown countries.

15. The fear of a shortage of ventilators was unjustified. According to lung specialists, the invasive ventilation (intubation) of Covid19 patients, which is partly done out of fear of spreading the virus, is in fact often counterproductive and damaging to the lungs.

16. Contrary to original assumptions, various studies have shown that there is no evidence of the virus spreading through aerosols (i.e. tiny particles floating in the air) or through smear infections (e.g. on door handles or smartphones). The main modes of transmission are direct contact and droplets produced when coughing or sneezing.

17. There is also no scientific evidence for the effectiveness of face masks in healthy or asymptomatic individuals. On the contrary, experts warn that such masks interfere with normal breathing and may become “germ carriers”. Leading doctors called them a “media hype” and “ridiculous”.

18. Many clinics in Europe and the US remained strongly underutilized or almost empty during the Covid19 peak and in some cases had to send staff home. Numerous operations and therapies were cancelled, including many cancer screenings and organ transplants.

19. Several media were caught trying to dramatize the situation in hospitals, sometimes even with manipulative images and videos. In general, the unprofessional reporting of many media maximized fear and panic in the population.

20. The virus test kits used internationally are prone to errors and can produce false positive and false negative results. Moreover, the official virus test was not clinically validated due to time pressure and may sometimes react positive to other coronaviruses.

21. Numerous internationally renowned experts in the fields of virology, immunology and epidemiology consider the measures taken to be counterproductive and recommend rapid natural immunisation of the general population and protection of risk groups.

22. At no time was there a medical reason for the closure of schools, as children hardly ever transmit the virus or fall ill with it themselves. There is also no medical reason for small classes, masks or ‘social distancing’ rules in schools.

23. The claim that only severe Covid-19 but not influenza may cause venous thrombosis and pulmonary (lung) embolism is not true, as it has been known for 50 years that severe influenza greatly increases the risk of thrombosis and embolism, too.

24. Several medical experts described vaccines against coronaviruses as unnecessary or even dangerous. Indeed, the vaccine against the so-called swine flu of 2009, for example, led to sometimes severe neurological damage and lawsuits in the millions.

25. The number of people suffering from unemployment, depressions and domestic violence as a result of the measures has reached historic record values. Several experts predict that the measures will claim more lives than the virus itself. According to the UN millions of people around the world may fall into absolute poverty and famine.

26. NSA whistleblower Edward Snowden warned that the “corona crisis” will be used for the massive and permanent expansion of global surveillance. The renowned virologist Pablo Goldschmidt spoke of a “global media terror” and “totalitarian measures”. Leading British virologist professor John Oxford spoke of a “media epidemic”.

27. More than 500 scientists have warned of an “unprecedented surveillance of society” through problematic apps for “contact tracing”. In some countries, such “contact tracing” is already carried out directly by the secret service. In several parts of the world, the population is already being monitored by drones and facing serious police overreach.

28. A 2019 WHO study on public health measures against pandemic influenza found that from a medical perspective, “contact tracing” is “not recommended in any circumstances.

See also: Pandemonia Funnies Madebyjimbob