Negotiators from across the globe will gather in Baku, Azerbaijan, for the twenty-ninth annual UN climate change conference on November 11. COP29 marks the midpoint of the “COP Presidencies Troika,” a collaborative effort between the United Arab Emirates (UAE, host to COP28) and Brazil (host to COP30 in 2025) aimed at accelerating progress toward the 1.5°C goal. Unlike COP28 in Dubai last year, which hosted a record hundred thousand attendees, COP29 will be smaller, with Baku expected to host around fifty thousand participants.
The selection of Azerbaijan as the host country has raised concerns about the credibility and integrity of the COP process. COP29 marks the third time a significant fossil fuel-producing country has hosted the conference, and the second time in two years. Azerbaijani President Ilham Aliyev has announced plans to increase gas production in part to satisfy European Union (EU) demands and referred to the country’s oil and gas reserves as “a gift from God.”
What’s on the Agenda–Three Pledges Are Proposed
Reducing emissions and increasing green energy.The presidency has put forward a series of commitments for investing in renewable energy, such as a Global Energy Storage and Grids Pledge, which aims to enhance energy infrastructure and storage capabilities worldwide, an ambitious Hydrogen Declaration, and a Declaration on Reducing Methane from Organic Waste. With the Green Digital Action Declaration, COP29 leadership seeks to reduce emissions in the information and communication sectors. The agenda, however, makes no direct mention of a transition from fossil fuels.
Building climate resilience. The COP presidency has put forth a climate initiative for farmers and a declaration calling for integrated approaches to combating climate threats to water basins and ecosystems. Additionally, Baku aims to present the Initiative on Human Development for Climate Resilience, which focuses on education, skills, health, and well-being, and the COP29 Multisectoral Actions Pathways (MAP) Declaration that aims to enhance urban climate resilience.
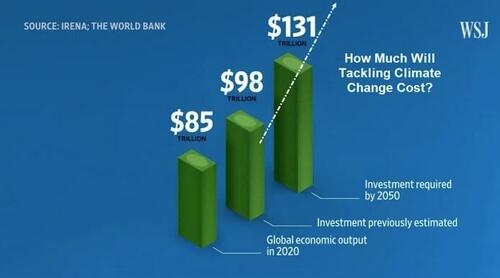
New climate finance targets. Nations are expected to replace the previous $100 billion annual commitment to developing countries from the 2009 Copenhagen Accord. The new target, known as the New Collective Quantified Goal (NCQG), will be under discussion at November’s COP and is intended to take effect from 2025 onwards. A 2022 report[PDF] by the Independent High-level Expert Group on Climate Finance found that developing countries need around $1 trillion per year by 2025, and $2.4 trillion by 2030 to meet their climate finance needs. Among the most contentious issues that remain are how much money developed nations will provide, and who should provide climate finance.
Yes, those are Trillions of US$ they are projecting to spend.
My Comments
Since there is a big push on climate funding, maybe they could get to the bottom of this:
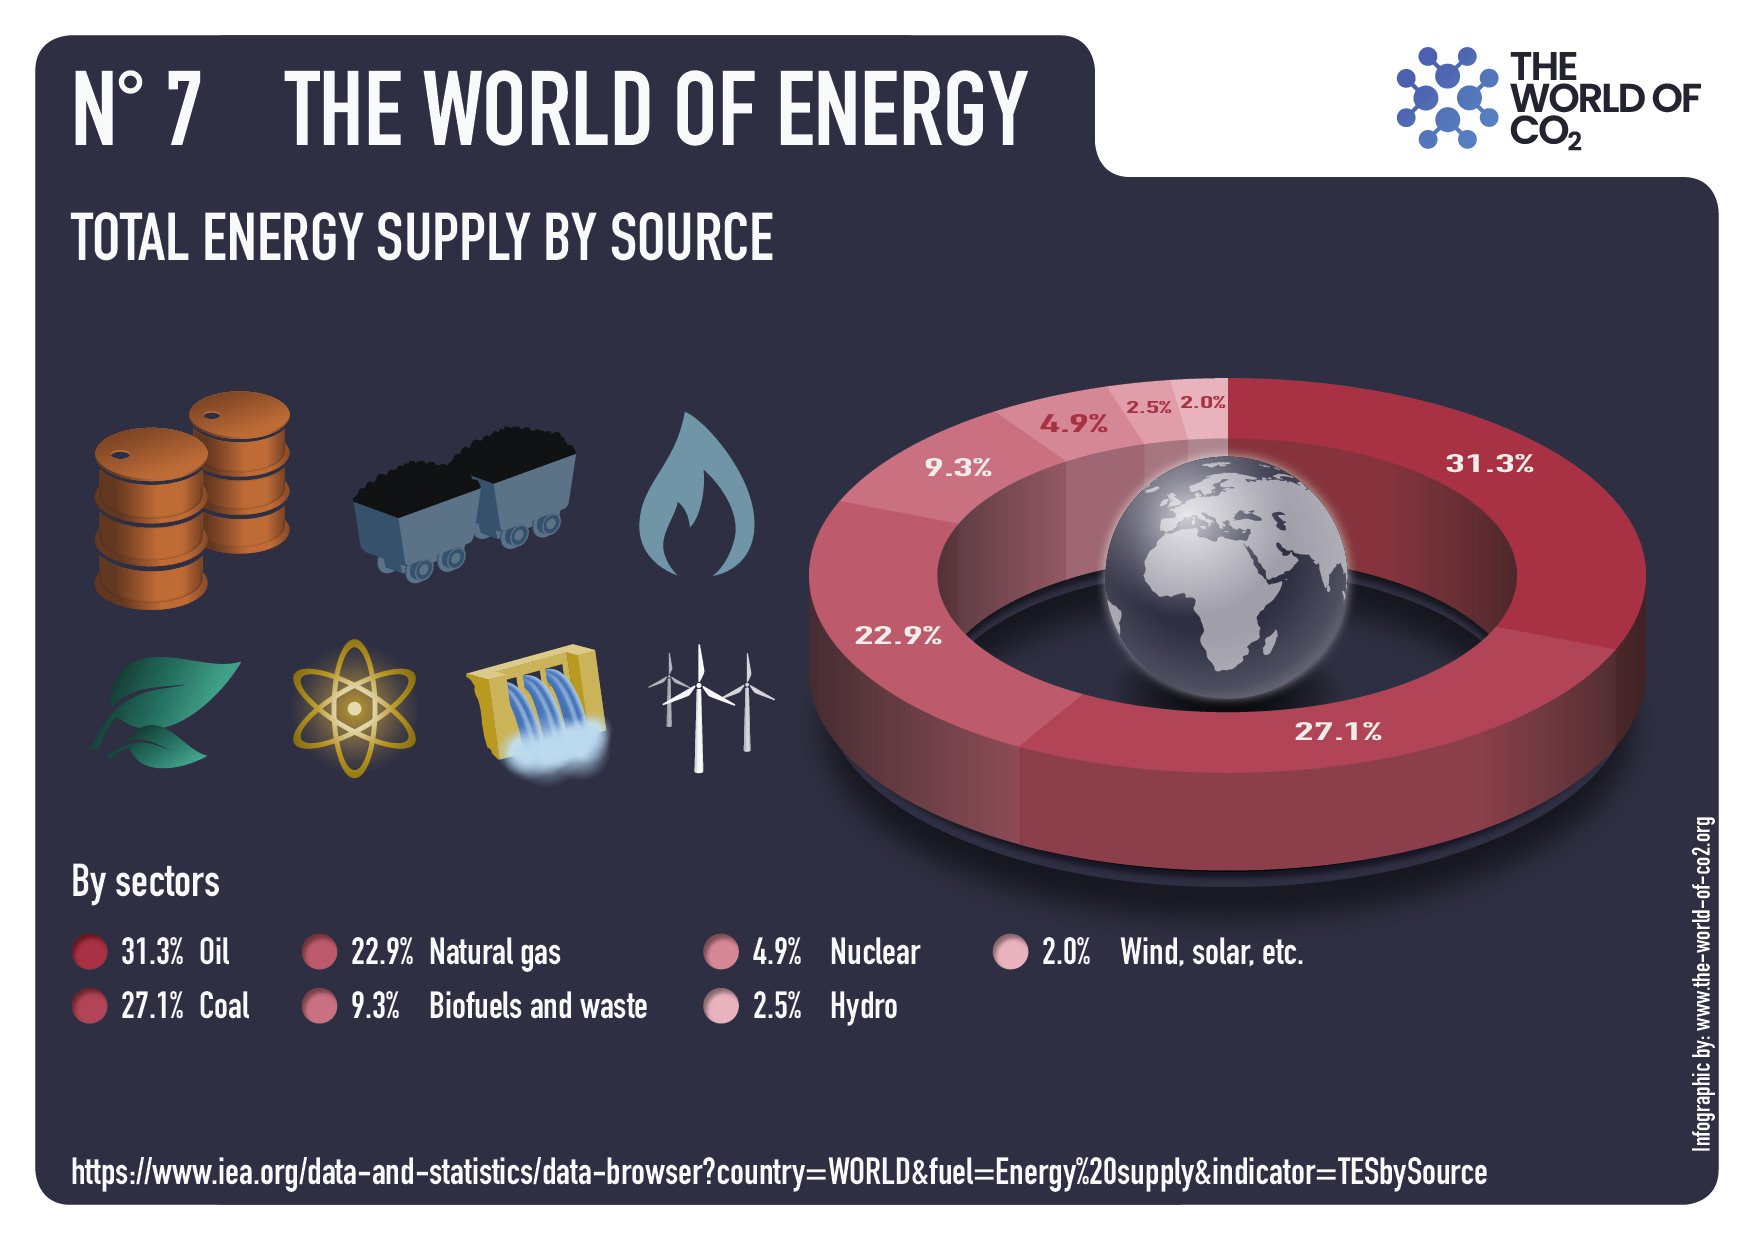
Maybe donors are put off by no one knowing who gets the money and for what it is spent. And while they are investigating, how about understanding Energy Return on Investment (EROI): you know, the notion that an energy project is worth doing if the energy produced is greater than energy spent. The windmills in the logo at the top reminded me of this:
Why a COP Briefing?
Actually, climate hysteria is like a seasonal sickness. Each year a contagion of anxiety and fear is created by disinformation going viral in both legacy and social media in the run up to the annual autumnal COP. Since the climatists have put themselves at the controls of the formidable US federal government, we can expect the public will be hugely hosed with alarms over the next few weeks. Before the distress signals go full tilt, individuals need to inoculate themselves against the false claims, in order to build some herd immunity against the nonsense the media will promulgate. This post is offered as a means to that end.
Media Climate Hype is a Cover Up
Back in 2015 in the run up to Paris COP, French mathematicians published a thorough critique of the raison d’etre of the whole crusade. They said:
Fighting Global Warming is Absurd, Costly and Pointless.
Absurd because of no reliable evidence that anything unusual is happening in our climate.
Costly because trillions of dollars are wasted on immature, inefficient technologies that serve only to make cheap, reliable energy expensive and intermittent.
Pointless because we do not control the weather anyway.
The prestigious Société de Calcul Mathématique (Society for Mathematical Calculation) issued a detailed 195-page White Paper presenting a blistering point-by-point critique of the key dogmas of global warming. The synopsis with links to the entire document is at COP Briefing for Realists
Even without attending to their documentation, you can tell they are right because all the media climate hype is concentrated against those three points.
Finding: Nothing unusual is happening with our weather and climate. Hype: Every metric or weather event is “unprecedented,” or “worse than we thought.”
Finding: Proposed solutions will cost many trillions of dollars for little effect or benefit. Hype: Zero carbon will lead the world to do the right thing. Anyway, the planet must be saved at any cost.
Finding: Nature operates without caring what humans do or think. Hype: Any destructive natural event is blamed on humans burning fossil fuels.
How the Media Throws Up Flak to Defend False Suppositions
The Absurd Media: Climate is Dangerous Today, Yesterday It was Ideal.
Billions of dollars have been spent researching any and all negative effects from a warming world: Everything from Acne to Zika virus. A recent Climate Report repeats the usual litany of calamities to be feared and avoided by submitting to IPCC demands. The evidence does not support these claims. An example:
It is scientifically established that human activities produce GHG emissions, which accumulate in the atmosphere and the oceans, resulting in warming of Earth’s surface and the oceans, acidification of the oceans, increased variability of climate, with a higher incidence of extreme weather events, and other changes in the climate.
Moreover, leading experts believe that there is already more than enough excess heat in the climate system to do severe damage and that 2C of warming would have very significant adverse effects, including resulting in multi-meter sea level rise.
Experts have observed an increased incidence of climate-related extreme weather events, including increased frequency and intensity of extreme heat and heavy precipitation events and more severe droughts and associated heatwaves. Experts have also observed an increased incidence of large forest fires; and reduced snowpack affecting water resources in the western U.S. The most recent National Climate Assessment projects these climate impacts will continue to worsen in the future as global temperatures increase.
Alarming Weather and Wildfires
But: Weather is not more extreme.
And Wildfires were worse in the past. But: Sea Level Rise is not accelerating.
Litany of Changes
Seven of the ten hottest years on record have occurred within the last decade; wildfires are at an all-time high, while Arctic Sea ice is rapidly diminishing.
We are seeing one-in-a-thousand-year floods with astonishing frequency.
When it rains really hard, it’s harder than ever.
We’re seeing glaciers melting, sea level rising.
The length and the intensity of heatwaves has gone up dramatically.
Plants and trees are flowering earlier in the year. Birds are moving polewards.
We’re seeing more intense storms.
But: Arctic Ice has not declined since 2007.
But: All of these are within the range of past variability.In fact our climate is remarkably stable, compared to the range of daily temperatures during a year where I live.
And many aspects follow quasi-60 year cycles.
The Impractical Media: Money is No Object in Saving the Planet.
Here it is blithely assumed that the UN can rule the seas to stop rising, heat waves to cease, and Arctic ice to grow (though why we would want that is debatable). All this will be achieved by leaving fossil fuels in the ground and powering civilization with windmills and solar panels. While admitting that our way of life depends on fossil fuels, they ignore the inadequacy of renewable energy sources at their present immaturity.
An Example: The choice between incurring manageable costs now and the incalculable, perhaps even irreparable, burden Youth Plaintiffs and Affected Children will face if Defendants fail to rapidly transition to a non-fossil fuel economy is clear. While the full costs of the climate damages that would result from maintaining a fossil fuel-based economy may be incalculable, there is already ample evidence concerning the lower bound of such costs, and with these minimum estimates, it is already clear that the cost of transitioning to a low/no carbon economy are far less than the benefits of such a transition. No rational calculus could come to an alternative conclusion. Defendants must act with all deliberate speed and immediately cease the subsidization of fossil fuels and any new fossil fuel projects, and implement policies to rapidly transition the U.S. economy away from fossil fuels.
But CO2 relation to Temperature is Inconsistent.
But: The planet is greener because of rising CO2.
But: Modern nations (G20) depend on fossil fuels for nearly 90% of their energy.
But: Renewables are not ready for prime time.
People need to know that adding renewables to an electrical grid presents both technical and economic challenges. Experience shows that adding intermittent power more than 10% of the baseload makes precarious the reliability of the supply. South Australia is demonstrating this with a series of blackouts when the grid cannot be balanced. Germany got to a higher % by dumping its excess renewable generation onto neighboring countries until the EU finally woke up and stopped them. Texas got up to 29% by dumping onto neighboring states, and some like Georgia are having problems.
But more dangerous is the way renewables destroy the economics of electrical power. Seasoned energy analyst Gail Tverberg writes:
In fact, I have come to the rather astounding conclusion that even if wind turbines and solar PV could be built at zero cost, it would not make sense to continue to add them to the electric grid in the absence of very much better and cheaper electricity storage than we have today. There are too many costs outside building the devices themselves. It is these secondary costs that are problematic. Also, the presence of intermittent electricity disrupts competitive prices, leading to electricity prices that are far too low for other electricity providers, including those providing electricity using nuclear or natural gas. The tiny contribution of wind and solar to grid electricity cannot make up for the loss of more traditional electricity sources due to low prices.
The Irrational Media: Whatever Happens in Nature is Our Fault.
An Example:
Other potential examples include agricultural losses. Whether or not insurance reimburses farmers for their crops, there can be food shortages that lead to higher food prices (that will be borne by consumers, that is, Youth Plaintiffs and Affected Children). There is a further risk that as our climate and land use pattern changes, disease vectors may also move (e.g., diseases formerly only in tropical climates move northward).36 This could lead to material increases in public health costs
But: Actual climate zones are local and regional in scope, and they show little boundary change.
But: Ice cores show that it was warmer in the past, not due to humans.
The hype is produced by computer programs designed to frighten and distract children and the uninformed. For example, there was mention above of “multi-meter” sea level rise. It is all done with computer models. For example, below is San Francisco. More at USCS Warnings of Coastal Floodings
In addition, there is no mention that GCMs projections are running about twice as hot as observations.
Omitted is the fact GCMs correctly replicate tropospheric temperature observations only when CO2 warming is turned off.
Figure 5. Simplification of IPCC AR5 shown above in Fig. 4. The colored lines represent the range of results for the models and observations. The trends here represent trends at different levels of the tropical atmosphere from the surface up to 50,000 ft. The gray lines are the bounds for the range of observations, the blue for the range of IPCC model results without extra GHGs and the red for IPCC model results with extra GHGs.The key point displayed is the lack of overlap between the GHG model results (red) and the observations (gray). The nonGHG model runs (blue) overlap the observations almost completely.
In the effort to proclaim scientific certainty, neither the media nor IPCC discuss the lack of warming since the 1998 El Nino, despite two additional El Ninos in 2010 and 2016.
Further they exclude comparisons between fossil fuel consumption and temperature changes. The legal methodology for discerning causation regarding work environments or medicine side effects insists that the correlation be strong and consistent over time, and there be no confounding additional factors. As long as there is another equally or more likely explanation for a set of facts, the claimed causation is unproven. Such is the null hypothesis in legal terms: Things happen for many reasons unless you can prove one reason is dominant.
Finally, advocates and IPCC are picking on the wrong molecule. The climate is controlled not by CO2 but by H20. Oceans make climate through the massive movement of energy involved in water’s phase changes from solid to liquid to gas and back again. From those heat transfers come all that we call weather and climate: Clouds, Snow, Rain, Winds, and Storms.
Esteemed climate scientist Richard Lindzen ended a very fine recent presentation with this description of the climate system:
I haven’t spent much time on the details of the science, but there is one thing that should spark skepticism in any intelligent reader. The system we are looking at consists in two turbulent fluids interacting with each other. They are on a rotating planet that is differentially heated by the sun. A vital constituent of the atmospheric component is water in the liquid, solid and vapor phases, and the changes in phase have vast energetic ramifications. The energy budget of this system involves the absorption and reemission of about 200 watts per square meter. Doubling CO2 involves a 2% perturbation to this budget. So do minor changes in clouds and other features, and such changes are common. In this complex multifactor system, what is the likelihood of the climate (which, itself, consists in many variables and not just globally averaged temperature anomaly) is controlled by this 2% perturbation in a single variable? Believing this is pretty close to believing in magic. Instead, you are told that it is believing in ‘science.’ Such a claim should be a tip-off that something is amiss. After all, science is a mode of inquiry rather than a belief structure.
Summary: From this we learn three things:
Climate warms and cools without any help from humans.
Warming is good and cooling is bad. The hypothetical warming from CO2 would be a good thing.
Dr. Kevin E. Trenberth, a distinguished scholar at the National Center for Atmospheric Research, commented on this movie: “I don’t recall a lot except that the whole science was incredibly wrong,”, “one does not get an ice age out of global warming.”
Likely you’ve heard the recent and previous warnings from Mann and friends about the ocean conveyor belt (including the Gulf Stream) slowing down and freezing us all. With the COP gathering next month, something scary must be proclaimed, and Global Freezing is it, replacing Global Boiling earlier this year. The declaration signed by Mann and 43 other scientists was Open Letter by Climate Scientists to the Nordic Council of Ministers, Reykjavik, October 2024. Preface:
“We, the undersigned, are scientists working in the field of climate research and feel it is urgent to draw the attention of the Nordic Council of Ministers to the serious risk of a major ocean circulation change in the Atlantic. A string of scientific studies in the past few years suggests that this risk has so far been greatly underestimated. Such an ocean circulation change would have devastating and irreversible impacts especially for Nordic countries, but also for other parts of the world.”
“Given the increasing evidence for a higher risk of an AMOC collapse, we believe it is of critical importance that Arctic tipping point risks, in particular the AMOC risk, are taken seriously in governance and policy. Even with a medium likelihood of occurrence, given that the outcome would be catastrophic and impacting the entire world for centuries to come, we believe more needs to be done to minimize this risk.”
The Warning is based on Fear, not Facts
1. The AMOC has been stable for the last four decades.
The potential weakeningof the Atlantic Meridional Overturning Circulation (AMOC) in response to anthropogenic forcing, suggested by climate models, is at the forefront of scientific debate. A key AMOC component, the Florida Current (FC), has been measured using submarine cables between Florida and the Bahamas at 27°N nearly continuously since 1982. A decrease in the FC strength could be indicative of the AMOC weakening. Here, we reassess motion-induced voltages measured on a submarine cable and reevaluate the overall trend in the inferred FC transport. We find that the cable record beginning in 2000 requires a correction for the secular change in the geomagnetic field. This correction removes a spurious trend in the record, revealing that the FC has remained remarkably stable. The recomputed AMOC estimates at ~26.5°N result in a significantly weaker negative trend than that which is apparent in the AMOC time series obtained with the uncorrected FC transports.
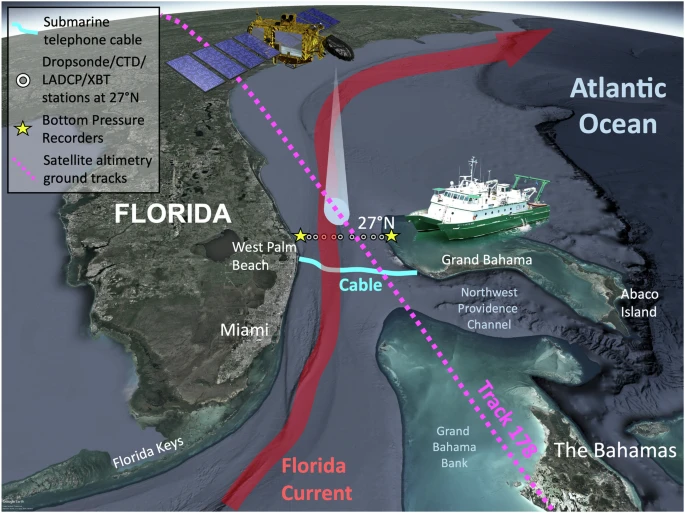
Fig. 1: The Western Boundary Time Series observing network in the Straits of Florida.
The network consists of the submarine telecommunications cable between West Palm Beach and Grand Bahama Island (cyan curve), ship sections across the Florida Current (FC) at 27°N with in situ measurements at nine stations (white circles), two bottom pressure gauges on both sides of the FC at 27°N (yellow stars), and along-track satellite altimetry measurements (magenta dotted line). CTD Conductivity-Temperature-Depth, LADCP Lowered Acoustic Doppler Current Profiler, XBT expendable bathythermograph.
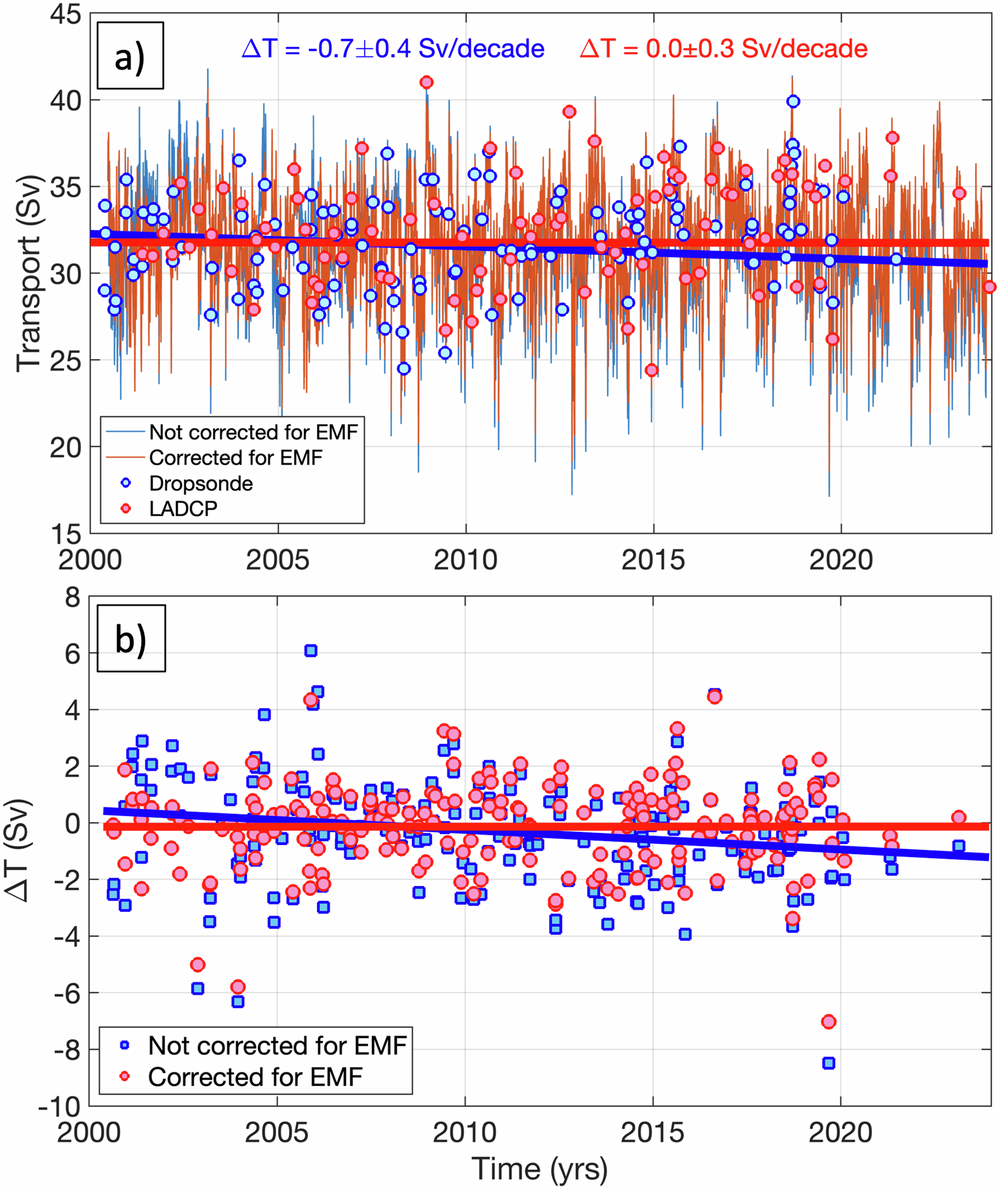
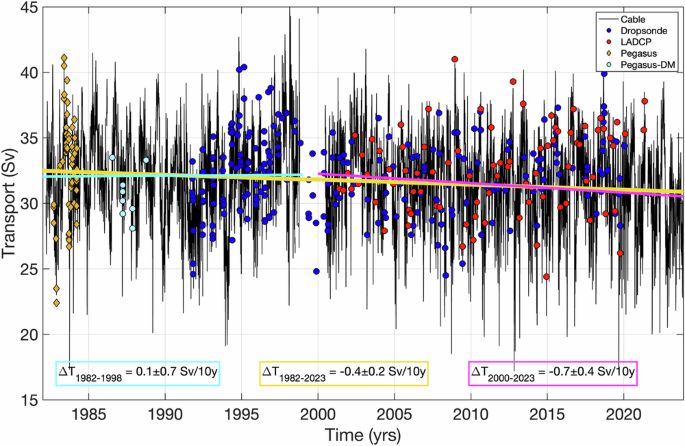
Fig. 6: Florida Current (FC) volume transports corrected for the secular change in the Earth’s Magnetic Field (EMF).
a The time series of the daily FC volume transport: (blue) not corrected for the secular change in the EMF, (red) corrected for the secular change in the EMF. The linear trends of the FC transport not corrected and corrected for the EMF are shown by the blue and red lines, respectively. b The differences between the cable and ship section transport for the cable data (blue squares) not corrected for the EMF and (red circles) corrected for the EMF. The linear trends of the differences (ΔT) not corrected and corrected for the EMF are shown by the blue and red lines, respectively.
Fig. 2: The Florida Current volume transport.
Daily transport estimates from the cable record (black; prior to corrections applied in this study); estimates from the Pegasus (orange diamonds) and Pegasus in dropsonde mode (Pegasus-DM; light blue circles) sections; estimates from the dropsonde sections (blue circles); and estimates from the Lowered Acoustic Doppler Current Profiler (LADCP) sections (red circles). The linear trends for 1982–2023, 1982–1998, and 2000–2023 periods are shown by the orange, cyan, and magenta lines, respectively.
2. Paleo records show past AMOC changes due to seafloor shifts not climate change.
The global meridional overturning circulation (GMOC) is important for redistributing heat and, thus, determining global climate, but what determines its strength over Earth’s history remains unclear. On the basis of two sets of climate simulations for the Paleozoic characterized by a stable GMOC direction, our research reveals that GMOC strength primarily depends on continental configuration while climate variations have a minor impact. In the mid- to high latitudes, the volume of continents largely dictates the speed of westerly winds, which in turn controls upwelling and the strength of the GMOC. At low latitudes, open seaways also play an important role in the strength of the GMOC. An open seaway in one hemisphere allows stronger westward ocean currents, which support higher sea surface heights (SSH) in this hemisphere than that in the other. The meridional SSH gradient drives a stronger cross-equatorial flow in the upper ocean, resulting in a stronger GMOC. This latter finding enriches the current theory for GMOC.
On the basis of a series of simulations for the Paleozoic, we find that the GMOC is primarily controlled by:
freshwater input into ocean;
wind-driven Ekman pumping in the midlatitudes, and
SH anomaly in low latitudes.
The latter two factors are especially important for the strength of the GMOC and are highly related to continental configuration. Our major conclusions find validation through Paleozoic climate simulations using the HadCM3 model by Valdes et al. (53, 67) and a non-IPCC class model, FOAM, by Pohl et al. (52) (figs. S17 and S18). This last study by Pohl et al. (52) also pointed out the unfortunate absence of proxy data for validating the direction and magnitude of the Paleozoic GMOC.
Controlling factors for the global
meridional overturning circulation
Fig. 5. Schematic of controlling factors for the GMOC during the Paleozoic. The schematic is based on the situation for 400 Ma. Three main factors are shown, the less net precipitation in the south SH; the strong westerlies, ocean surface current, and Ekman upwelling in the midlatitude region in NH; the SSH anomaly and associated pressure anomaly in the low-latitude region.
Although there has been tremendous interest in understanding the mechanisms that govern the MOC, surface topography in the westerlies region and the presence of an open seaway in the low-latitude region were previously largely overlooked. Our study thus draws attention to how the evolution of continents in these two regions affects the strength of MOC. Our study indicates that the traditional theory for MOC misses an important element, that is, the influence of a low-latitude seaway. Previous studies either did not have such a seaway (1, 34, 43) or had a partial seaway that connected the present-day Atlantic Ocean and Pacific Ocean only (32–34). Their focus was mostly on the strength of the AMOC and mechanism invoked generally involved freshwater and salinity only (32, 33, 68), while as demonstrated above, a fully open low-latitude seaway affects the MOC in a fundamentally different way.
3. AMOC alarm presupposes Arctic “Amplification” of Global Warming
Activist scientists claim the Arctic is warming up to five times faster than lower latitudes. This is based on models projecting scarce temperature records great distances over the Arctic ocean drift sea ice. There are three flaws in the arctic warming claim (from Arctic “Amplification” Not What You Think)
a. Arctic Amplification is an artifact of Temperature Anomalies
Clive Best provides this animation of recent monthly temperature anomalies which demonstrates how most variability in anomalies occur over northern continents.
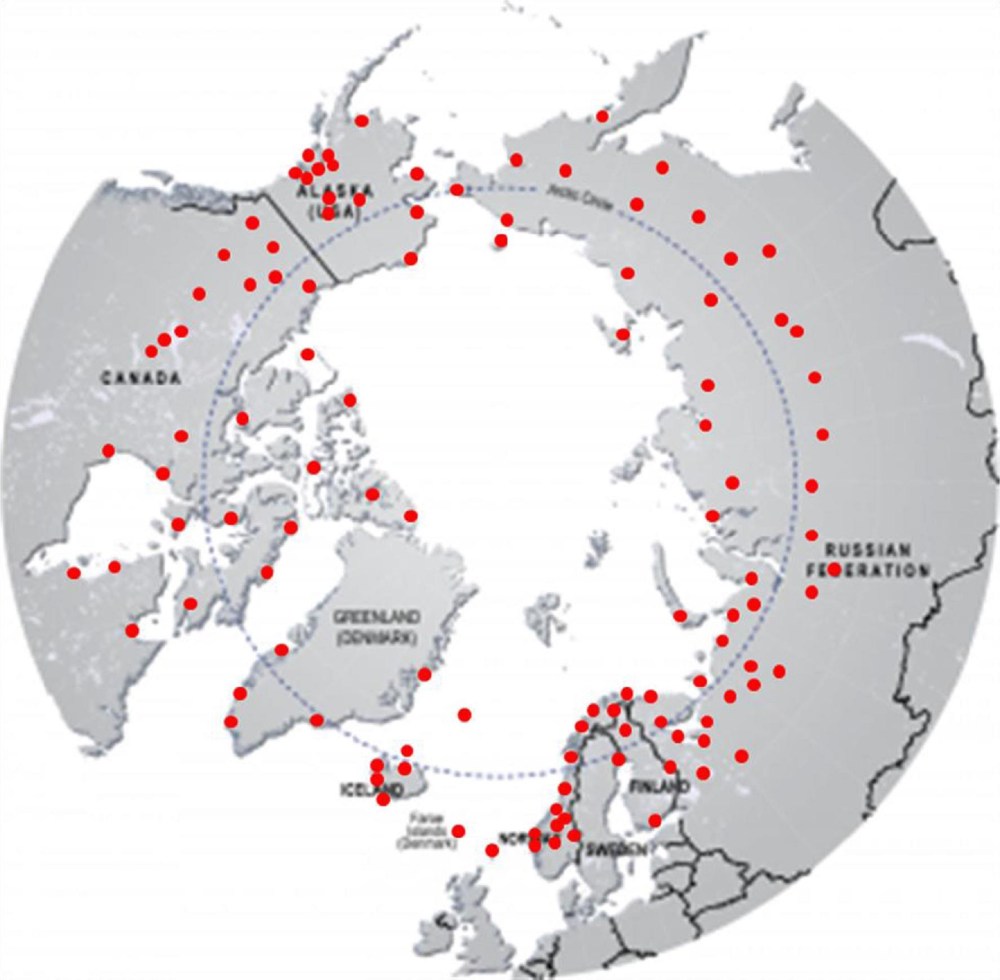
b. Arctic Surface Stations Records Show Ordinary Warming
Locations of 118 arctic stations examined in this study and compared to observations at 50 European stations whose records averaged 200 years and in a few cases extend to the early 1700s.
c. Arctic Warmth Comes from Meridional Heat Transport, not CO2
4. Hypothesis that rising CO2 will collapse the AMOC is flawed.
The “AMOC is collapsing” narrative goes like this:
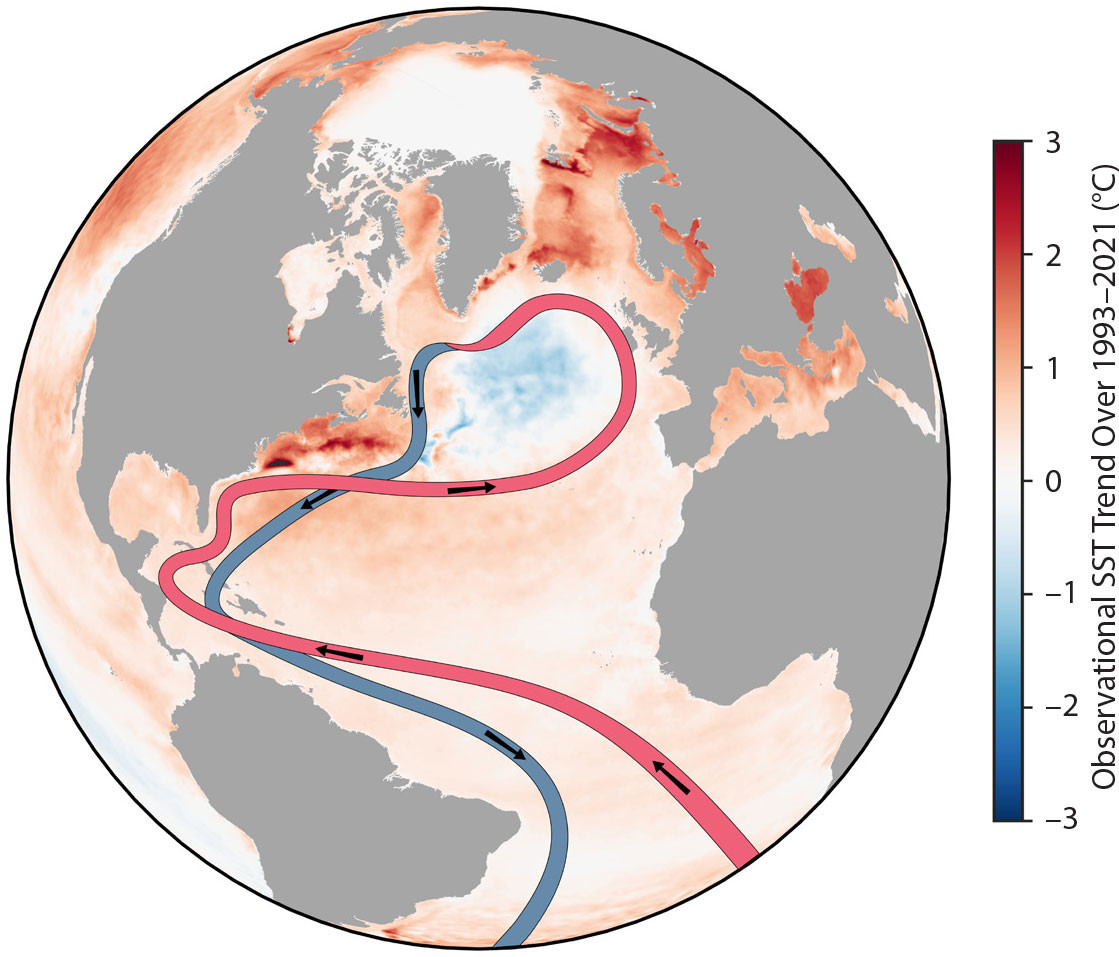
Ocean circulation is driven by density differences, which depend on the salinity and the temperature of the water. Cold, salty water is heavier than warm, fresh water. When flowing water reaches Greenland, it becomes very cold and salty, causing it to sink and flow south, where the water warms and rises closer to the surface again. Some compare the process to a conveyor belt going around and around.
This graphic shows a highly simplified schematic of the Atlantic Meridional Overturning Circulation (AMOC) against a backdrop of the sea surface temperature trend since 1993 from the Copernicus Climate Change Service (https://climate.copernicus.eu/). Image credit: Ruijian Gou. > High res figure.
Changing the salinity of the water messes up the way the water flows. That’s why the melting of the Greenland ice sheets is a big problem: It’s injecting a ton of freshwater into the ocean far north, where the water is usually very salty. The more freshwater, the weaker the circulation—not to mention that atmospheric temperatures are also increasing, which also makes water lighter. The new study shows that if the density dynamics change enough, the conveyor belt will eventually stop moving, aka “collapse.” That means it won’t transport any water, saline, or heat across the globe.
So the scenario is that supposed amplified Arctic warming will cause iceberg calving and glacial melting, and the freshwater will slow and eventually stop the AMOC. Firstly, the above study shows seafloor configuration has greater impact than salinity changing. Secondly, the spread of freshwater is not so simple.
Anthropogenic warming is projected to enhance Arctic freshwater exportation into the Labrador Sea. This extra freshwater may weaken deep convection and contribute to the Atlantic Meridional Overturning Circulation (AMOC) decline. Here, by analyzing an unprecedented high-resolution climate model simulation for the 21st century, we show that the Labrador Current strongly restricts the lateral spread of freshwater from the Arctic Ocean into the open ocean such that the freshwater input has a limited role in weakening the overturning circulation. In contrast, in the absence of a strong Labrador Current in a climate model with lower resolution, the extra freshwater is allowed to spread into the interior region and eventually shut down deep convection in the Labrador Sea. Given that the Labrador Sea overturning makes a significant contribution to the AMOC in many climate models, our results suggest that the AMOC decline during the 21st century could be overestimated in these models due to the poorly resolved Labrador Current.
One way to warn of forthcoming critical transitions in Earth system components is using observations to detect declining system stability. It has also been suggested to extrapolate such stability changes into the future and predict tipping times. Here, we argue that the involved uncertainties are too high to robustly predict tipping times. We raise concerns regarding
(i) the modeling assumptions underlying any extrapolation of historical results into the future,
(ii) the representativeness of individual Earth system component time series, and
(iii) the impact of uncertainties and preprocessing of used observational datasets, with focus on nonstationary observational coverage and gap filling.
We explore these uncertainties in general and specifically for the example of the Atlantic Meridional Overturning Circulation. We argue that even under the assumption that a given Earth system component has an approaching tipping point, the uncertainties are too large to reliably estimate tipping times by extrapolating historical information.
“The conclusions of this study are certainly in line with my understanding of the current state of the art,” says Gavin Schmidt, a climate scientist and professor at Columbia University and the director of NASA’s Goddard Institute for Space Studies (GISS). Schmidt was not involved in the new work, but has extensively researched climate variability and systems like AMOC.
“I have not been impressed by previous or recent efforts to predict upcoming tipping points in either AMOC or ice sheets — there is more going on than just patterns in time series and we still don’t have sufficiently complex and calibrated models to have a robust idea of what will happen,” says Gavin Schmidt, director of NASA’s GISS.
Footnote
In researching for this post I discovered an informative website Ocean to Climate Science news & articles on topics related to ocean and climate by oceanographer Sang-Ki Lee. Some additional examples of studies for further reading on this issue are below.
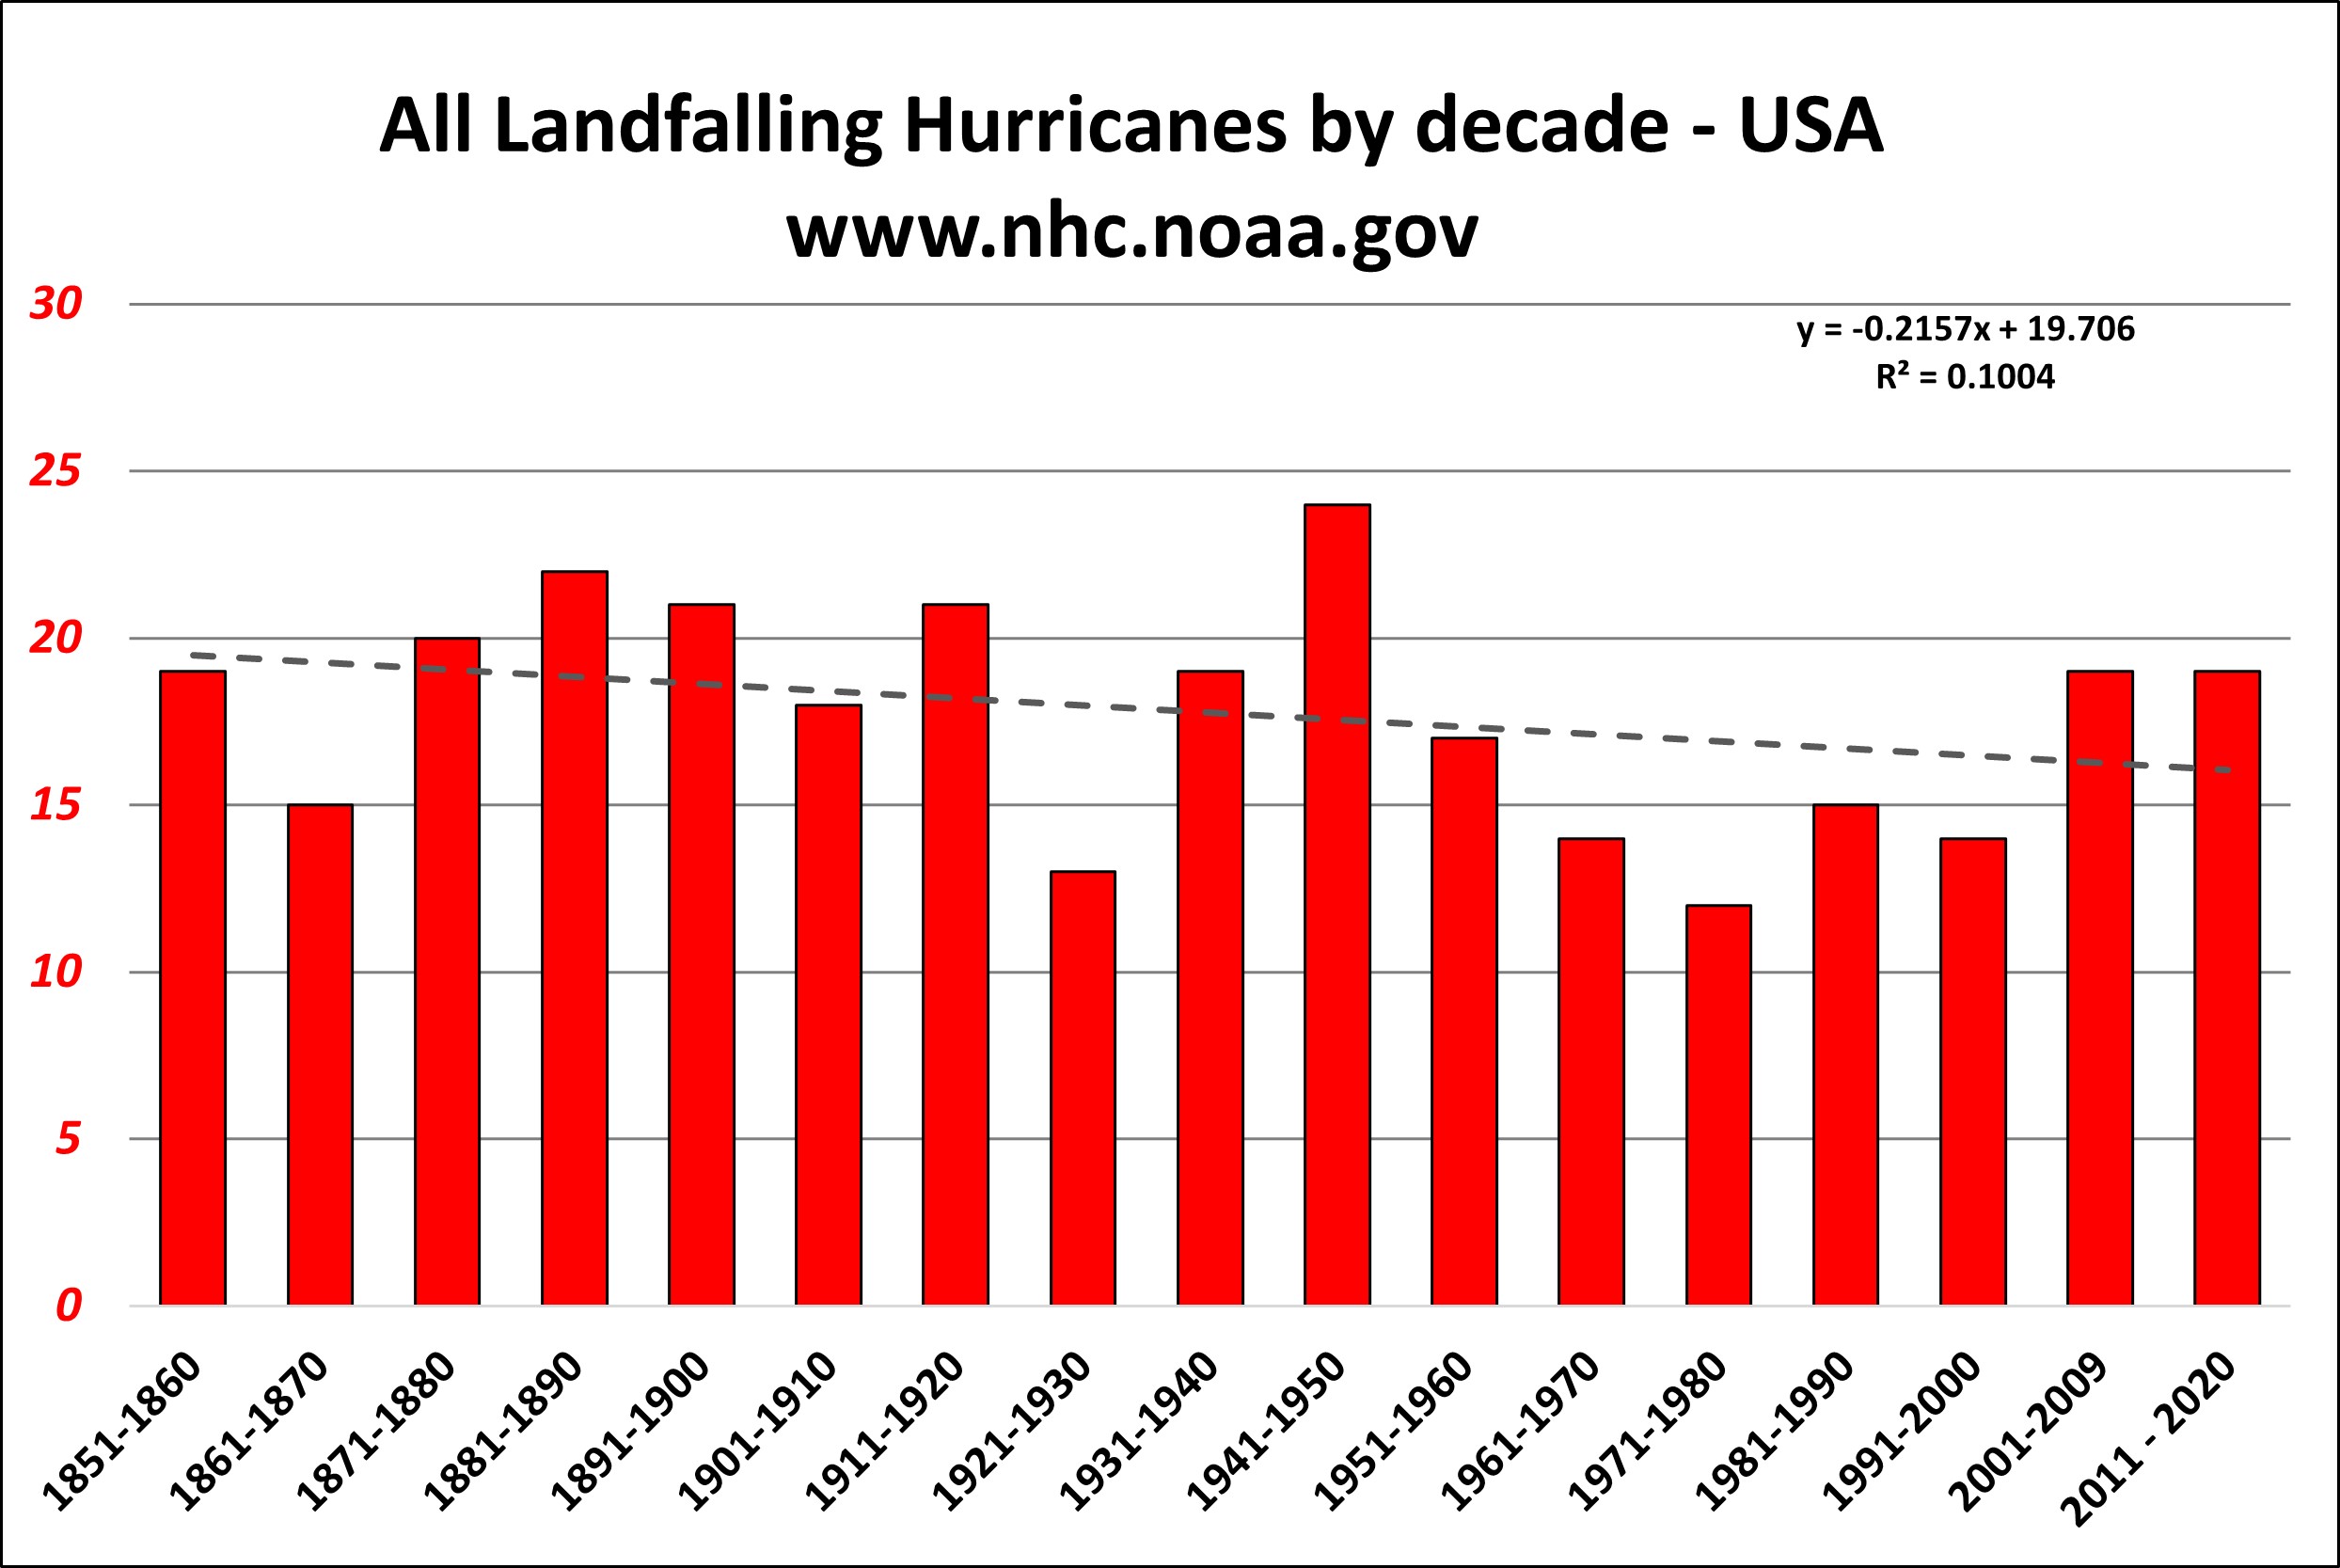
Weather is inherently mysterious. Multiple forces, such as wind, clouds, seasonal and day-night cycles, and air pressure are constantly interacting and causing continuous chaos. In the aftermath of two particularly destructive hurricanes, the fear-mongers are bloviating to the max over the catastrophic effects on the climate caused by human existence.
And yet there is no discernible trend toward either more storms or more intense hurricanes compiled over more than beyond the last century. (This chart by NOAA was especially easy to find.) Thus far, the decade of the 1940s saw the most seriously intense storms. Being historical data, this brings to mind a modification of Santayana’s famous adage: when people are ignorant of their history, they make it really easy for demagogues to lie to them about it.
Rather than human consumption of fossil fuels, two other factors are mostly relevant when it comes to the damage wrought by hurricanes: the path they take and the development of infrastructure within that path. Out on the open sea, a hurricane may damage a few ships, but when one goes over a population center…well, you know, it just happened.
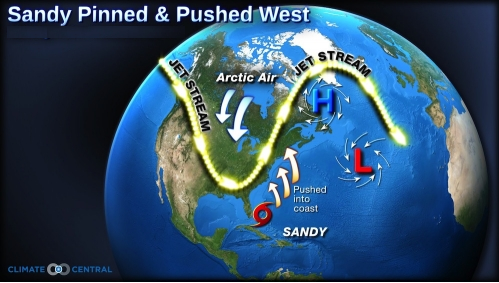
What determines the path is largely chaotic. Go figure. There’s this weird thing called the jet stream, which is sort of the result of the Earth’s continuous rotation within a tenuous atmospheric envelope. Becoming known to American aviators during World War 2, the particular details of the jet stream were kept as a military secret well into the mid-twentieth century. Ocean currents and surface temperatures are also involved. Early forecasts of hurricane paths are typically all over the map. As the time frame compresses, they tend to become more accurate, but not always.
Then there’s the “atypically” warm weather that sometimes happens in early autumn. We just had some of that, along with offshore winds and seriously elevated fire danger. In the olden days, this was called “Indian summer.” Back in 1919, Victor Herbert even wrote a song by that name. Maybe I’m just a cynic, but I’m expecting the fear-mongers to start pandering to the general public’s pervasive ignorance of earth science to cause panic over yet another routine weather event.
There are three scientific disciplines that are especially useful when looking at weather and climate of the distant past: geology; paleontology; and tree ring analysis, known as dendrochronology. Geology shows us the impact glaciers have had on the Earth’s surface. Paleontology shows us the now extinct life forms that thrived under previous environmental conditions. Dendrochronology shows us a preserved record of ancient weather conditions such as year-to-year rainfall and temperature.
How warm would the weather have to be for giant reptiles to flourish all over the Earth? Pretty warm, it seems. There is some work afoot to show that dinosaurs may have been warm-blooded. Good luck with that. Birds are the first known warm-blooded animals, and they evolved from reptiles and still tend to have scales on their legs. Mammals are also warm-blooded. Enormously large mammals such as wooly mammoths were common during the last ice age, the Pleistocene. Having a large size is especially beneficial for warm-blooded animals in cold climates, since surface area of the outer skin increases much more slowly than the actual body mass, making the large animal significantly more thermally efficient than a smaller one.
But why is the blatant climate change hoax still being promoted? There are two different reasons. The first is held among the true believers: humans are evil. They recklessly continue to damage the Earth’s biosphere, just for trivial benefits and without the slightest concern for the consequences of their actions. The other is political:fear can be a terrific motivator but is not all that conducive to good decision-making. That’s fine, too. The wannabe mega-state tyrants l-o-v-e to deal with fear and poor decision-making. How else can they effectively enslave the masses so as to fulfill their objectives?
And what are these objectives?Taking control of everything comes to mind. The evil players in politics are mostly after control. The rest of us just want to have the streets swept and the criminals pulled away from the rest of us. The term Statist should replace Marxist in this dialogue.Absolute government authority should overcome the self-direction of the individual — since so many among us are not really attuned to proper functionality in the modern world.
Socialism was already in the works when Karl Marx got involved. I like to say that a communist is an angry socialist. Marx injected class struggle into the quest for ownership of the means of production. Thus, the USA was a tough sell for Marxism since we are a particularly socially mobile society. The late, great Walter E. Williams would often say that the ranks of the one-percenters were constantly changing — since new ones would rise up, while others would blow it and fall away. The “Old World,” by contrast, is littered with caste systems and other forms of enforced social order.
Back to Caddell’s “elite gentry” — their desires are in mortal conflict with the aspirations of just plain folks. Or as Lincoln said, “God must love the common man, for he made so many of them.” To some, populism is a dirty word. To others, it is a path into the future. It can mean different things to different people. I like to use the term personal freedom. We can do what we want — as long as we don’t interfere with the freedom of others. But to others, “freedom” is a dirty word.
Professor Ian Plimer schools a politico climate change “authority” in the above interview aired by Sky News Australia. For those preferring to read, a transcript is below lightly edited from the closed captions.
Climate Change authority Matt Kean, former Liberal treasurer of New South Wales, has lashed out at nuclear energy advocates, accusing them of being delay mongers trying to prevent renewables from succeeding. He labeled the push for nuclear and more gas as quote:
An illiberal drive to intervene in the market-led energy transition.”
Also he went on to say that the delay mongers have latched onto nuclear power despite the overwhelming evidence that it can only drive up energy bills, can only be more expensive and can only take too long to build this. In a cost of living crisis it seems to me that people calling for gas to be included in the capacity investment scheme are trying to stop renewables. Ian, I’m very very interested in your response to Matt K’s claims there.
Well this is just sheer stupidity. Mr Kean should know that when Finland put in its reactors, their latest reactors, the cost of electricity went down. And both the retailer and the wholesaler also had lower costs. So we have evidence very recently. The Page Research Center recently did a study on the cost of energy. This was done by Gerard Holland and he looked at solar and wind, he looked at nuclear, looked at gas and at coal.
By far the most expensive energy in Australia is solar and wind. This is considering the total costs, the land use changes, putting in the new power lines and so forth. Nuclear is quite cheap compared with that, gas is also cheap, as is coal. Coal’s the cheapest and that’s because we already have the infrastructure for coal.
Now what Mr. Kean doesn’t say is that solar and wind are not reliable, whereas nuclear, gas and coal are reliable. He also doesn’t say that solar and wind have a very short life less than 20 years. Whereas nuclear is at least 60 years for a nuclear power plant; more than 40 years for gas; more than 50 years for coal.
Moreover, he doesn’t say that our future demands for energy are going to increase enormously. We’re already using 10% of energy for data centers and with AI it’s going to be a lot higher. His real concern is that the practical economics of the nuclear lobby groups are starting to frighten renewables promoters; the practical economics of the gas groups are starting to frighten the wind and solar people.
These are the cheapest and most reliable and best forms of energy we can have in a country like Australia. And yet we’ve got all these foreign corporations who are running the solar and running the wind projects who are lining up for for their subsidies. And the subsidies make the renewable energy viable and profitable. The subsidies must keep getting renewed and he’s getting worried that that the whistle is going to be blown on this.
Worldwide, nuclear yields slightly more electricity than renewables.
We see around the world that we can have cheap reliable energy for very long periods of time from Nuclear. So I recommend that viewers look at Gerard Holland’s report from the Page Research Center. He aired these findings at the AIC conference on Tuesday, They show that we are going down the wrong path. We’ve got far too many vested interests whispering in Mr Kean’s ear. He doesn’t understand the fundamentals of energy generation and he doesn’t understand the fundamental weaknesses of solo and wind.
And I do love his comment about the illiberal drive to intervene in the market-led energy transition. When there has been so much market manipulation like the subsidies. It’s just wishful thinking to pretend that renewables are being led by the market, as though it were purely organic.
I’ve got an early Lefty losing it for you. It’s from the New Zealand greens: Coal, don’t dig it, leave it on the ground, get with it.
What do you say to the New Zealand greens Professor Plimer. I think they’ve been taking some of Kamala Harris scripts and talking from them. I have no idea what they’re talking about. But we do know that the New Zealand coals on the west coast of South Island are exceptionally clean with very high calorific value, and very low Ash, They are prized coals.
New Zealand does have energy from other sources; from oil in and gas in the Taranaki Basin and some geothermal energy. But the New Zealand coals are some of the best in the world I have no idea what they’re trying to say except that perhaps they they want New Zealand to become even more backward.
Our second climate news item is from a wonderfully titled media outlet called motor biscuit:Electric truck fire burns down brand new German fire station.The fire station in Stadtallendorf is really new, in fact they opened its bay doors less than one year ago to accommodate 10 fire engines and many firefighters. However a tragic fire destroyed the the fire station despite its fire fighting purposes. According to Euro News the fire originated with quote an emergency vehicle belonging to the fire department which contained lithium ion batteries and an external power connection. Unfortunately the electric emergencies vehicle blaze destroyed at least 10 fire truck models and caused around 25 million euros in damage.
Now firefighters’ woes and electric vehicles aren’t a new phenomenon. Departments in the United States have different tactics for battling EV battery fires. Ideally First Responders can suppress EV fires with mass quantities of water. However some firefighters claim that depending on the circumstances it’s best to cordon off the area and allow the EV to burn and eventually burn itself out.
Well, allowing a fire to burn itself out in this case took out 10 useful life-saving fire trucks and caused 25 million Euros in damage. Where where to start really with the idiocy of this particular story? For one thing, with all we know about fires from these things, having an EV fire truck and having it plugged into your station. And then I guess firefighters just think, well we’re firefighters so we’re immune, so no fire alarms, no fire suppression system. We don’t need fire alarms, we have fire experts right there exactly with badges. So the first truck goes up in flames. Are the other trucks all just sort of compacted around it? Were none of them far enough away to go over and drive them out of the garage as a as a brave firefighter? Was nobody in the firehouse despite the fact that all the trucks were there?
So you’ve got the error with no smoke alarms evidently no fire suppression system or at least not one geared to fight electric vehicle fires, which should tell you something right there. You have plugged an EV vehicle indoors in closed space next to vehicles that I presume have diesel in them. It’s a Murphy’s disaster waiting to happen. As I’m fond of saying, and it’s very apt in this case: the stupid it really burns.
I would like to think that the first time someone dies because of an electric vehicle fire and it happens multiple times again, the consumer product safety commission gets involved and says: you know what these aren’t safe on the roads these aren’t safe in your house. It’s time to withdraw them until we fix this problem.
But I would be wrong about that. Either people are that stupid or they’re just into the climate scare narrative and the need to do something even if it kills your neighbors or yourself. You know in the 1980s, the consumer product safety commission banned lawn darts pretty quickly because throwing lawn darts had killed a few people. But ebikes for example have killed a lot more, just in New York City alone killed a bunch and they’re still on the market.
The previous post below sounded the alarm about ice halting Arctic shipping early. October 14, the two Northern Sea Route choke points are in place: Chukchi (bottom left) blocking entrance to Bering sea, and Laptev (upper left) stopping traffic to European seas. By yesterday Laptev and East Siberian seas are completely covered, each over 95% of last March max extents. Chukchi is at 50% with its coastline covered. Kara (top left) is also adding ice rapidly. Less obviously Canadian Archipelago (lower center) doubled in 10 days up to 300k km2.
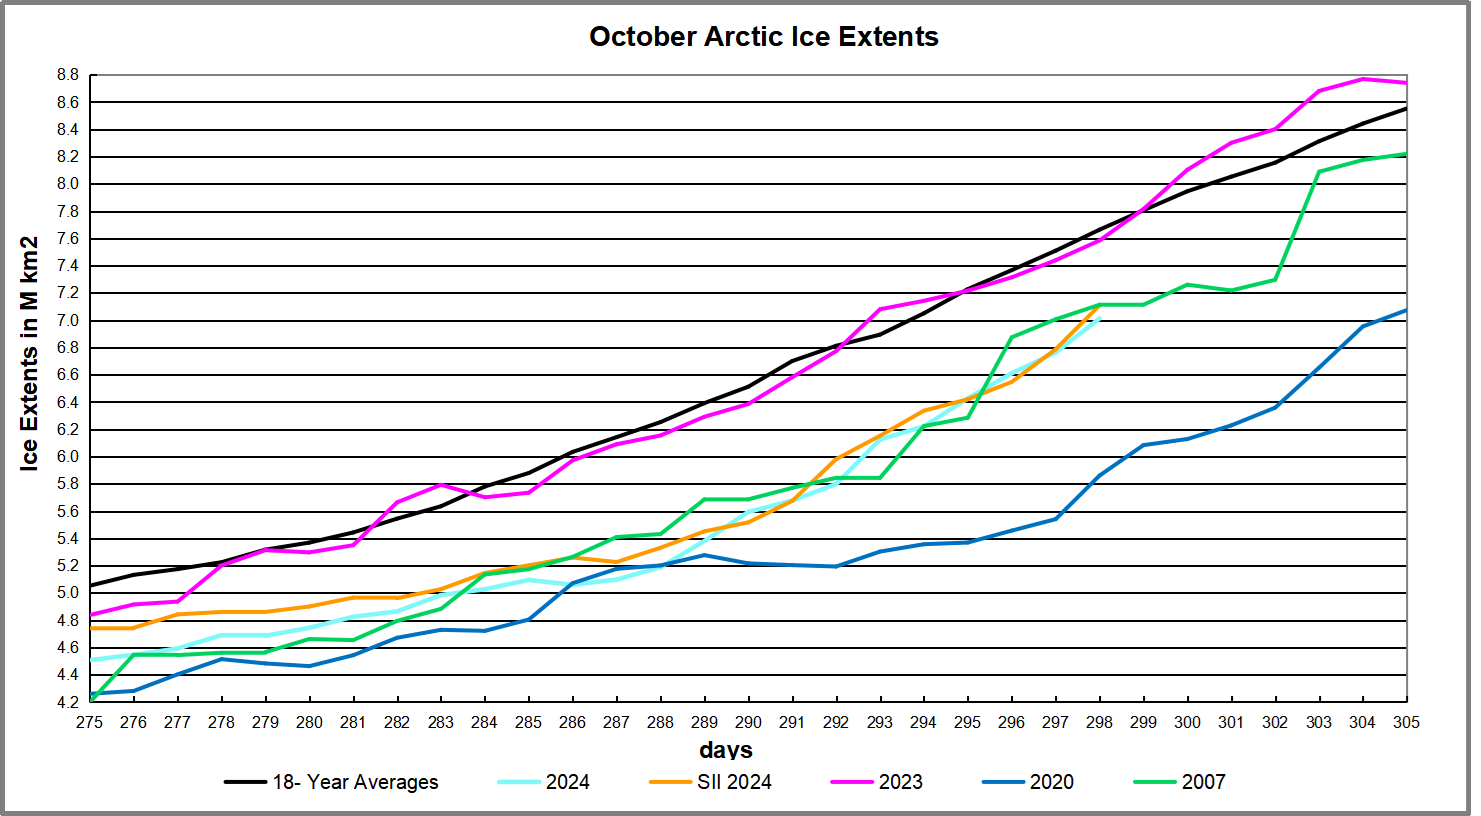
The graph below shows October ice extents on average and for some notable years.
The October gain in ice extents averages ~3.5M km2 up to 8.6M km2. It is the month adding the most ice each year. 2024 has recovered more slowly than usual or than 2023, tracking along with 2007. The re-freezing has accelerated in the last 10 days.
Ice-strengthened supramax Kumpula (Arc 4) on the NSR being escorted by nuclear icebreaker Vaygach. (Source: Courtesy of ESL Shipping)
The summer shipping window on Russia’s Northern Sea Route is coming to a rapid close weeks ahead of schedule. A number of vessels and convoys are rushing to complete their transits before the route shuts down in the next three weeks.
Source: Northern Sea Route Information Office
Unlike the last couple of summers when Russia’s Arctic coastal waterways were fully clear of sea ice, residual winter ice persisted in the eastern section this year. This has resulted in the early onset of ice formation especially in the Laptev, East Siberian, and Chukchi Seas.
NSRIO: Ice is still present in the eastern sector of the NSR preventing free passage of ships without ice class. The nuclear icebreaker Sibir has been operating in the East Siberian and Chukchi Seas since the end of June together with the nuclear icebreaker Vaygach, which has been in the area since mid-July. In several areas of the Chukchi and East Siberian Seas heavy ice conditions are still observed, which directly affects the admission of low ice class vessels to these areas. The western part of the NSR is mostly ice-free. Above is a map of ice conditions as of August 7, 2024.
Russia’s Northern Sea Route Administration announced that vessels with no ice class will have to vacate the waterway by October 15, around 2-3 weeks ahead of schedule. For vessels with light and medium ice classifications the navigation season will end on October 20 and October 31 respectively.
The last permitted start of convoys heading east will be October 10, leaving just one more week for vessels to begin their Arctic transit.
This year’s early shutdown comes three years after narrowly avoiding a major incident three years ago. In October 2021 Russian authorities reacted too late to begin closing down the NSR as winter sea ice drifted into the main shipping channel and trapped two dozen vessels for more than a month. A 30 centimeter or one foot thick ice layer had formed by the end of October across hundreds of miles of Arctic Ocean. Several icebreakers, including the powerful nuclear vessel Yamal, rushed to the scene from Murmansk over 3,000 nautical miles away to help free the stranded vessels. Over the course of more than 6 weeks several icebreakers worked to break the vessels free and escort them to safety out of the eastern section of the Northern Sea Route. The situation did not fully resolve until the end of December when the last vessels were freed.
Vessels stuck in thick winter sea ice in November 2021 awaiting rescue. (Source: Rosatomflot)
Currently a number of container ships, oil tankers, bulk carriers
and LNG tankers are passing through the route.
In the Far East two LNG carriers and two oil tankers, including the Suezmax tanker Sai Baba, are currently passing through the waters adjacent to the Bering Strait. They are staying clear of multi-year ice around Wrangel Island which has persisted and troubled shipping all summer. A nuclear icebreaker had remained on standby for much of the summer keeping the shipping lane open.
Select container ships, crude oil tankers, and bulk and LNG carriers currently on the NSR. (Source: Shipatlas)
Further west along the route, the first-ever conventional Panamax container ship in the Arctic is about halfway through its transit. The vessel had originally intended to also conduct its return voyage via the Arctic, but will now likely have to return to Asia via the Suez Canal or South Africa route.
A massive Capesize bulk carrier without any ice class, Dodo, is also rushing to complete its eastbound voyage to Caofeidian, China.
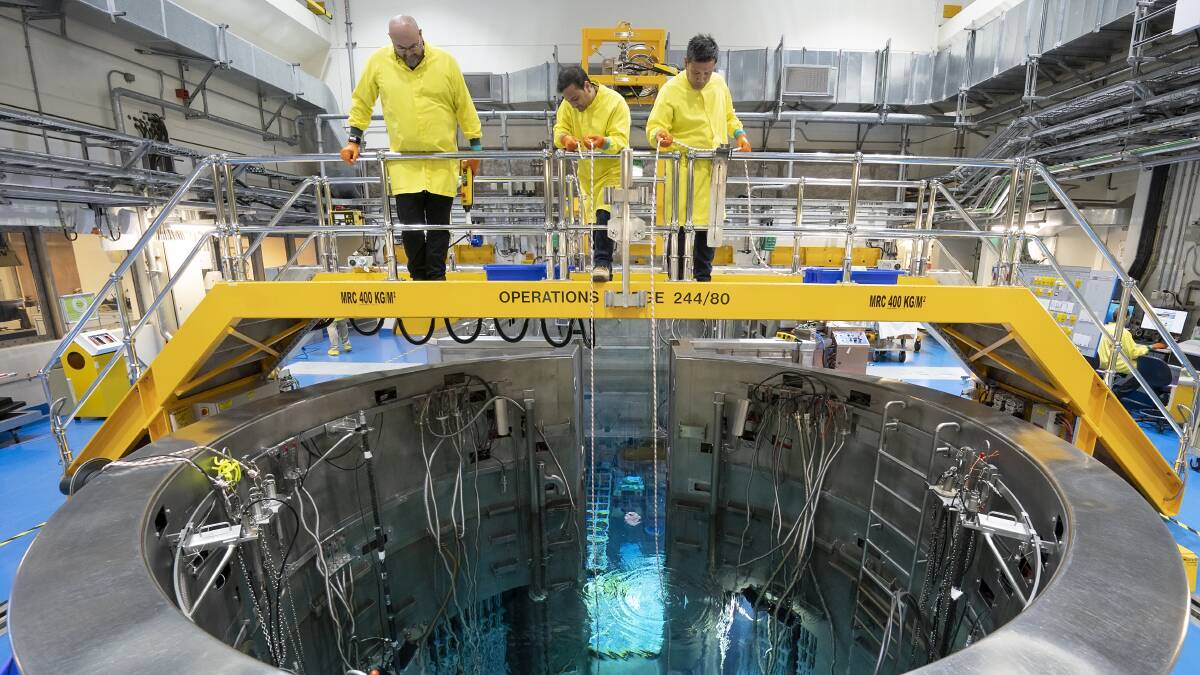
Cliff Reece reports on the reasons for anti-nuclear distortions in his Spectator Australia article Australia is already a successful nuclear nation. Excerpts in italics with my bolds and added images. H/T John Ray
ANSTO – the Australian Nuclear Science and Technology Organisation – recently celebrated 70 years since Australia’s nuclear age began in Sydney. ANSTO is the home of Australia’s most significant landmark and national infrastructure for research. Thousands of scientists from industry and academia benefit from gaining access to state-of-the-art instruments every year.
Thousands of visitors, including many schoolchildren, have safely toured the site at Lucas Heights, which is located 40km southwest of the Sydney CBD. They had the opportunity to learn a great deal about nuclear science as a result of that experience.
I recently became one of those visitors when I was invited to a 3-hour escorted tour of their facilities. As former Executive Director of the National Safety Council of Australia (NSW/ACT) I was particularly interested in their WHS procedures as well as the management of waste, as the latter could impact on the wider community if poorly managed.
What impressed me most was seeing just how advanced we are as a nuclear nation. Despite being relatively small in scale compared to a full civil nuclear energy plant, it has much the same range of issues and complexities to deal with. And it certainly appears to successfully do so at both their Sydney and Melbourne campuses.
The obvious question is, why is the Albanese Labor-Greens government, together with the Teals, opposed to extending our obvious expertise into producing nuclear energy on a commercial scale, as proposed by Opposition Leader Peter Dutton’s LNP?
As you’d expect, there are a number of reasons for both their reluctance to accept nuclear despite it being cheap, reliable and emissions-free and their manic obsession with unreliable, hugely expensive, and environmentally/socially disastrous wind, solar, and battery renewables.
Political factors play a major part. The Greens and Teals are
directly opposed to nuclear, but for different reasons.
The Greens have shown beyond doubt that they want to disrupt society across as many issues as possible. They are doing this on a regular basis – even appearing to stand with crowds that hold sympathies toward recognised terrorist groups.
People who think the Greens are still a well-meaning environmental group like they were under Bob Brown are fooling themselves – they are not!
In the case of the Teals, they started life as political entities via funding from Climate 200, whose primary financial supporters are deeply entrenched in the lucrative and heavily taxpayer-subsidised renewables industry. The Teals are ignorant pawns in the high-stakes game of climate change and the hysterical pursuit of ‘saving the planet’.
There is a lot of money involved in this issue and ordinary Australians are being played by the so-called elites,including left-wing mainstream media such as the ABC.
A good example is the almost total lack of media reporting on the very recent and hugely important US Department of Energy’s Nuclear Lift-off Report that includes significant findings:
The system cost of electricity with nuclear and renewables combination is 30 per cent lower than just renewables.
The jobs from nuclear are 50 per cent higher paying than solar or wind.
Nuclear provides the lowest emissions, is the most reliable form of energy production, has the lowest land use requirement, and lowest material usage.
The report also outlines a pathway for the USA to reach their ambition to triple their nuclear energy capacity by 2050, in direct contradiction of our government’s refusal to even legalise nuclear energy.
It also directly contradicts the policy position of the Albanese government. The report debunks repeated claims that nuclear is ‘too expensive’ and will ‘increase power bills’ and outlines various other benefits of nuclear energy.
The DoE report could not disagree more with Australian anti-nuclear campaigners and the Albanese Labor-Greens government, Teals, and other sources of ignorance.
Their report also completely debunks the much-criticised report produced by CSIRO GenCost that our Minister for Climate Change and Energy, Chris Bowen, refers to constantly as his renewables crusade ‘Bible’. This is despite the fact that the CSIRO GenCost report totally failed to accurately estimate the likely total cost of renewables compared to nuclear.
It also used in its modelling a 30-year life for a nuclear plant instead of the far more accurate 80 years. This created a false financial outcome by not comparing the total cost of nuclear with renewables over an 80-year period.
It also totally neglected the fact that waste management costs for renewables will be many times greater than for nuclear. There will be the need to replace wind turbines and solar panels three or four times during an 80-year period. And who is going to be responsible for dismantling and disposing of the millions of components – some of which have toxic ingredients?
Many people, including some of our top scientists and engineers, believe that the CSIRO GenCost report was simply designed to support the Albanese government’s narrative as depicted in their childish three-eyed fish media splash some months ago.
‘Reckless’: Labor’s nuclear memes ‘undermine AUKUS subs deal’ Labor MPs have been accused of undermining the AUKUS submarine deal with ‘reckless’ anti-nuclear propaganda, as the Coalition calls on Anthony Albanese to rule out a scare campaign. Source: The Courier Mail
We need a government that protects our borders, controls immigration, decreases our cost-of-living, and helps young people to buy their own homes. It’s becoming clearer on a daily basis that none of that will happen under the current Labor-Greens government.
One major impediment to reducing living expenses is the rising cost of energy. Renewables alone will continue to increase the cost of electricity and that will in turn increase the prices paid at our shops and for commercial or residential electricity usage.
Nuclear energy will add to the range of resources available to us – as it has done in many other countries. Nuclear power plants operate in 32 countries and generate about a tenth of the world’s electricity. Most are in Europe, North America, and East Asia. The United States is the largest producer of nuclear power, while France has the largest share of electricity generated by nuclear power, at about 70 per cent.
The only way we are going to catch up with the rest of the world in relation to nuclear energy production is to replace our current government with Peter Dutton’s Liberal-National Coalition. That might be hard to accept for some people – but it’s an undeniable fact.
Wouldn’t you know it — 150 nations signed the Global Methane Pledge without even bothering to check if the methane was man-made.
Methane — the second most hated Greenhouse gas — spiked to record historic levels in the last few years, over 1,900 parts per billion. In 2019, even the WEF scientists admitted they couldn’t explain the baffling rise, and then in 2020, the world of methane went into the twilight zone. We shut down the modern world due to the pandemic, and methane levels rose even faster.
It seems many have been blaming fossil fuels for the global
surge in emissions, but forgot to check the C13 isotopes.
Somehow we spend millions on breathalysing cows, measuring their burps, and feeding them seaweed, but didn’t think to do the basic chemistry. How could that be, you might wonder… 158 nations agreed to cut methane emissions by 30% by 2030, but none of them audited the science even though very strange things were happening. (The point was obviously the “pledge”, the junkets, the captive industries and subsidies, anything but the science).
Methane from fossil fuels has a higher carbon-13 ratio,but even though fossil fuel use was rising, the carbon-13 levels of atmospheric methane was rolling down a hill. Indeed this new study shows it’s been falling for 17 years.
It’s not like this snuck up on us…. any inquiring mind should have seen this coming a decade ago. The lab has been recording C13 in methane since 1998 and gets air samples from 22 sites around the world every week or two.
Microbes in environment drove methane emissions more than fossil fuels between 2020 and 2022, analysis finds
They found that between 2020 and 2022, the drastic increase in atmospheric methane was driven almost entirely by microbial sources. Since 2007, scientists have observed microbes playing a significant role in methane emissions, but their contribution has surged to over 90% starting in 2020.
“Some prior studies have suggested that human activities, especially fossil fuels, were the primary source of methane growth in recent years,” said Xin (Lindsay) Lan…
“These studies failed to look at the isotope profile of methane…
They go on to mention that in a warmer world, bacteria have a higher metabolism, which means they are happier and work faster. Thus, like CO2, if the world warms for any reason at all, methane will rise — and there is nothing we can do about it.
The one last straw they could clutch is that maybe the microbes were “man-made” : It remains unclear whether the increased microbial emissions came from natural sources like wetlands or human-driven sources, such as landfills and agriculture. The team plans to delve deeper to identify the exact source of methane.
As if somehow there was a surge in landfill, rice paddies
or cows in the last few years that no one had noticed.
This is a pretty big deal — methane has supposedly caused about 30% of our current temperature rise (says the broken climate models) yet 90% of that recent rise was microbes. It’s yet another slice of the climate we aren’t controlling, but we’re still designing burgers with mealworms and bacon from fungus, in the hope of reducing methane emissions and controlling the weather. Then it turns out every swamp and square meter of soil is working against us.
Methane concentrations in the air have almost tripled since the 1700s, but that was the Little Ice Age. It’s easy to believe that as the world warmed up, the planet’s wetlands and soil microbes have just been returning to normal business for the last 300 years.
Michel, Sylvia Englund, et al (2024) Rapid shift in methane carbon isotopes suggests microbial emissions drove record high atmospheric methane growth in 2020–2022, Proceedings of the National Academy of Sciences. DOI: 10.1073/pnas.2411212121
Despite massive subsidies and world forums, green power still only represents one-fifth of global energy
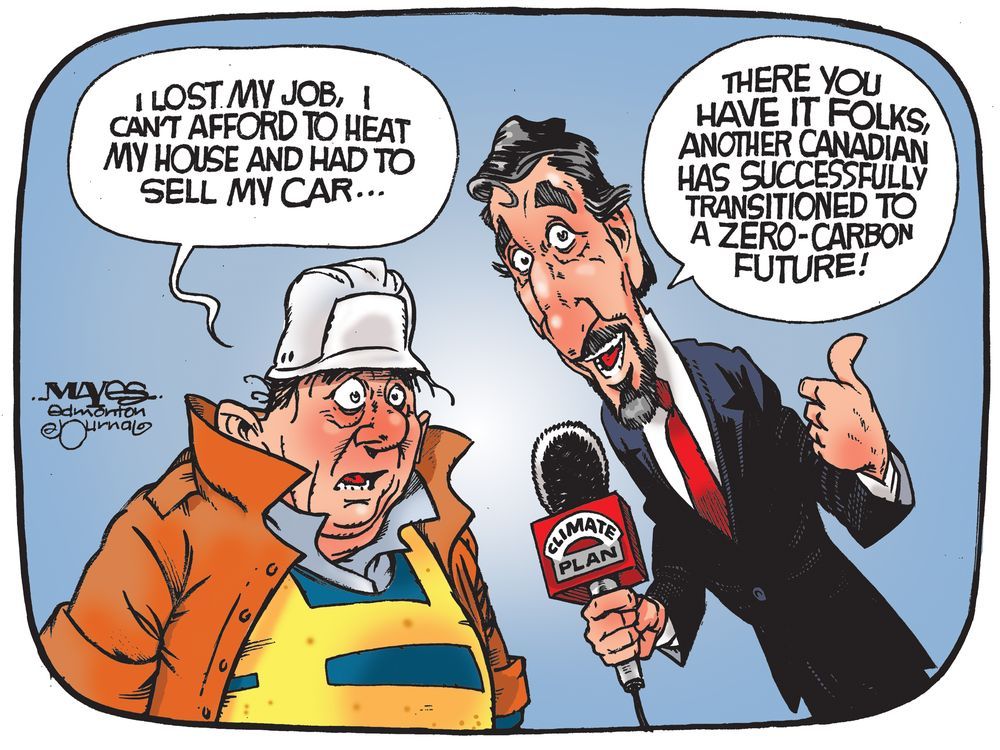
North America, with its vast resources, may be in a position to save the economies of the west. But governments on both sides of the border seem more concerned with green virtue signaling than actually finding a workable approach to carbon emissions that does not undermine our economies and ability to defend ourselves.
The prevailing notion, both in Ottawa and D.C., is that our countries should ignore our resources, and how best to use them, in order to fulfill a messianic vision of massive, rapid emissions reduction.
Canada’s proposed carbon tax, pushed through media at government expense, and zealously promoted by Mark Carney, who thinks mass decarbonization, as epitomized by Europe, provides the road map to prosperity, despite the continent’s consistent economic lethargy.This approach has also poisoned politics as not all provinces are affected equally by the initiative. The institution of the carbon tax and other measures by government and through the relentless pressure of green non-profits, to get a 40 per cent emissions cut by 2030 may be the toast of investment bankers betting on cashing in on forced changes. But for taxpayers, the impact will vary by province. Fossil fuels account for five per cent of Canada’s overall GDP but four times as much in Calgary, Newfoundland and Labrador.
However, as much this appeals to academics and wealth
pearl-clutchers in cities, it translates into higher prices than normal.
As the NDP’s Jagmeet Singh suggested, it places unfair “burdens” on the working class, one reason for his opposition to the tax. Worse still, the biggest green targets of what climatistas label as “industrial carbon” could devastate those same NDP voters — blue collar workers in mining, like manufacturing, logistics and agriculture.
Canada does not need another way to slow its economy. One recent estimate suggests that the proposed $170 a ton proposal would slice 1.8 per cent from the country’s already anemic GDP and cost upwards of 185,000 net jobs. Even Liberals admit something close to a 1 per cent decline. Some may see these draconian attempts to wipe out fossil fuels as the Lord’s work, but on the ground level it seems closer to class warfare.
Trudeau and his supports insist these policies are critical for saving the planet. Yet, attempts to follow such approaches elsewhere have not ended well. In Europe, most obviously Germany, as well as California, the shift to “renewable energy” has led, as it usually does, to high pricesthat already are driving German industry off the continent. Although not nearly as well-endowed with energy as North America, the climate lobby in Europe makes sure to throttle anything, such as offshore oil in the UK — in pursuit of green puritanism.
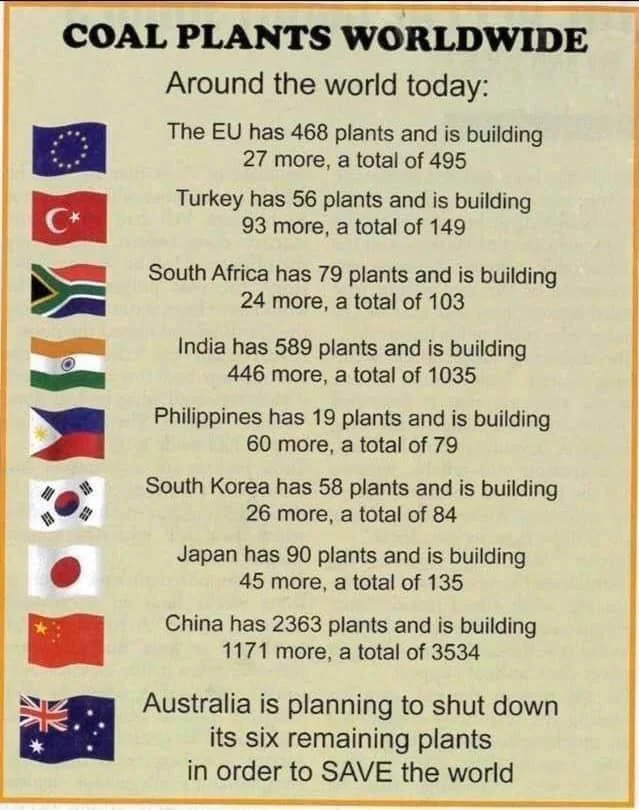
There’s something delusional in many of these initiatives. A key mistake is the common green assertion that fossil fuels are becoming obsolete and should be wiped out for the benefit of fitting a new economy. Yet, in the real world, despite billions in subsidies for “green power,” fossil fuels still represent roughly four fifths of global energy generation, just as it did twenty years ago. This is after expenditures of over one trillion were spent on solar and wind. The West has been reducing per capita emissions for years, but this is utterly subsumed by growth in developing countries, notably China, which not only buys huge amounts of natural gas but continues to open new coal-fired plants at a rapid rate.
North Americans be forewarned that in imposing burdens on themselves, but not competitors, green governments are essentially guaranteeing their own decline. Already in the EU, nearly a million industrial jobs have been lost over the past few years, with investment shifting to countries like China and India, which freely use coal and fossil fuels to keep costs down.
Britain’s path may give the starkest preview of the future Biden and Trudeau have in mind for us. Since 1990 the manufacturing sector’s share of GDP has dropped roughly 50 per cent along with several million jobs. This parallels a two thirds drop in UK energy production, while consumption has fallen by only one third. Three decades ago, a net energy exporter, the UK now increasingly depends on imports from the Middle East and other unstable regions.
The winner here is clearly China, a country that emits more GHG than all developed countries put together. Ironically, carbon reduction policies fit brilliantly into its strategy to use its coal and other fossil fuel energy to power their takeover of the “green economy.” China has placed itself in the catbird’s seat on renewable energy, including utter domination of solar panels and electric vehicles. China already produces twice as many EVs as the US and the EU combined, and seeks to leverage its total domination of the solar-panel industry — its battery capacity is now roughly four times ours. China also exercises effective control of the requisite rare earth minerals and the technologies used to process them.
As the west’s own overpriced EVs sit on lots, China plays us for utter fools as we undermine our own industrial economy. The forced march to EV will be particularly tough on the 125,000 who work in Canada’s car factories. Manufacturing and mining, much of it energy-related, represent, along with real estate, two of the country’s largest industries. Under the current circumstances, they are heading for a spectacular fall. Overall, the EV industry in the U.S. uses 30 per cent less domestic labor than traditional gasoline car manufacturing, and under current circumstances can only hope for some basic assembly work using Chinese components.
These policies will affect every industry and consumer as cars and things like heaters are all forced to electrify. Britain’s shift to EVs is projected to double the demand for electricity by 2040, and its government is already looking to ban the use of home chargers during peak hours. By 2050 in California, state consultants estimate total energy demand will skyrocket, by some estimates rising 60 to 90 per cent. Not surprisingly, the state will face “acute electricity shortages” over the coming decade, according to one recent analysis.
Rising demands for electricity for artificial intelligence seems likely to add to this burden. Microsoft alone is opening a new data centre globally every three days. These power-hungry operations are expected to grow from 4.5 per cent of energy demand to 10 per cent by 2035. Artificial intelligence and data center demand are leading to massive expansions in projected energy use around the world at a time of restricted supply. Google, renowned for its green virtue signaling, has boosted its own emissions by 50 per cent since 2019.
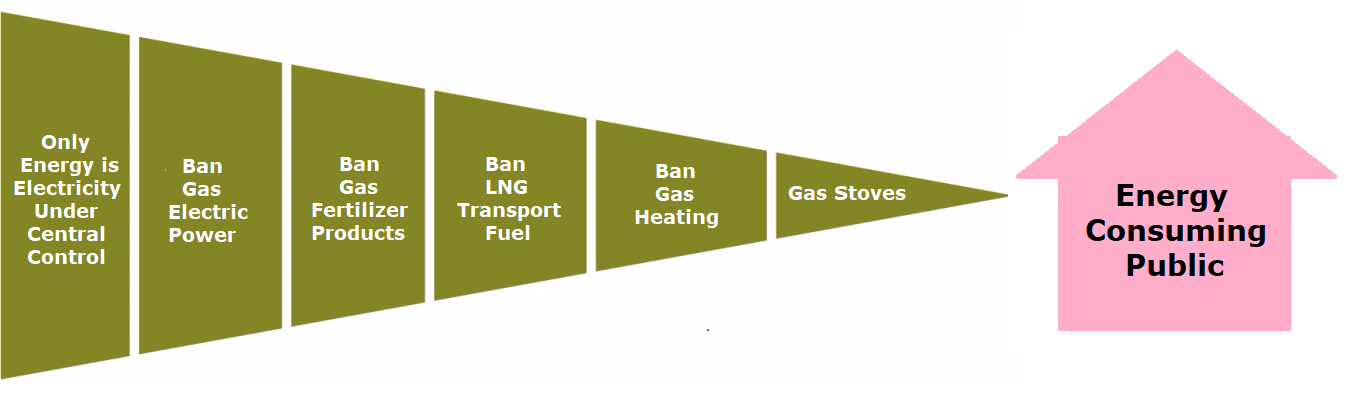
Ultimately, the oligarchs will likely get their juice from sources like decommissioned nuclear energy, while the average family will take the economic hit in order to fulfill the agenda pushed by the likes of Steve Jobs’ widow, Lauren, Michael Bloomberg, the Rockefellers, Jeff Bezos and venture capitalist John Doerr. These, and other oligarchic allies, are waging a sophisticated and well-financed media and institutional campaign to catastrophize the climate issue as a way to ban gas stoves, stop new LNG facilities, and crack down on plastics.
Finally, there is the issue of security, particularly relevant in an age of declining western power. The new green mandates, if adopted, presage yet another force to further reduce the industrial prowess of western countries, while driving more industries to China, India, and other countries who produce their goods with dirtier fuels and develop resources with less environmental care. At the same time, third world countries, for the most part, are not embracing “net zero,” as it is totally infeasible for them and will likely resist western lectures on climate policy.
All of this is occurring as a concert of ugly energy producers — Russia, Iran, and Venezuela— press their advantage on western countries. They stand to benefit from continued de-industrialization as one way to further weaken the military capacity of the west. Taking away North American liquified natural gas from Europe simply makes the continent more dependent on such malefactors as Qatar, a primary backer of terrorists and their supporters, and may lead the west, hat in hand, to beg from even worse regimes, like Russia and Iran.
The good news — while green virtue-signaling may appeal to Trudeau, Biden, and Harris — these policies could be impacted by political realities. Worried about voters in industrial states like Michigan and Pennsylvania, Harris, even as she embraces environmental bromides, has backed away from EV mandates and opposition to fracking, albeit with dubious credibility. Yet, perhaps she realizes, or those around her do, that these policies do not sell well compared to promoting more affordable and reliable energy.Trudeau, if he wants to remain relevant, may similarly need to flip the script if he hopes to forestall an utter political defeat.
Hot, Hot, Hot. You will have noticed that the term “climate change” is now synonymous with “summer”. Since the northern hemisphere is where most of the world’s land, people and media are located, two typical summer months and a hot European August have been depicted as the fires of hell awaiting any and all who benefit from fossil fuels. If you were wondering what the media would do, apart from obsessing over the many small storms this year, you are getting the answer.
Fortunately, Autumn is on the way and already bringing cooler evenings in Montreal where I live. Once again open windows provide fresh air for sleeping, while mornings are showing condensation, and frost sometimes. This year’s period of “climate change” is winding down. Unless of course, we get some hurricanes the next two months. Below is a repost of seasonal changes in temperature and climate for those who may have been misled by the media reports of a forever hotter future.
Autumnal Climate Change
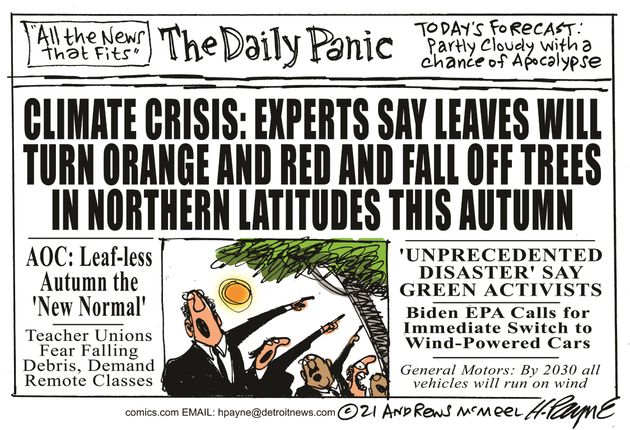
Seeing a lot more of this lately, along with hearing the geese honking. And in the next week or two we expect that trees around here will lose their leaves. It definitely is climate change of the seasonal variety.
Interestingly, the science on this is settled: It is all due to reduction of solar energy because of the shorter length of days (LOD). The trees drop their leaves and go dormant because of less sunlight, not because of lower temperatures. The latter is an effect, not the cause.
Of course, the farther north you go, the more remarkable the seasonal climate change. St. Petersburg, Russia has their balmy “White Nights” in June when twilight is as dark as it gets, followed by the cold, dark winter and a chance to see the Northern Lights.
And as we have been monitoring, the Arctic ice has been melting from sunlight in recent months, but is already building again in the twilight, to reach its maximum in March under the cover of darkness.
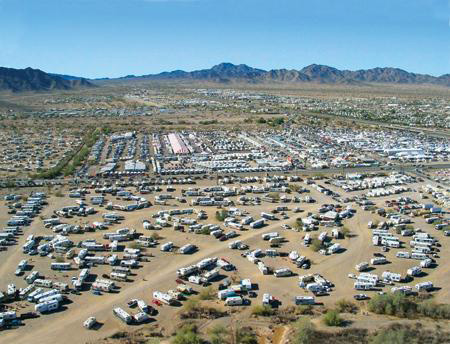
We can also expect in January and February for another migration of millions of Canadians (nicknamed “snowbirds”) to fly south in search of a summer-like climate to renew their memories and hopes. As was said to me by one man in Saskatchewan (part of the Canadian wheat breadbasket region): “Around here we have Triple-A farmers: April to August, and then Arizona.” Here’s what he was talking about: Quartzsite Arizona annually hosts 1.5M visitors, mostly between November and March.
Of course, this is just North America. Similar migrations occur in Europe, and in the Southern Hemisphere, the climates are changing in the opposite direction, Springtime currently. Since it is so obviously the sun causing this seasonal change, the question arises: Does the sunlight vary on longer than annual timescales?
The Solar-Climate Debate
And therein lies a great, enduring controversy between those (like the IPCC) who dismiss the sun as a driver of multi-Decadal climate change, and those who see a connection between solar cycles and Earth’s climate history. One side can be accused of ignoring the sun because of a prior commitment to CO2 as the climate “control knob”.
The other side is repeatedly denounced as “cyclomaniacs” in search of curve-fitting patterns to prove one or another thesis. It is also argued that a claim of 60-year cycles can not be validated with only 150 years or so of reliable data. That point has weight, but it is usually made by those on the CO2 bandwagon despite temperature and CO2 trends correlating for only 3 decades during the last century.
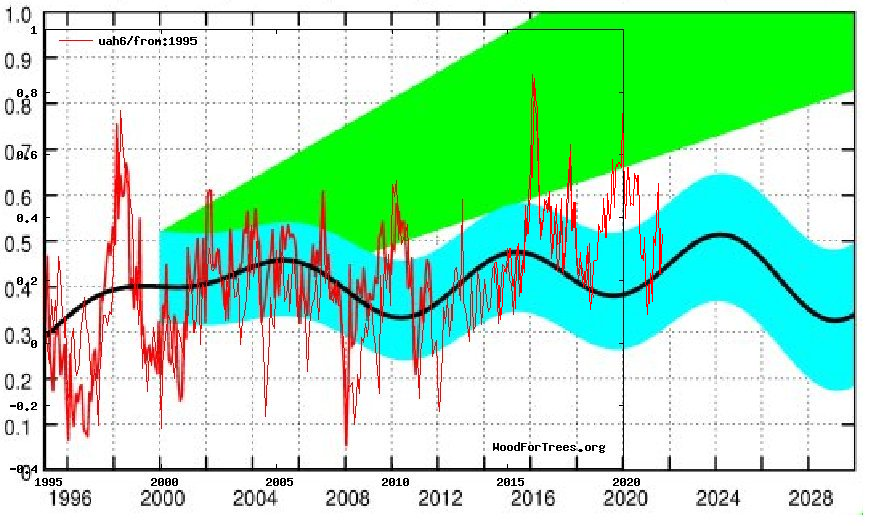
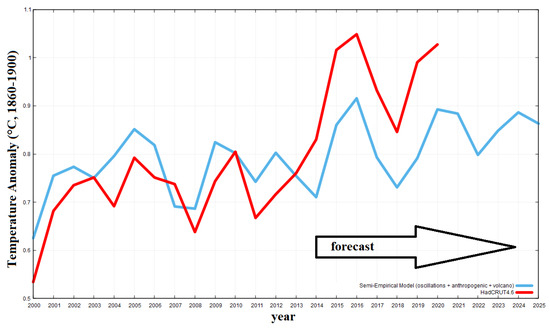
One scientist in this field is Nicola Scafetta, who presents the basic concept this way:
“The theory is very simple in words. The solar system is characterized by a set of specific gravitational oscillations due to the fact that the planets are moving around the sun. Everything in the solar system tends to synchronize to these frequencies beginning with the sun itself. The oscillating sun then causes equivalent cycles in the climate system. Also the moon acts on the climate system with its own harmonics. In conclusion we have a climate system that is mostly made of a set of complex cycles that mirror astronomical cycles. Consequently it is possible to use these harmonics to both approximately hindcast and forecast the harmonic component of the climate, at least on a global scale. This theory is supported by strong empirical evidences using the available solar and climatic data.”
He goes on to say:
“The global surface temperature record appears to be made of natural specific oscillations with a likely solar/astronomical origin plus a noncyclical anthropogenic contribution during the last decades. Indeed, because the boundary condition of the climate system is regulated also by astronomical harmonic forcings, the astronomical frequencies need to be part of the climate signal in the same way the tidal oscillations are regulated by soli-lunar harmonics.”
He has concluded that “at least 60% of the warming of the Earth observed since 1970 appears to be induced by natural cycles which are present in the solar system.” For the near future he predicts a stabilization of global temperature and cooling until 2030-2040. Note that several El Nino spikes have temporarily taken the GMT (Global Mean Temperature) anomaly outside the forecasted bounds.
A Deeper, but Accessible Presentation of Solar-Climate Theory
I have found this presentation by Ian Wilson to be persuasive while honestly considering all of the complexities involved.
The author raises the question: What if there is a third factor that not only drives the variations in solar activity that we see on the Sun but also drives the changes that we see in climate here on the Earth?
The linked article is quite readable by a general audience, and comes to a similar conclusion as Scafetta above: There is a connection, but it is not simple cause and effect. And yes, length of day (LOD) is a factor beyond the annual cycle.
It is fair to say that we are still at the theorizing stage of understanding a solar connection to earth’s climate. And at this stage, investigators look for correlations in the data and propose theories (explanations) for what mechanisms are at work. Interestingly, despite the lack of interest from the IPCC, solar and climate variability is a very active research field these days.
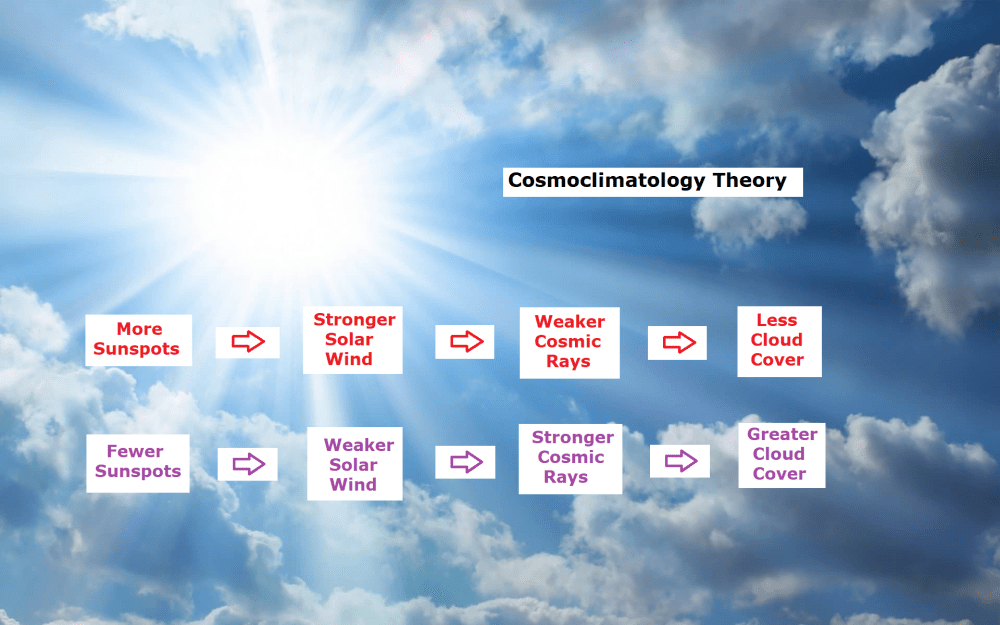
For example Svensmark has now a Cosmosclimatology theory supported by empirical studies described in more detail in the red link.
Once again, it appears that the world is more complicated than a simple cause and effect model suggests.
Fluctuations in observed global temperatures can be explained by a combination of oceanic and solar cycles. See engineering analysis from first principles Quantifying Natural Climate Change.
For everything there is a season, a time for every purpose under heaven.
What has been will be again, what has been done will be done again;
there is nothing new under the sun. (Ecclesiastes 3:1 and 1:9)


 But: Sea Level Rise is not accelerating.


 Cliff Reece reports on the reasons for anti-nuclear distortions in his Spectator Australia article
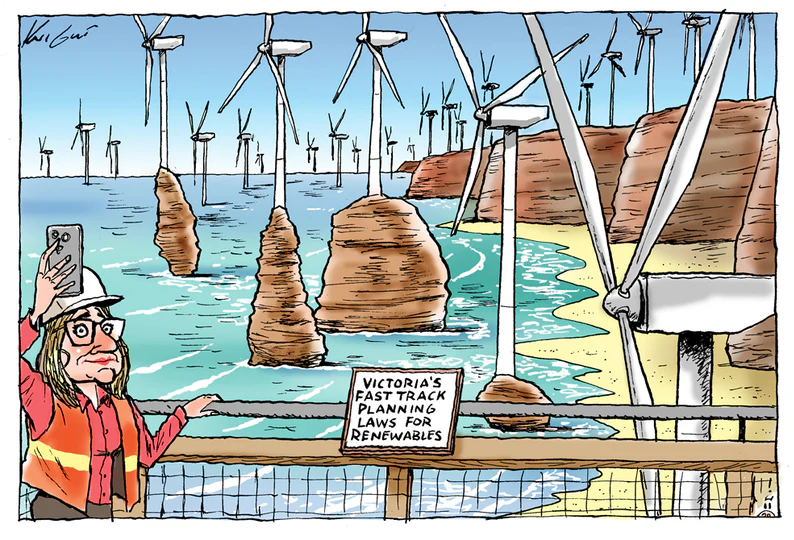


 Canada does not need another way to slow its economy. One