Depravity of Net Zero Agenda
From Daily Sceptic The Real ‘Climate Change Deniers’ Are Those Who Deny the Climate Changed Before We Started Burning Fossil Fuels, Says Geologist. Excerpts in italics with my bolds and added images.
“We need to be resilient”
As a geologist, Wielicki undoubtedly has a better-than-average understanding of how our planet has evolved in the first place, and how its climate has been in a constant state of flux. Today’s climate science, however, links climate change primarily to the increasing amount of CO2 in the atmosphere, especially its anthropogenic component. Scientists who doubt or dispute this are labelled climate deniers. Wielicki points out that we know very well from Earth’s relatively recent history that major climate changes, such as the Medieval Warm Period (ca. 950-1250) or the subsequent Little Ice Age (ca. 14th to mid-19th century, precise timing depending on the location), occurred without any significant change in the proportion of CO2 in the atmosphere.
 “If there’s anything that I argue, it’s that we need to be resilient. We should stop pretending that if we changed or lowered our emissions the climate would stop changing. That’s the true denial of climate right there,” Wielicki says. “What we need to accept is that regardless of the CO2 in the atmosphere, we are going to have climate change and those shifts could occur over timescales of decades or centuries, and we should be prepared.

And being prepared means we need access to cheap, reliable energy.
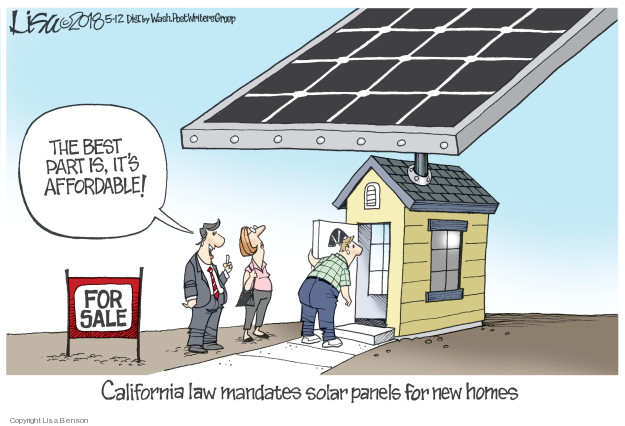
But the world is moving in the opposite direction under the leadership of today’s political leaders. One of the main objectives is to fight CO2 emissions and to do so by phasing out fossil fuels, among other measures. However, according to Wielicki, the planners have not quite thought everything through. First of all, wind and solar power are unreliable substitutes because they can only be produced when the conditions are right, i.e., when the wind blows and the sun shines. In addition, they need constant support from the taxpayer, because when they can be produced, i.e., sold as energy to the grid, the price of electricity on the market will be low since there is a lot of it at that particular time. So in order for investors to build up these capacities, they need price guarantees from governments or taxpayer support. And on top of that, you still need to additionally build up controllable capacity to ensure that electricity is always available.

Wielicki also says that we need to understand that fossil fuels are not just liquids that we put in our cars at the petrol station but are essential to many aspects of our lives. “About four billion people on the planet are being fed off of agricultural crops that are being fertilised with synthetic fertilizers that are being created from fossil fuels. So you can’t just look at one side of a picture,” Wielicki explains, adding that the increases in atmospheric CO2 levels have actually also increased yields.
In addition, Wielicki says, it is worth thinking that we need to replace many of today’s fossil-fuel-based materials in everyday use, such as plastics, lubricants, oils, chemicals, etc., with new ones if we really want to phase out fossil fuels. “We have to ask what are the benefits that fossil fuels have given the society? And then let’s weigh that against the possible detrimental effects that these climate models argue will happen, but haven’t happened in the observable data yet,” he says.

The rise of the new green colonialism
Programmed into this whole Western orientation towards CO2 reduction, Wielicki says, is hypocrisy on several levels. For a start, it’s worth recognising that by reducing CO2 emissions in Europe or North America, we have effectively decided that we do not produce the goods we need here, but will produce them elsewhere in the world. “We pat ourselves on the back and say: look, we’ve lowered our CO2 emissions by this much! But all we’ve done is essentially offshored that industry to China and India, They do it dirtier. They have no regard for things like environmental policy. And so the global CO2 is going up faster than ever,” Wielicki notes.
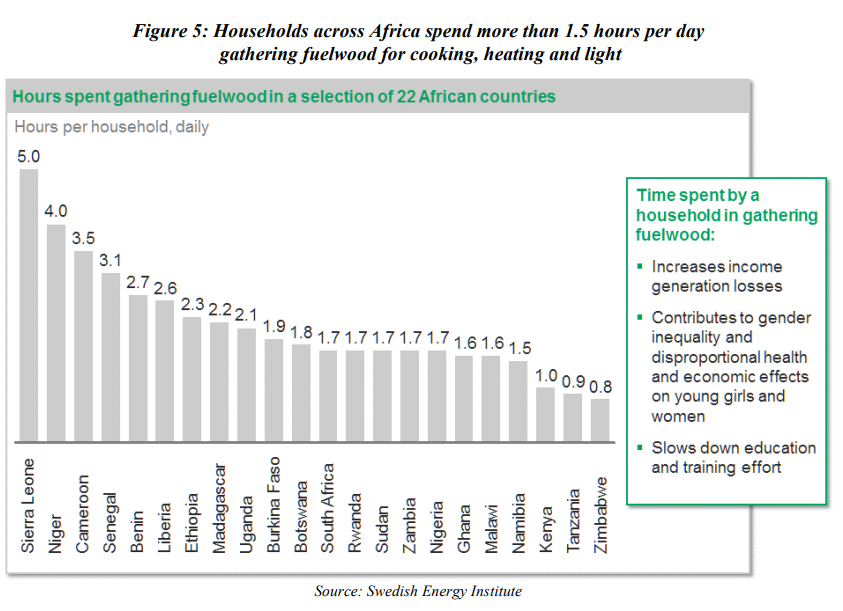
While the big Asian countries are ramping up the use of coal to satisfy their energy appetite, many African countries don’t have a similar option. According to Wielicki, this is directly linked to the UN’s policy of not wanting these countries to increase their use of fossil fuels. This means, for example, that farm work that is done elsewhere by tractor still has to be done by many Africans with their hands. A large proportion of Africans also have little or no access to electricity. Food is cooked indoors on open fires, burning dung and wood.
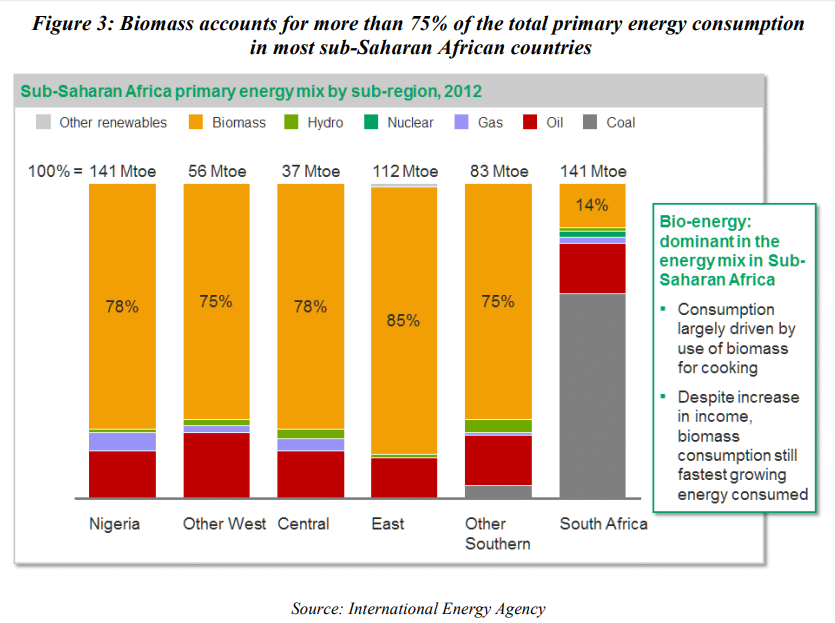
The resulting smoke leads to respiratory illnesses and many people die as a result. All this could be easily avoided, according to Wielicki, by giving them access to propane bottles and gas cookers. “It might make them breathe easier at night. It might make their health better. But it’s going to increase the atmospheric CO2, and that is something we can’t have. These poor people must suffer and live in poverty because we need to save the planet. It’s so hypocritical,” Wielicki says.
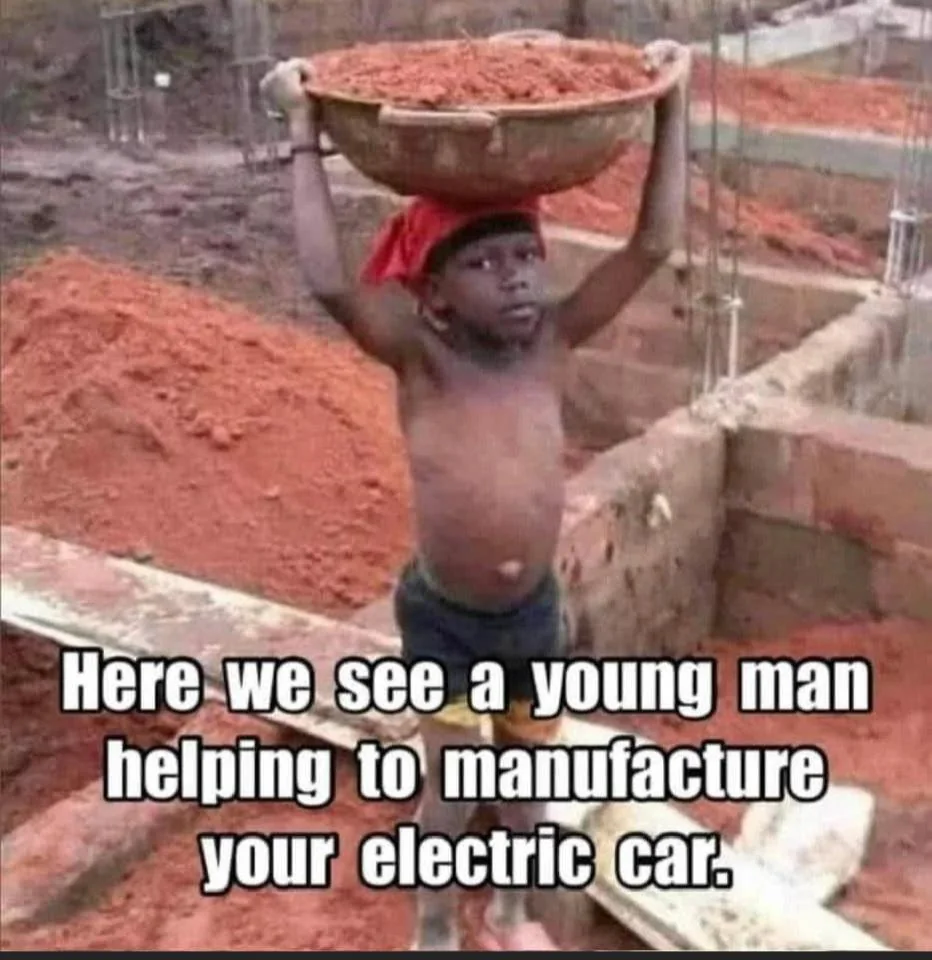
What’s more, according to Wielicki, our hypocrisy lies in the fact that at the same time, we want to mine the minerals we need for our own energy transition, such as cobalt, in that very same Africa. “We’re switching to very mineral and energy intensive technologies like solar panels and electric vehicles. And we’re taking all of these raw materials from Africa,” he says. “I think this is going to be, probably, the legacy of this green revolution. I call it the new green colonialism. It’s unfortunately going to keep hundreds of millions of poor people in developing nations in poverty for decades longer than they ever needed to be,” Wielicki adds.
 Today we have a coordinated release globally of a study claiming to disprove the Covid 19 virus came from the Wuhan Institute of Viology (WIV). An example is the article from the UK so-called Independent


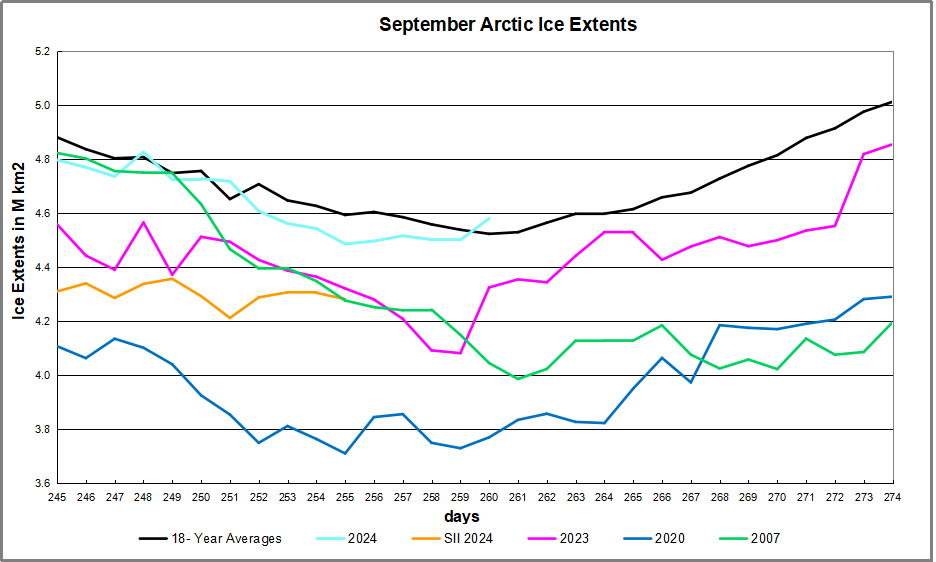


 The table below shows the distribution of Sea Ice on day 260 across the Arctic Regions, on average, this year and 2007. At this point in the year, Bering and Okhotsk seas are open water and thus dropped from the table.


 Kip Hansen gives the game away in his Climate Realism article


Two seemingly mutually excluding theories of SARS-CoV2 origin are now a matter of a heated debate.
On one hand, scientists siding with the lab-leak idea are bringing up a lot of reasonable but circumstantial evidence in favor it. There is no real way to prove the leak until an unbiased commission of researchers inspects the potential sites and lab records. That is unlikely to happen, and the problem may be never solved, unless another leak, next time a leak of critical information happens.
On the other hand, a seemingly large group of scientists supports the natural origin of the COVID19 pandemics. The key point here is that they also do not have a direct evidence of SARS-CoV2 being transmitted to humans through an intermediate host in a manner similar to what was found before for SARS and MERS viruses.
The debate becomes more and more heated, not at the least being motivated by non-scientific reasons. Major journals publish unbalanced editorials favoring ‘natural origin’ theory that so far has not produced the fatal blow to the opposite view. It is argued that it is hard to find a needle in the haystack (an animal that is an intermediate host for SARS-CoV2), but this is the real source of uncertainty.
For an unbiased critical mind, it is impossible to take sides in this debate simply because both previous lab leaks (including of SARS virus) and a natural transmission through intermediate hosts of human SARS and MERS coronaviruses have been documented. If one wants to convince that unbiased critical mind of the natural origin of human SARS-CoV2 – show us the money!
Find the intermediate host, find the virus, explain in molecular terms
how it got the furin cleavage site, or better continue working hard.
The article by Michael Worobey is an example of delivering arguments that can hardly make a dent in the leak theory for the following reasons:
Calm, however, is an unlikely outcome of this debate. My argument is that scientific thinking and integrity should come first. It is really tiring to read the numerous editorials and letters that are unilateral with no substance. I rest my case totally prepared to be convinced one way or another by solid direct evidence.