You Won’t Survive “Sustainability” Agenda 2024

Joel Kotkin explains in his Spiked article The inhumanity of the green agenda.  Excerpts in italics with my bolds and added images.

The ‘sustainability’ regime is impoverishing the world.

In recent years, the overused word ‘sustainability’ has fostered a narrative in which human needs and aspirations have taken a back seat to the green austerity of Net Zero and ‘degrowth’. The ruling classes of a fading West are determined to save the planet by immiserating their fellow citizens. Their agenda is expected to cost the world $6 trillion per year for the next 30 years.

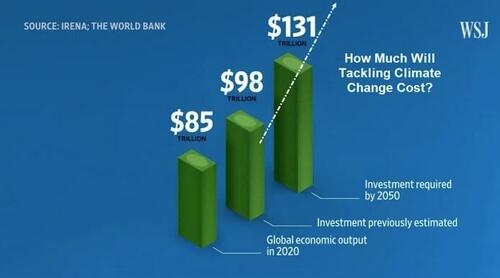
Yes, those are Trillions of US$ they are projecting to spend.

Meanwhile, they will get to harvest massive green subsidies
and live like Renaissance potentates.

In Enemies of Progress, author Austin Williams suggests that ‘the mantra of sustainability’ starts with the assumption that humanity is ‘the biggest problem of the planet’, rather than the ‘creators of a better future’. Indeed, many climate scientists and green activists see having fewer people on the planet as a key priority. Their programme calls not only for fewer people and fewer families, but also for lower consumption among the masses. They expect us to live in ever smaller dwelling units, to have less mobility, and to endure more costly home heating and air-conditioning. These priorities are reflected in a regulatory bureaucracy that, if it does not claim justification from God, acts as the right hand of Gaia and of sanctified science.

The question we need to ask is: sustainability for whom?

US Treasury secretary Janet Yellen recently suggested that her department sees climate change as ‘the greatest economic opportunity of our time’. To be sure, there is lots of gold in green for the same Wall Street investors, tech oligarchs and inheritors who fund the campaigns of climate activists. They increasingly control the media, too. The Rockefellers, heirs to the Standard Oil fortune, and other ultra-wealthy greens are currently funding climate reporters at organs like the Associated Press and National Public Radio.

Under the new sustainability regime, the ultra-rich profit, but the rest of us not so much. The most egregious example may be the forced take-up of electric vehicles (EVs), which has already helped to make Elon Musk, CEO of Tesla, the world’s second-richest man. Although improvements are being made to low-emissions vehicles, consumers are essentially being frogmarched into adopting a technology that has clear technical problems, remains far more expensive than the internal-combustion engine and depends primarily on an electric grid already on the brink of blackouts. Green activists, it turns out, do not expect EVs to replace the cars of hoi polloi. No, ordinary people will be dragooned to use public transport, or to walk or bike to get around.  [BMW will come to mean “Bike, Metro, and Walking.”]

The shift to electric cars is certainly no win for the West’s working and middle classes. But it is an enormous boon to China, which enjoys a huge lead in the production of batteries and rare-earth elements needed to make EVs, and which also figure prominently in wind turbines and solar panels. China’s BYD, which is backed by Warren Buffett, has emerged as the world’s top EV manufacturer, with big export ambitions. Meanwhile, American EV firms struggle with production and supply-chain issues, in part due to green resistance to domestic mining for rare-earth minerals. Even Tesla expects much of its future growth to come from its Chinese factories.

Building cars from primarily Chinese components will have consequences for autoworkers across the West. Germany was once a car-manufacturing giant, but it is expected to lose an estimated 400,000 car-factory jobs by 2030. According to McKinsey, the US’s manufacturing workforce could be cut by up to 30 per cent. After all, when the key components are made elsewhere, far less labour is needed from US and European workers. It’s no surprise that some European politicians, worried about a popular backlash, have moved to slow down the EV juggernaut.

This dynamic is found across the entire sustainability agenda. The soaring energy costs in the West have helped China expand its market share in manufactured exports to roughly equal that of the US, Germany and Japan combined. American manufacturing has dropped recently to its lowest point since the pandemic. The West’s crusade against carbon emissions makes it likely that jobs, ‘green’ or otherwise, will move to China, which already emits more greenhouse gases than the rest of the high-income world.

Meanwhile, the Chinese leadership is looking to adapt to changes in the climate,
instead of undermining economic growth chasing implausible Net Zero targets.

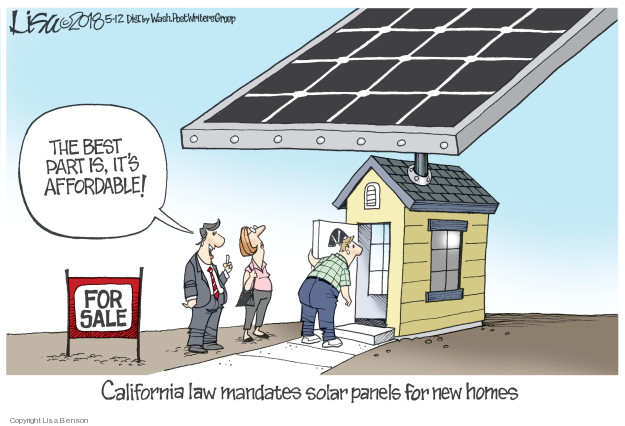
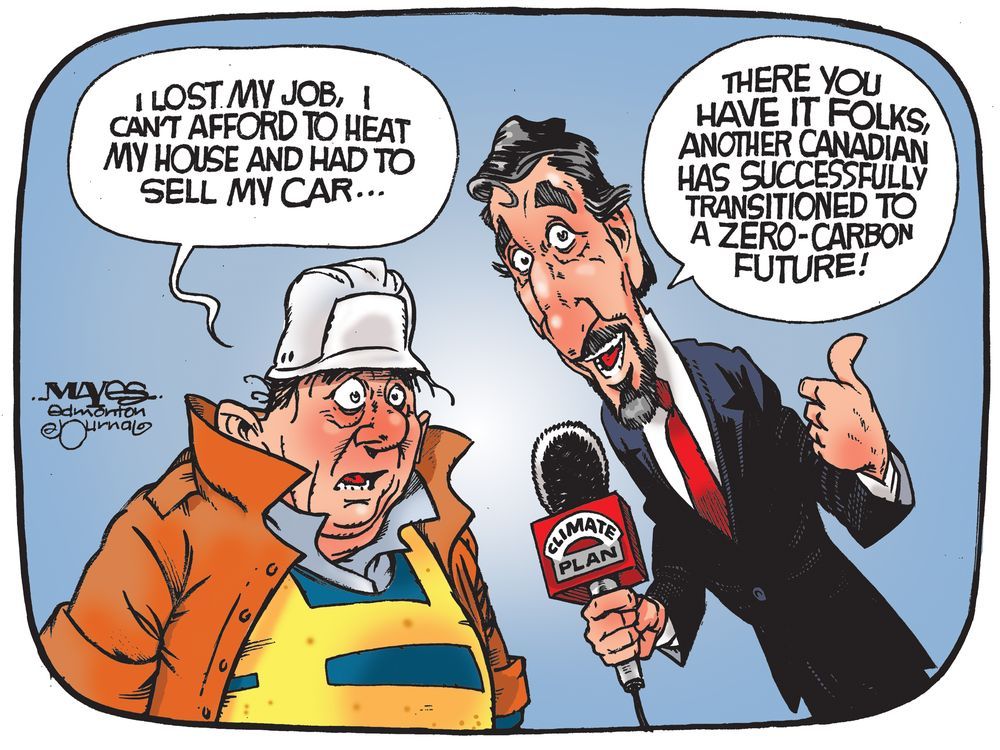
There are clear class implications here. California’s regulators recently admitted that the state’s strict climate laws aid the affluent, but hurt the poor. These laws also have a disproportionate impact on ethnic-minority citizens, creating what attorney Jennifer Hernandez has labelled the ‘green Jim Crow’. As China’s increasingly sophisticated tech and industrial growth is being joyously funded by US venture capitalists and Wall Street, living standards among the Western middle class are in decline. Europe has endured a decade of stagnation, while Americans’ life expectancy has recently fallen for the first time in peacetime. Deutsche Bank’s Eric Heymann suggests that the only way to achieve Net Zero emissions by 2050 is by squelching all future growth, which could have catastrophic effects on working-class and middle-class living standards.

Rather than the upward mobility most have come to expect, much of the West’s workforce now faces the prospect of either living on the dole or working at low wages. Today, nearly half of all American workers receive low wages and the future looks worse. Almost two-thirds of all new jobs in recent months were in low-paying service industries. This is also true in Britain. Over recent decades, many jobs that might have once supported whole families have disappeared. According to one UK account, self-employment and gig work do not provide sustenance for anything like a comfortable lifestyle. Rates of poverty and food shortages are already on the rise.

As a result, most parents in the US and elsewhere doubt their children
will do better than their generation,
while trust in our institutions is at historic lows.

The fabulists at places like the New York Times have convinced themselves that climate change is the biggest threat to prosperity. But many ordinary folk are far more worried about the immediate effects of climate policy than the prospect of an overheated planet in the medium or long term. This opposition to the Net Zero agenda was first expressed by the gilet jaunes movement in France in 2018, whose weekly protests were initially sparked by green taxes. This has been followed by protests by Dutch and other European farmers in recent years, who are angry at restrictions on fertilisers that will cut their yields. The pushback has sparked the rise of populism in a host of countries, notably Italy, Sweden and France. Even in ultra-with-it Berlin, a referendum on tighter-emissions targets recently failed to win over enough voters.

This is class warfare obscured by green rhetoric.
It pits elites in finance, tech and the nonprofit world against
a more numerous, but less connected, group of ordinary citizens.

Many of these folk make their living from producing food and basic necessities, or from hauling these things around. Factory workers, truck drivers and farmers, all slated for massive green regulatory onslaughts, see sustainability very differently than the urban corporate elites and their woke employees. As the French gilets jaunes protesters put it bluntly: ‘The elites worry about the end of the world. We worry about the end of the month.’

This disconnect also exists in the United States, according to long-time Democratic analyst Ruy Teixeira. Attempts to wipe out fossil fuels may thrill people in San Francisco, but are regarded very differently in Bakersfield, the centre of the California oil industry, and in Texas, where as many as a million generally good-paying jobs could be lost. Overall, according to a Chamber of Commerce report, a full national ban on fracking, widely supported by greens, would cost 14 million jobs – far more than the eight million jobs lost in the Great Recession of 2007-09.

No surprise then that blue-collar workers are not so enthusiastic
about the green agenda.

Just one per cent, according to a new Monmouth poll, consider climate as their main concern. A new Gallup poll shows that just two per cent of working-class respondents say they currently own an electric vehicle and a mere nine per cent say they are ‘seriously considering’ purchasing one.

These Western concerns are nothing compared to how the sustainability agenda could impact the developing world. Developing countries are home to roughly 3.5 billion people with no reliable access to electricity. They are far more vulnerable to high energy and food prices than we are. For places like Sub-Saharan Africa, green admonitions against new agricultural technologies, fossil fuels and nuclear power undermine any hope of creating desperately needed new wealth and jobs. It’s no wonder that these countries increasingly ignore the West and are looking to China instead, which is helping the developing world to build new fossil-fuel plants, as well as hydroelectric and nuclear facilities. All of this is anathema to many Western greens.

To make matters worse, the EU is already considering carbon taxes on imports,
which could cut the developing world off from what remains of global markets.

More critical still could be the impact of the sustainability mantra on food production, particularly for Sub-Saharan Africa, which will be home to most of the world’s population growth over the next three decades, according to United Nations projections. These countries need more food production, either domestically or from rich countries like the US, the Netherlands, Canada, Australia and France. And they are acutely aware of what happened when Sri Lanka adopted the sustainability agenda. This led to the breakdown of Sri Lanka’s agricultural sector and, eventually, to the violent overthrow of its government.

We need to rethink the sustainability agenda. Protecting the environment cannot come at the cost of jobs and growth. We should also assist developing countries in achieving a more prosperous future. This means financing workable technologies – gas, nuclear, hydro – that can provide the reliable energy so critical for economic development. It does no good to suggest a programme that will keep the poor impoverished.

Unless people’s concerns about the green agenda are addressed, they will almost certainly seek to disrupt the best-laid plans of our supposedly enlightened elites. In the end, as Protagoras said, human beings are still the ultimate ‘measure’ of what happens in the world – whether the cognoscenti like it or not.


Arctic Ice Persists May 2024

Research ship drifting along with Arctic ice, May 2019 US Naval Institute

In May, most of the Arctic ocean basins are still frozen over, while the melting of ice extent is underway in the marginal regions.   During May, on average according to MASIE, Arctic ice extents lose 1.7 M km2, and 2024 matched that.  The few basins where open water appears this time of year tend to fluctuate and alternate waxing and waning.  Unusual were the much greater extents estimated by SII (Sea Ice Index, the satellite dataset)

The graph below shows for the month of May patterns for ice extents on average, this year and some other years of note.

The graph shows the 18-year average loss for April is 1.7M km2.  2024 tracked nearly average this month throughout. Remarkably, SII showed higher all month, ~200k km2 on average and 315k km2 higher than MASIE yesterday. Other recent years have been nearly average, while 2006 ended with a large defict of ~300k km2 below average.

Region 2024152 Day 152 Ave 2024-Ave. 2006152 2024-2006
 (0) Northern_Hemisphere 11720589 11685746 34843 11391134 329455
 (1) Beaufort_Sea 1015932 1008887 7045 1063879 -47947
 (2) Chukchi_Sea 913510 866924 46586 907609 5900
 (3) East_Siberian_Sea 1072016 1065772 6244 1073889 -1873
 (4) Laptev_Sea 828093 828959 -866 856108 -28016
 (5) Kara_Sea 885435 822185 63250 848172 37263
 (6) Barents_Sea 444502 301553 142948 180906 263596
 (7) Greenland_Sea 641881 584813 57067 522040 119841
 (8) Baffin_Bay_Gulf_of_St._Lawrence 880982 888621 -7639 721606 159376
 (9) Canadian_Archipelago 777801 813422 -35621 800561 -22760
 (10) Hudson_Bay 902359 1082841 -180482 968121 -65762
 (11) Central_Arctic 3232002 3219651 12351 3188696 43306
 (12) Bering_Sea 102241 112773 -10532 166326 -64085
 (13) Baltic_Sea 285 177 108 720 -435
 (14) Sea_of_Okhotsk 22088 87670 -65582 89739 -67651

The table shows regional ice extents in km2.  Note that Hudson and Baffin Bays have started melting, and Hudson is ahead of normal and will likely go to open water in a few weeks. Sea of Okhotsk on the Pacific side is 66k in deficit, with little ice left to lose.  Note the huge surplus in Barents sea on the European side. Everywhere else is mostly in surplus, especially the seas of Barents, Greenland and Kara.  2006 had 329k km2 less ice extent than 2024 (one third of a Wadham).

The polar bears had a Valentine Day’s wish for Arctic Ice.

welovearcticicefinal

And Arctic Ice loves them back, returning every year so the bears can roam and hunt for seals.

Footnote:

Seesaw accurately describes Arctic ice in another sense:  The ice we see now is not the same ice we saw previously.  It is better to think of the Arctic as an ice blender than as an ice cap, explained in the post The Great Arctic Ice Exchange.

Sunrise over frozen Bering Sea

Biden’s Dangerous NatGas Game

Tristan Abbey exposes the feds war on NatGas in his Real Energy article Joe Biden’s Dangerous Natural Gas Game.  Excerpts in italics with my bolds and added images.

If the devil is in the details, bureaucracy is hell on earth. Though terrain familiar to the Biden administration, Republicans must prepare to navigate it.

Witness the debacle over liquefied natural gas exports, wherein the White House, by “pausing” most new approvals, has catapulted the energy security of key U.S. allies straight into the buzzsaw of its climate ambitions. (The category of exports that will continue to be authorized is tiny.) The Department of Energy claims that a multifactor impact study due in early 2025 is required to determine whether and how the moratorium will be lifted.

For the 58 year period, the net changes were: Oil 194%, Gas 525%, Coal 178%, WFFC 239%, Primary Energy 287%  Source: Energy Institute stats 2022

Under a certain conception of executive power, it should be simple enough for a second-term Trump administration to end this national embarrassment by pressing “resume” on the authorization process. But as analysts at the Center for Strategic and International Studies have suggested, merely setting aside the study could provide a basis, however tenuous, for future litigation. In the modern administrative state, it is easier to open than shut the procedural door to delays.

Previous administrations have already published macroeconomic impact studies on the question of LNG exports from the U.S. The Obama administration paused its authorizations until its first study was released in December 2012, for example—curious timing, considering the election the previous month and the study’s actual completion in July of that year. Virtually every scenario in every study, including additional analysis in 2015 and 2018, has found net benefits to accrue.

It’s possible reopening the Obama playbook was the Biden team’s plan all along. After all, Secretary Granholm didn’t commission a new study in 2021, or in 2022, or in 2023. By waiting so long, the DOE can now claim that the cumulative volume of its authorizations is approaching the upper limit of the range that the 2018 study examined. Under the duplicity theory, approvals resume under a second Biden term as soon as the study is released and the election fades away.

But maybe the administration doesn’t even have a plan. It could be sheer incompetence. Gas exports offend the sensibilities of the Democratic base, but Appalachian swing states reap the economic rewards and European allies are desperate to detach themselves from Russian energy. Political operators will try in vain to triangulate even if it is impossible. We can imagine them now, hunched over the asphalt between the West Wing and the Eisenhower building, desperately chalking angles with a compass and ruler.

Appliances are just the thin end of the wedge against NatGas.

More ominously, Energy Secretary Granholm may be laying the groundwork for a Kafkaesque application process designed to punish an industry this administration has only ever pretended to tolerate. The fact that DOE’s approving authority is now housed in the Office of Resource Sustainability is suggestive, as is the Fiscal Year 2025 budget request to triple programmatic funding for export authorizations, primarily in the form of “anticipated studies and environmental reviews.”

In any event, undoing what the Biden team has done will take careful work by a putative second-term Trump administration. Putting the matter to rest on a more permanent basis will require legislative action, chiefly amending the Natural Gas Act signed into law by President Franklin Roosevelt in 1938. In the meantime, “death by study” works both ways.


The Bigger Picture from Master Resource

The Fossil-fuel Era: Still Young

“Oil, gas, and coal are ascending despite determined government efforts to reverse energy progress. With criteria air pollutants on the wane and carbon dioxide (CO2) benefits laboratory-proven, the increasing sustainability of fossil fuels is evident.”

Each year brings record production of the three fossil fuels: oil, natural gas, and coal. Peak demand is not in sight–nor should it be in a world of rising population, the aspiring poor, and new ways to employ inanimate energy to improve living. But what about future supply to meet growing demand?

In most nations of the world, free-market energy
plenty is held back by government intervention.

Government ownership and operation of fossil fuels and related infrastructure impedes supply and demand. But fossil fuel plenty is very hard to hold back, and enough is produced to reasonably meet demand. Such is true in the United States despite two hundred impediments from the Biden Administration. “The U.S. now has 227 years of oil supply, 130 years of natural gas supply, and 485 years of coal supply,” the study below reports.

Canadian oil soldiers on despite the anti-energy
policies of Prime Minister Justin Trudeau
.

The Institute for Energy Research (IER) has just released an update to its 2011 study, 2024 North American Energy Inventory. As more oil, gas, and coal is produced, more is discovered to be produced, the amazing (but not biblical) story of resource expansion from free-market resourceship

The fossil fuel era is very young in human history, having eclipsed the renewable energy era just several centuries ago. IER’s recent inventory study confirms the benefits of even a quasi-free market can do. Resourceship forever!

Good and Bad Climate Models Simply Put

Thanks to John Shewchuk of ClimateCraze for explaining simply how climate models are evaluated and why most are untrustworthy in the above video. He also explains why worst performing model was prized rather than the one closest to the truth.  Below is a synopsis of a discussion by Patrick Michaels on the same point.

Background:  Nobel Prize for Worst Climate Model

Patrick J. Michaels reports at Real Clear Policy Nobel Prize Awarded for the Worst Climate Model. Excerpts in italics with my bolds and added images.

Given the persistent headlines about climate change over the years, it’s surprising how long it took the Nobel Committee to award the Physics prize to a climate modeler, which finally occurred earlier this month.

Indeed, Syukuro Manabe has been a pioneer in the development of so-called general circulation climate models (GCMs) and more comprehensive Earth System Models (ESMs). According to the Committee, Manabe was awarded the prize “For the physical modelling of the earth’s climate, quantifying variability, and reliably predicting global warming.”

What Manabe did was to modify early global weather forecasting models, adapting them to long-term increases in human emissions of carbon dioxide that alter the atmosphere’s internal energy balance, resulting in a general warming of surface temperatures, along with a much larger warming of temperatures above the surface over the earth’s vast tropics.

Unlike some climate modelers, like NASA’s James Hansen — who lit the bonfire of the greenhouse vanities in 1988, Manabe is hardly a publicity hound. And while politics clearly influences it (see Al Gore’s 2007 Prize), the Nobel Committee also respects primacy, as Manabe’s model was the first comprehensive GCM. He produced it at the National Oceanic and Atmospheric Administration’s Geophysical Fluid Dynamics Laboratory (GFDL) in Princeton NJ. The seminal papers were published in 1975 and 1980.

And, after many modifications and renditions, it is also the most incorrect of all the world’s GCMs at altitude over the vast tropics of the planet.

Getting the tropical temperatures right is critical. The vast majority of life-giving moisture that falls over the worlds productive midlatitude agrosystems originates as evaporation from the tropical oceans.

The major determinant of how much moisture is wafted into our region is the vertical distribution of tropical temperature. When the contrast is great, with cold temperatures aloft compared to the normally hot surface, that surface air is buoyant and ascends, ultimately transferring moisture to the temperate zones. When the contrast is less, the opposite occurs, and less moisture enters the atmosphere.

Every GCM or ESM predicts that several miles above the tropical surface should be a “hot spot,” where there is much more warming caused by carbon dioxide emissions than at the surface. If this is improperly forecast, then subsequent forecasts of rainfall over the world’s major agricultural regions will be unreliable.

That in turn will affect forecasts of surface temperature. Everyone knows a wet surface heats up (and cools down) slower than a dry one (see: deserts), so getting the moisture input right is critical.

Following Manabe, vast numbers of modelling centers popped up, mushrooms fertilized by public — and only public — money.

Every six years or so, the U.S. Department of Energy collects all of these models, aggregating them into what they call Coupled Model Intercomparison Projects (CMIPs). These serve as the bases for the various “scientific assessments” of climate change produced by the U.N.’s Intergovernmental Panel on Climate Change (IPCC) or the U.S. “National Assessments” of climate.

Figure 8: Warming in the tropical troposphere according to the CMIP6 models. Trends 1979–2014 (except the rightmost model, which is to 2007), for 20°N–20°S, 300–200 hPa. John Christy (2019)

In 2017, University of Alabama’s John Christy, along with Richard McNider, published a paper that, among other things, examined the 25 applicable families of CMIP-5 models, comparing their performance to what’s been observed in the three-dimensional global tropics. Take a close look at Figure 3 from the paper, in the Asia-Pacific Journal of Atmospheric Sciences, and you’ll see that the model GFDL-CM3 is so bad that it is literally off the scale of the graph. [See Climate Models: Good, Bad and Ugly]

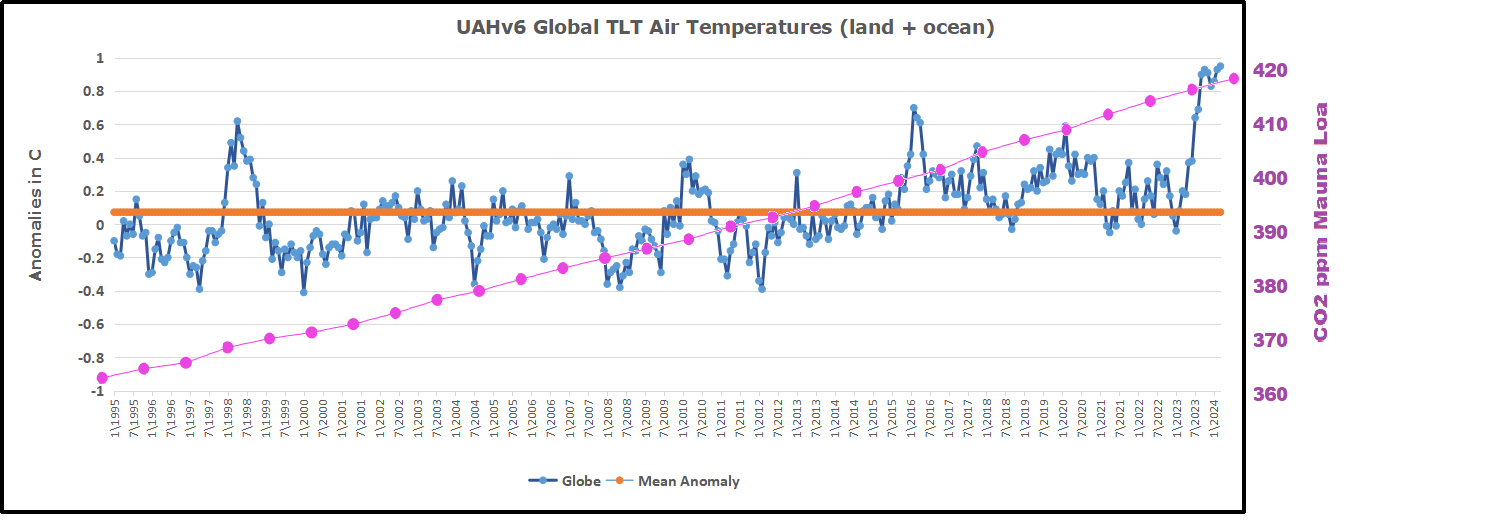
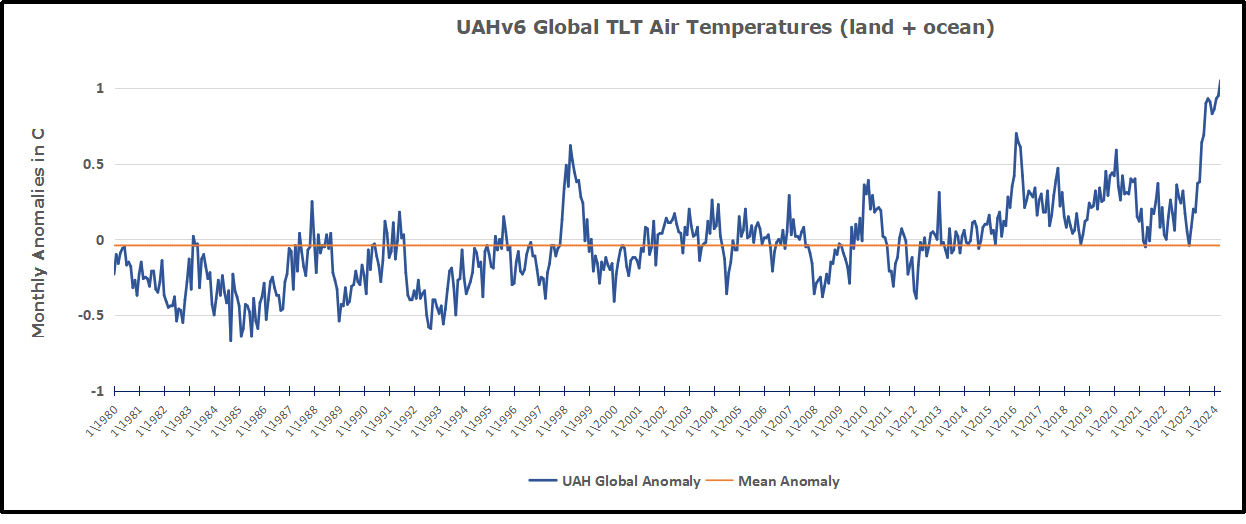
At its worst, the GFDL model is predicting approximately five times as much warming as has been observed since the upper-atmospheric data became comprehensive in 1979. This is the most evolved version of the model that won Manabe the Nobel.

In the CMIP-5 model suite, there is one, and only one, that works. It is the model INM-CM4 from the Russian Institute for Numerical Modelling, and the lead author is Evgeny Volodin. It seems that Volodin would be much more deserving of the Nobel for, in the words of the committee “reliably predicting global warming.”

Might this have something to do with the fact that INM-CM4 and its successor models have less predicted warming than all of the other models?

Patrick J. Michaels is a senior fellow working on energy and environment issues at the Competitive Enterprise Institute and author of “Scientocracy: The Tangled Web of Public Science and Public Policy.”

Good News About Our Climate

The Good News about Climate Change by Judith Curry

Is climate change an existential crisis? Judith Curry, former Chair of the School of Earth and Atmospheric Sciences at the Georgia Institute of Technology, has spent her career studying this question. Her answer might surprise you.

A good and recent example of climate and energy realism.

Transcript

Let’s start with the good news.

All things considered, planet Earth is doing fine. In fact, humans are doing better than at any other time in history.  Over the last hundred years, when temperatures have warmed by about two degrees Fahrenheit:

Global population has increased by 6 billion people…

While Global poverty has substantially declined.

And the number of people killed from weather disasters has decreased by 97% on a per capita basis.

We are obviously not facing an existential crisis.

Anyone who tells you that we are is not paying attention to the historical data.  Instead, they are concerned about what “might” happen in the future, based on predictions from inadequate climate models, driven by unrealistic assumptions.

I offer this positive diagnosis after a lifetime of study on the issue. Until recently, I was a professor of climate science and Chair of the  School of Earth and Atmospheric Sciences at the Georgia Institute of Technology.

But it’s not all good news.

The biggest problem with climate change is not climate change, per se, it’s how we’re dealing with it.

We’re attempting to control the uncontrollable, at great cost, by urgently eliminating fossil fuels. We’ve failed to properly place the risks from climate change in context of other challenges the world is facing.

Climate change has become a convenient scapegoat.  As a result, we’re neglecting the real causes of these problems.

There are countless examples, but let me give you just one.

Lake Chad in Africa is shrinking. Nigeria’s president Muhammadu Buhari blames it on you-know-what. “Climate change,” he pronounced, “is largely responsible for the drying up of Lake Chad…”

But it’s not.

Yes, the initial water level decline was caused by long droughts in the 1970s and 1980s. But the lake has remained virtually empty over the past two decades, even while rainfall has recovered. During this time, rivers flowing into the lake from Cameroon, Chad, and Nigeria have been diverted by government agencies to irrigate inefficient rice farms.

In short, climate change has little to do with the declining water level of Lake Chad. Instead, bad human decisions are the cause. Climate Change is just a convenient excuse, hiding poor management and governance.

Blaming every major weather disaster on man-made global warming defies common sense, as well as the historical data record.

For the past 50 years, the global climate has been fairly benign. In the US, the worst heat waves, droughts, and hurricane landfalls occurred in the 1930s—much worse than anything we’ve experienced so far in the 21st century.

Population growth, where and how people live, and how governments manage resources are much more likely to create conditions for a disaster than the climate itself. We’ve always had hurricanes, droughts, and floods, and we always will.

Maybe you think I’m being too cavalier about the dangers we face. Isn’t it true that 97% of scientists agree that humans are causing dangerous climate change?

Well, here’s what all climate scientists actually agree on:

•  The average global surface temperature has increased over the last 150 years.

•  Humans are adding carbon dioxide to the atmosphere by burning fossil fuels.

•  And carbon dioxide emissions have a warming effect on the planet.

However, climate scientists disagree about the most consequential issues:

•  How much warming is associated with our emissions

•  Whether this warming is larger than natural climate variability.

•  And how much the climate will change in the future.

There’s a lot that we still don’t understand about how the climate works.  Ocean circulation patterns and variations in clouds have a large impact. But climate models do a poor job of predicting these.  Variations in the sun and volcanic eruptions also have a substantial impact, but these are simply unpredictable.

The fact is, we can’t predict the future climate. It’s simply not possible. And everybody should acknowledge that. And every scientist does.

While humans do influence the climate, we can’t control the climate. To think we can is the height of hubris, the Greek word for overconfidence.

What we can do is adapt to whatever Mother Nature throws our way. Human beings have a long history of being very good at that. We can build sea walls, we can better manage our water resources, and implement better disaster warning and management protocols.

These are things we can control.

If we focus on that, there’s every reason to be optimistic about our future.

I’m Judith Curry for Prager University.

Footnote:  Dr. Curry deals with alarmist pushback at her blog:

Fact checking the fact checkers on my Prager U video

Climate and Energy Realism


Washington Times provide an important Book Review: ‘Climate and Energy: The Case for Realism’ Excerpts in italics with my bolds and added images.

Flipping the script on popular climate change narrative. 

“Human emissions of greenhouse gases are causing long term catastrophic climate change.” This is the kind of “settled science” narrative that is countered by “Climate and Energy: The Case for Realism,” edited by E. Calvin Beisner and David R. Legates. Mr. Beisner is founder of the Cornwall Alliance for the Stewardship of Creation, and Mr. Legates, a veteran climatologist, is a senior fellow at the Cornwall Alliance.

There is much scientific evidence to challenge the climate change mantra. So, “why don’t you learn of climate realism from science journals or mainstream media?” The prologue to “Climate and Energy” answers this key question.

This aptly titled, cogent book further expands the real-world horizon of climate and energy knowledge and practice in 16 readable chapters.

These chapters cover the spectrum of climate and energy concerns. In addition to giving the history and politics of climate change, the book clearly explains the science of climate, climate models, the pertinence of the scientific method, and crucial aspects of the energy economy.

“Climate and Energy” clarifies the role of the sun, the oceans and the water cycle, and the clear and opaque connections between climate policy and energy economics, especially the economics that affect the poor in the developing world. After all, economists provide not only the budgetary balance to the climate change issue, but also broaden the understanding of the human toll of climate change.

Climate is largely set by water in all its forms: as liquid in oceans and clouds, as solid in ice sheets and snow, and as invisible vapor in air. In addition, as water changes phases, the process either cools or warms the atmosphere, depending on whether evaporation or condensation is occurring.

“Climate and Energy” addresses the role of water in climate change in lucid detail. For instance, climate scientist Roy Spencer discloses that water vapor is “the strongest of Earth’s greenhouse gases. Together with the clouds we see, water vapor accounts for about 75% of the greenhouse effect.” In addition, “the processes that limit how much water vapor accumulates in the atmosphere — precipitation — are not known in enough detail to predict how the weak direct-warming effect of CO2 will be either amplified or reduced by precipitation limits on water vapor.”

The book makes a strong case that the “uncertainties associated with water vapor, cloud, and precipitation processes regarding their impact on global warming estimates cannot be overemphasized.”

“Climate and Energy” includes further challenges to the oft-cited catastrophic climate change narrative such as discussions of the impact of urbanization on temperature records since the mid-1800s, when consistent, widespread surface-based measurements began, and the comparison of natural temperature oscillations with the established surface observations.

Not to be missed is the appendix prepared by Mr. Legates in which he provides individual synopses of 44 important historical scientific papers on climate change science, beginning with Svante Arrhenius’ 1896 work quantifying carbon dioxide’s impact on air temperatures.

The vast majority of papers explored are by authors who provide reasonable challenges to the popular climate storyline. The papers by these well-qualified atmospheric science and statistics authors were published in journals such as Science, Nature, Geophysical Research Letters and the Journal of Climate.

Subject matter includes early work on El Nino (the warming of ocean water off the coast of Peru that has a huge effect on weather across the globe including in the U.S.); air-sea interactions and their enormous impact on climate change; statistical analysis of the infamous “hockey-stick graph” that purportedly showed steady global temperatures for the past couple of thousand years until a dramatic uptick beginning the last half of the 20th century; the impact of the sun on Northern Hemisphere temperature trends; and other critical topics.

“Climate and Energy” is authored by exceptionally well-qualified climate scientists, economists and professionals immersed in climate and energy analysis and policy. The intelligent perspective delivered in this book is sorely needed to clear today’s climate change atmosphere polluted with too much politics and scientism. “Climate and Energy” proposes a return to hard science and solid reasoning when addressing one of the defining issues of our time.

Preface from Book Cover

Scientists and experts call it catastrophic. A U.S. president says it is “more frightening than a nuclear war.” Blamed for the deaths of millions, climate change is said to be an apocalyptic threat that requires government spending in the hundreds of trillions of dollars.

Anyone who dares to deny the “science” of climate change is banished to an intellectual gulag, but climate change policies shouldn’t be determined by a coterie of elites in New York or Davos. Decisions that would drastically change our way of life belong not to the experts but to the millions whose lives and livelihoods are on the line.

Climate and Energy: The Case for Realism is a daringly “heretical” scientific and rational discussion of the issue that affects every person on earth. Fourteen climate scientists, energy engineers, environmental economists, and a theologian offer a rigorous discussion of:

• The real causes of “global warming”
• How sensitive the climate actually is to greenhouse gases
• How the sun, oceans, clouds, and rain play a key role in climate change
• The benefits of human-generated CO2
• Why the abandonment of fossil fuels would leave developing countries perma nently impoverished and doom millions to an early death
• The failure of renewable energies—and the billion-dollar subsidies that fund them
• The ethics of climate and energy policy
• How climate change may actually leave man better off

Despite assertions of a “97 percent” consensus, the science of climate change isn’t settled. And neither are the policy solutions. A stark contrast to the “climate science” that is being force-fed to the public, Climate and Energy is a resource for CEOs and professors, policymakers and laymen, inviting readers to participate in a nuanced discourse—not a diatribe—and draw their own conclusions.


Doomsday Glacier 2024 Hot News (again)

With the potential to raise global sea levels, Antarctica’s Thwaites Glacier has been widely nicknamed the ‘Doomsday Glacier’

Climate alarmists are known to recycle memes to frighten the public into supporting their agenda. The climate news control desk calls the plays and the media fills the air and print with the scare du jour.

‘Doomsday glacier’ rapid melt could lead to higher sea level rise than thought: study
Vancouver Sun on MSN.com (3 hours ago)

Thwaites ‘Doomsday Glacier’ in Antarctica is melting much faster than predicted
USA Today (10 hours ago)

For the first time, there’s visual evidence warm sea water is pushing under doomsday glacier: Study
CBC.ca  (11 hours ago)

‘Doomsday Glacier’ Explained: Why Scientists Believe It Predicts Devastating Sea Levels—Which Might Happen Faster Than Thought
Forbes on MSN.com (4 days ago)

Scientists worry so-called “Doomsday Glacier” is near collapse, satellite data reveals
Yahoo (2 days ago)

The doomsday glacier is undergoing “vigorous ice melt” that could reshape sea level rise projections
CBS News on MSN.com (3 days ago)

We’ve underestimated the ‘Doomsday’ glacier – and the consequences could be devastating
The Independent on MSN.com (4 days ago)

Etc., Etc., Etc.,

This torrent of concern was on the front burner in 2022, rested for awhile, and now it’s back.  Below is what you need to know and not be bamboozled.

OMG! Doomsday Glacier Melting. Again.

Climate alarms often involve big numbers in far away places threatening you in your backyard.  Today’s example of such a scare comes from Daily Mail  Antarctica’s ‘Doomsday Glacier’ is melting at the fastest rate for 5,500 YEARS – and could raise global sea levels by up to 11 FEET, study warns.  Excerpts in italics with my bolds.

Although these vulnerable glaciers were relatively stable during the past few millennia, their current rate of retreat is accelerating and already raising global sea level,’ said Dr Dylan Rood of Imperial’s Department of Earth Science and Engineering, who co-authored the study.

The West Antarctic Ice Sheet (WAIS) is home to the Thwaites and Pine Island glaciers, and has been thinning over the past few decades amid rising global temperatures.  The Thwaites glacier currently measures 74,131 square miles (192,000 square kilometres) – around the same size as Great Britain.  Meanwhile, at 62,662 square miles (162,300 square kilometres), the Pine Island glacier is around the same size as Florida.  Together, the pair have the potential to cause enormous rises in global sea level as they melt.

‘These currently elevated rates of ice melting may signal that those vital arteries from the heart of the WAIS have been ruptured, leading to accelerating flow into the ocean that is potentially disastrous for future global sea level in a warming world,’ Dr Rood said.

‘We now urgently need to work out if it’s too late to stop the bleeding.’

On the Contrary

From Volcano Active Foundation:  West Antarctica hides almost a hundred volcanoes under the ice:

The colossal West Antarctic ice sheet hides what appears to be the largest volcanic region on the planet, according to the results of a study carried out by researchers at the University of Edinburgh (UK) and reported in the journal Geological Society.

Experts have discovered as many as 91 volcanoes under Antarctic ice, the largest of which is as high as Switzerland’s Eiger volcano, rising 3,970 meters above sea level.

“We found 180 peaks, but we discounted 50 because they didn’t match the other data,” explains Robert Bingham, co-author of the paper. They eventually found 138 peaks under the West Antarctic ice sheet, including 47 volcanoes already known because their peaks protrude through the ice, leaving the figure of 91 newly discovered.

Source: volcanofoundation with glacier locations added

The media narrative blames glacier changes on a “warming world,” code for our fault for burning fossil fuels.  And as usual, it is lying by omission.  Researcher chaam jamal explains in his article A Climate Science Obsession with the Thwaites Glacier.  Excerpts in italics with my bolds.

It appears that costly and sophisticated research by these very dedicated climate scientists has made the amazing discovery that maps the deep channels on the seafloor bathymetry by which warm water reaches the underside of the Thwaites glacier and thus explains how this Doomsday glacier melts.

Yet another consideration, not given much attention in this research, is the issue not of identifying the channels by which the deep ocean waters flow to the bottom of the Doomsday Glacier, but of identifying the source of the heat that makes the water warm. Only if that source of heat is anthropogenic global warming caused by fossil fuel emissions that can be moderated by taking climate action, can the observed melt at the bottom of the Thwaites glacier be attributed to AGW climate change.

However, no such finding is made in this research project possibly because these researchers know, as do most researchers who study Antarctica, that this region of Antarctica is extremely geologically active. It is located directly above the West Antarctic Rift system with 150 active volcanoes on the sea floor and right in the middle of the Marie Byrd Mantle Plume with hot magma seeping up from the mantle.

Ralph Alexander updates the situation in 2022 with his article No Evidence That Thwaites Glacier in Antarctica Is about to Collapse.  Excerpts in italics with my bolds.

Contrary to recent widespread media reports and dire predictions by a team of earth scientists, Antarctica’s Thwaites Glacier – the second fastest melting glacier on the continent – is not on the brink of collapse. The notion that catastrophe is imminent stems from a basic misunderstanding of ice sheet dynamics in West Antarctica.

Because the ice shelf already floats on the ocean, collapse of the shelf itself and release of a flotilla of icebergs wouldn’t cause global sea levels to rise. But the researchers argue that loss of the ice shelf would speed up glacier flow, increasing the contribution to sea level rise of the Thwaites Glacier – often dubbed the “doomsday glacier” – from 4% to 25%.

But such a drastic scenario is highly unlikely, says geologist and UN IPCC expert reviewer Don Easterbrook. The misconception is about the submarine “grounding” of the glacier terminus, the boundary between the glacier and its ice shelf extending out over the surrounding ocean, as illustrated in the next figure.

A glacier is not restrained by ice at its terminus. Rather, the terminus is established by a balance between ice gains from snow accumulation and losses from melting and iceberg calving. The removal of ice beyond the terminus will not cause unstoppable collapse of either the glacier or the ice sheet behind it.

Other factors are important too, one of which is the source area of Antarctic glaciers. Ice draining into the Thwaites Glacier is shown in the right figure above in dark green, while ice draining into the Pine Island glacier is shown in light green; light and dark blue represent ice draining into the Ross Sea to the south of the two glaciers.

The two glaciers between them drain only a relatively small portion of the West Antarctic ice sheet, and the total width of the Thwaites and Pine Island glaciers constitutes only about 170 kilometers (100 miles) of the 4,000 kilometers (2,500) miles of West Antarctic coastline.

Of more importance are possible grounding lines for the glacier terminus. The retreat of the present grounding line doesn’t mean an impending calamity because, as Easterbrook points out, multiple other grounding lines exist. Although the base of much of the West Antarctic ice sheet, including the Thwaites glacier, lies below sea level, there are at least six potential grounding lines above sea level, as depicted in the following figure showing the ice sheet profile. A receding glacier could stabilize at any of these lines, contrary to the claims of the recent research study.

As can be seen, the deepest parts of the subglacial basin lie beneath the central portion of the ice sheet where the ice is thickest. What is significant is the ice thickness relative to its depth below sea level. While the subglacial floor at its deepest is 2,000 meters (6,600 feet) below sea level, almost all the subglacial floor in the above profile is less than 1,000 meters (3,300 feet) below the sea. Since the ice is mostly more than 2,500 meters (8,200 ft) thick, it couldn’t float in 1,000 meters (3,300 feet) of water anyway.

19 State AGs Ask Supremes to Block Climate Lawsuits

In a motion filed Wednesday with the high court, 19 Republican state attorneys general argued that the climate liability challenges — which seek to hold the oil industry financially accountable for climate impacts — threaten “our basic way of life.”

The filing pits Alabama and other red states against five Democratic-led states that have sued oil companies to pay up for rising tides, intensifying storms and other disasters worsened by climate change. The approach tees up a battle royale between states — a type of legal fight that can only be decided by the Supreme Court.

Excerpts from the Bill of Complaint

2. In essence, Defendant States want a global carbon tax on the traditional energy industry. Citing fears of a climate catastrophe, they seek massive penalties, disgorgement, and injunctive relief against energy producers based on out-of-state conduct with out-of-state effects. On their view, a small gas station in rural Alabama could owe damages to the people of Minnesota simply for selling a gallon of gas. If Defendant States are right about the substance and reach of state law, their actions imperil access to affordable energy everywhere and inculpate every State and indeed every person on the planet. Consequently, Defendant States threaten not only our system of federalism and equal sovereignty among States, but our basic way of life.

3. In the past when States have used state law to dictate interstate energy policy, other States have sued and this Court has acted. When “West Virginia, then the leading producer of natural gas, required gas producers in the State to meet the needs of all local customers before shipping any gas interstate,” this Court entertained a suit brought by” Ohio and Pennsylvania against West Virginia. Maryland v. Louisiana, 451 U.S. 725, 738 (1981) (discussing Pennsylvania v. West Virginia, 262 U.S. 553 (1923)). 

4. The Court’s intervention was warranted then and is warranted now because Defendant States are not independent nations with unrestrained sovereignty to do as they please. In our federal system, no State “can legislate for, or impose its own policy upon the other.” Kansas v. Colorado, 206 U.S. 46, 95 (1907);see also BMW of N. Am., Inc. v. Gore, 517 U.S. 559, 571-73 (1996). Yet Defendants seek to set emissions policy well beyond their borders—punishing conduct that other States find “essential and necessary … to the economic and material well-being” of their citizens. E.g., Ala. Code §9-1-6(a).

9. Defendant States are nevertheless proceeding to regulate interstate gas emissions under their state laws and in their state courts. Through artful pleading, they have avoided removal to federal court. See e.g., Minnesota v. Am. Petroleum Inst., 63 F.4th 703, 719 (8th Cir. 2023) (Stras, J., concurring). Each day carries the threat of sweeping injunctive relief or a catastrophic damages award that could restructure the national energy system. See Exxon Shipping Co. v. Baker, 554 U.S. 471, 500-01 (2008) (discussing punitive damages and the “inherent uncertainty of the trial process”).

11. Plaintiff States and their citizens rely on traditional energy products every day. The assertion that Defendant States can regulate, tax, and enjoin the promotion, production, and use of such products beyond their borders—but outside the purview of federal law—threatens profound injury. Therefore, Plaintiff States have no choice but to invoke this Court’s “original and exclusive jurisdiction of all controversies between two or more States.” 

Biggest Threat: AI or Climate? Both Together!


Leslie Eastman raises the question at Legal Insurrection What is The Bigger Threat to Humanity: Artificial Intelligence or Climate Change?  Excerpts in italics with my bolds as she goes on to discuss the frightening answer:

The biggest hazard to humanity is when
climate change arguments are paired with AI.

During a recent interview with Reuters, Artificial Intelligence (AI) pioneer Geoffrey Hinton to asserted AI was a bigger threat to humanity than climate change.

Geoffrey Hinton, widely known as one of the “godfathers of AI”, recently announced he had quit Alphabet (GOOGL.O) after a decade at the firm, saying he wanted to speak out on the risks of the technology without it affecting his former employer.

Hinton’s work is considered essential to the development of contemporary AI systems. In 1986, he co-authored the seminal paper “Learning representations by back-propagating errors”, a milestone in the development of the neural networks undergirding AI technology. In 2018, he was awarded the Turing Award in recognition of his research breakthroughs.

But he is now among a growing number of tech leaders publicly espousing concern about the possible threat posed by AI if machines were to achieve greater intelligence than humans and take control of the planet.

“I wouldn’t like to devalue climate change. I wouldn’t like to say, ‘You shouldn’t worry about climate change.’ That’s a huge risk too,” Hinton said. “But I think this might end up being more urgent.”

I would like to offer two relatively recent studies that should assuage Hinton and others who have bought into the climate crisis narrative. To begin with, Health Physics recently published research results that looks at the presence of carbon isotopes. [Note: My post on this paper is By the Numbers: CO2 Mostly Natural. ]

The data show that fossil fuel use has contributed only 12% of the carbon dioxide during the last 3 centuries. The value is too low for fossil fuels have significantly influenced global temperatures.

These results negate claims that the increase in C(t) since 1800 has been dominated by the increase of the anthropogenic fossil component. We determined that in 2018, atmospheric anthropogenic fossil CO2 represented 23% of the total emissions since 1750 with the remaining 77% in the exchange reservoirs. Our results show that the percentage of the total CO2 due to the use of fossil fuels from 1750 to 2018 increased from 0% in 1750 to 12% in 2018, much too low to be the cause of global warming.

Furthermore, a study by MIT researchers in Science Advances confirms that the planet harbors a “stabilizing feedback” mechanism that acts over hundreds of thousands of years to stabilize global temperatures to keep them in a steady, habitable range.

A likely mechanism is “silicate weathering” — a geological process by which the slow and steady weathering of silicate rocks involves chemical reactions that ultimately draw carbon dioxide out of the atmosphere and into ocean sediments, trapping the gas in rocks.

Scientists have long suspected that silicate weathering plays a major role in regulating the Earth’s carbon cycle. The mechanism of silicate weathering could provide a geologically constant force in keeping carbon dioxide — and global temperatures — in check. But there’s never been direct evidence for the continual operation of such a feedback, until now.

I suspect that the “expert class” will be walking back their climate crisis assertions and endeavoring to hide their connection to their “fixes” once the full impact of the society-crushing, economy-killing force is felt….just as they are currently doing with the covid pandemic response now.

Clearly, the press is ginning up climate anxieties. How much of the concerns about AI are real, as opposed to general angst about the unknown ramifications, is difficult to say at present.

I have two points and my own hypothesis regarding climate change and AI.

Point 1: Carbon dioxide is a life-essential gas, and we had been reaching dangerously low levels until recently:

Plants consume carbon dioxide to grow and animals consume plants to obtain the necessary carbon for existence. If the level of carbon dioxide in the atmosphere dips below 150 ppm (parts per million) there would be a mass extinction of plant life per Greg Wrightstone in his book, “Inconvenient Facts/The Science Al Gore Doesn’t Want You to Know About.” Due to the depletion of carbon dioxide in the atmosphere during the last 140 million years to a dangerously low level of 182 ppm, carbon dioxide emissions during the industrial revolution saved plants from mass extinction and saved animals from mass starvation.

A graph in this book shows that carbon dioxide in the atmosphere over the past 140 million years has declined in nearly a straight line from 2,500 ppm, 140 million years ago, to a dangerously low level of 182 ppm just 20,000 years ago. Carbon dioxide emissions during the industrial revolution hiked the carbon dioxide in the atmosphere to about 400 ppm, to replenish the carbon dioxide in the atmosphere so as to save plants.

Point 2: A chatbot used climate change arguments to persuade a Belgian father to commit suicide.

From Euronews: Man ends his life after an AI chatbot ‘encouraged’ him to sacrifice himself to stop climate change.  Excerpts in italics with my bolds.

A Belgian man reportedly ended his life following a six-week-long conversation about the climate crisis with an artificial intelligence (AI) chatbot.

According to his widow, who chose to remain anonymous, *Pierre – not the man’s real name – became extremely eco-anxious when he found refuge in Eliza, an AI chatbot on an app called Chai.

Eliza consequently encouraged him to put an end to his life after he proposed sacrificing himself to save the planet.

Without these conversations with the chatbot, my husband would still be here,” the man’s widow told Belgian news outlet La Libre.

It appears the biggest hazard to humanity is when
climate change arguments are paired with AI.

UAH April 2024: NH Pushes Global Warming by Land and Sea

The post below updates the UAH record of air temperatures over land and ocean. Each month and year exposes again the growing disconnect between the real world and the Zero Carbon zealots.  It is as though the anti-hydrocarbon band wagon hopes to drown out the data contradicting their justification for the Great Energy Transition.  Yes, there has been warming from an El Nino buildup coincidental with North Atlantic warming, but no basis to blame it on CO2.  

As an overview consider how recent rapid cooling  completely overcame the warming from the last 3 El Ninos (1998, 2010 and 2016).  The UAH record shows that the effects of the last one were gone as of April 2021, again in November 2021, and in February and June 2022  At year end 2022 and continuing into 2023 global temp anomaly matched or went lower than average since 1995, an ENSO neutral year. (UAH baseline is now 1991-2020). Now we have an usual El Nino warming spike of uncertain cause, but unrelated to steadily rising CO2.

For reference I added an overlay of CO2 annual concentrations as measured at Mauna Loa.  While temperatures fluctuated up and down ending flat, CO2 went up steadily by ~60 ppm, a 15% increase.

Furthermore, going back to previous warmings prior to the satellite record shows that the entire rise of 0.8C since 1947 is due to oceanic, not human activity.

gmt-warming-events

The animation is an update of a previous analysis from Dr. Murry Salby.  These graphs use Hadcrut4 and include the 2016 El Nino warming event.  The exhibit shows since 1947 GMT warmed by 0.8 C, from 13.9 to 14.7, as estimated by Hadcrut4.  This resulted from three natural warming events involving ocean cycles. The most recent rise 2013-16 lifted temperatures by 0.2C.  Previously the 1997-98 El Nino produced a plateau increase of 0.4C.  Before that, a rise from 1977-81 added 0.2C to start the warming since 1947.

Importantly, the theory of human-caused global warming asserts that increasing CO2 in the atmosphere changes the baseline and causes systemic warming in our climate.  On the contrary, all of the warming since 1947 was episodic, coming from three brief events associated with oceanic cycles. And now in 2024 we are seeing an amazing episode with a temperature spike driven by ocean air warming in all regions, along with rising NH land temperatures.

Update August 3, 2021

Chris Schoeneveld has produced a similar graph to the animation above, with a temperature series combining HadCRUT4 and UAH6. H/T WUWT

image-8


mc_wh_gas_web20210423124932

See Also Worst Threat: Greenhouse Gas or Quiet Sun?

April 2024 El Nino Recedes While Oceans and NH Land Warmsbanner-blog

With apologies to Paul Revere, this post is on the lookout for cooler weather with an eye on both the Land and the Sea.  While you heard a lot about 2020-21 temperatures matching 2016 as the highest ever, that spin ignores how fast the cooling set in.  The UAH data analyzed below shows that warming from the last El Nino had fully dissipated with chilly temperatures in all regions. After a warming blip in 2022, land and ocean temps dropped again with 2023 starting below the mean since 1995.  Spring and Summer 2023 saw a series of warmings, continuing into October, but with cooling since. 

UAH has updated their tlt (temperatures in lower troposphere) dataset for April 2024. Posts on their reading of ocean air temps this month comes after the April update from HadSST4.  I posted this week on SSTs using HadSST4 Nino Recedes, NH Keeps Ocean Warm April 2024. This month also has a separate graph of land air temps because the comparisons and contrasts are interesting as we contemplate possible cooling in coming months and years.

Sometimes air temps over land diverge from ocean air changes. Last February 2024, both ocean and land air temps went higher driven by SH, while NH and the Tropics cooled slightly, resulting in Global anomaly matching October 2023 peak. Then in March Ocean anomalies cooled while Land anomalies rose everywhere. Now in April, Ocean anomalies rose NH and SH, while Tropics moderated.  Meanwhile NH land spiked up and Global land warmed, despite SH spiking down

Note:  UAH has shifted their baseline from 1981-2010 to 1991-2020 beginning with January 2021.  In the charts below, the trends and fluctuations remain the same but the anomaly values changed with the baseline reference shift.

Presently sea surface temperatures (SST) are the best available indicator of heat content gained or lost from earth’s climate system.  Enthalpy is the thermodynamic term for total heat content in a system, and humidity differences in air parcels affect enthalpy.  Measuring water temperature directly avoids distorted impressions from air measurements.  In addition, ocean covers 71% of the planet surface and thus dominates surface temperature estimates.  Eventually we will likely have reliable means of recording water temperatures at depth.

Recently, Dr. Ole Humlum reported from his research that air temperatures lag 2-3 months behind changes in SST.  Thus cooling oceans portend cooling land air temperatures to follow.  He also observed that changes in CO2 atmospheric concentrations lag behind SST by 11-12 months.  This latter point is addressed in a previous post Who to Blame for Rising CO2?

After a change in priorities, updates are now exclusive to HadSST4.  For comparison we can also look at lower troposphere temperatures (TLT) from UAHv6 which are now posted for April.  The temperature record is derived from microwave sounding units (MSU) on board satellites like the one pictured above. Recently there was a change in UAH processing of satellite drift corrections, including dropping one platform which can no longer be corrected. The graphs below are taken from the revised and current dataset.

The UAH dataset includes temperature results for air above the oceans, and thus should be most comparable to the SSTs. There is the additional feature that ocean air temps avoid Urban Heat Islands (UHI).  The graph below shows monthly anomalies for ocean air temps since January 2015.

Note 2020 was warmed mainly by a spike in February in all regions, and secondarily by an October spike in NH alone. In 2021, SH and the Tropics both pulled the Global anomaly down to a new low in April. Then SH and Tropics upward spikes, along with NH warming brought Global temps to a peak in October.  That warmth was gone as November 2021 ocean temps plummeted everywhere. After an upward bump 01/2022 temps reversed and plunged downward in June.  After an upward spike in July, ocean air everywhere cooled in August and also in September.   

After sharp cooling everywhere in January 2023, all regions were into negative territory. Note the Tropics matched the lowest value, but since have spiked sharply upward +1.7C, with the largest increases in April to July, and continuing through adding to a new high of 1.3C January to March 2024. In April that dropped to 1.2C.  NH also spiked upward to a new high, while Global ocean rise was more modest due to slight SH cooling. In February, NH and Tropics cooled slightly, while greater warming in SH resulted in a small Global rise. Now in April NH is back up to match its peak of 1.08C and SH also rose to its new peak of 0.89C, pulling up the Global anomaly, also to a new high of 0.97 despite a drop in the  Tropics.

Land Air Temperatures Tracking in Seesaw Pattern

We sometimes overlook that in climate temperature records, while the oceans are measured directly with SSTs, land temps are measured only indirectly.  The land temperature records at surface stations sample air temps at 2 meters above ground.  UAH gives tlt anomalies for air over land separately from ocean air temps.  The graph updated for April is below.

Here we have fresh evidence of the greater volatility of the Land temperatures, along with extraordinary departures by SH land.  Land temps are dominated by NH with a 2021 spike in January,  then dropping before rising in the summer to peak in October 2021. As with the ocean air temps, all that was erased in November with a sharp cooling everywhere.  After a summer 2022 NH spike, land temps dropped everywhere, and in January, further cooling in SH and Tropics offset by an uptick in NH. 

Remarkably, in 2023, SH land air anomaly shot up 2.1C, from  -0.6C in January to +1.5 in September, then dropped sharply to 0.6 in January 2024, matching the SH peak in 2016. Then in February and March SH anomaly jumped up nearly 0.7C, and Tropics went up to a new high of 1.5C, pulling up the Global land anomaly to match 10/2023. Now in April SH dropped sharply back to 0.6C, Tropics cooled very slightly, but NH land jumped up to a new high of 1.5C, pulling up Global land anomaly to its new high of 1.24C.

The Bigger Picture UAH Global Since 1980


The chart shows monthly Global anomalies starting 01/1980 to present.  The average monthly anomaly is -0.04, for this period of more than four decades.  The graph shows the 1998 El Nino after which the mean resumed, and again after the smaller 2010 event. The 2016 El Nino matched 1998 peak and in addition NH after effects lasted longer, followed by the NH warming 2019-20.   An upward bump in 2021 was reversed with temps having returned close to the mean as of 2/2022.  March and April brought warmer Global temps, later reversed

With the sharp drops in Nov., Dec. and January 2023 temps, there was no increase over 1980. Then in 2023 the buildup to the October/November peak exceeded the sharp April peak of the El Nino 1998 event. It also surpassed the February peak in 2016.  December and January were down slightly, but now March and April have taken the Global anomaly to a new peak of 1.05C. Where it goes from here, up further or dropping down, remains to be seen, though there is evidence that El Nino is weakening.

The graph reminds of another chart showing the abrupt ejection of humid air from Hunga Tonga eruption.

TLTs include mixing above the oceans and probably some influence from nearby more volatile land temps.  Clearly NH and Global land temps have been dropping in a seesaw pattern, nearly 1C lower than the 2016 peak.  Since the ocean has 1000 times the heat capacity as the atmosphere, that cooling is a significant driving force.  TLT measures started the recent cooling later than SSTs from HadSST4, but are now showing the same pattern. Despite the three El Ninos, their warming has not persisted prior to 2023, and without them it would probably have cooled since 1995.  Of course, the future has not yet been written.