Inside the Hydrogen Fuel Project Bubbles

The map above from IEA shows almost 2000 hydrogen fuel projects around the world, intending to replace hydrocarbon fuels to save the planet.  They dream of being operational by 2030 claiming that real world obstacles will be overcome if enough taxpayer dollars are thrown at the problems.  The whole notion is fantastic (in the literal sense) for reasons detailed in a previous post.

Replace Carbon Fuels with Hydrogen? Absurd, Exorbitant and Pointless

But realities be damned, there’s virtue to be displayed, money to be made and no accountability for failure, so the charade will go on.  On the map are some bubbles off the coast of Canadian maritime provinces, so let’s take a peek into how these projects are conceived and realized. Rod Nickel reports at the Globe and Mail Canadian wind-hydrogen project delayed one year in race to first European exports.  Excerpts in italics with my bolds and added images.

Green Hydrogen Project in Atlantic Provinces Delayed

One of Canada’s first projects to produce emissions-free hydrogen with wind energy has delayed its start by one year because operator World Energy GH2’s European customers need more time to develop special infrastructure to handle the product, the company said.

The delays illustrate the difficulties companies face in introducing a nascent product to replace high-emitting forms of fuel for transport, industry and homes. [The background post above notes how hydrogen makes containers and conduits brittle, not to mention its explosive potential.]

Have we learned nothing from the Hindenburg Disaster?

Half a dozen companies are advancing projects in the gusty Atlantic provinces of Newfoundland and Labrador and Nova Scotia to harness winds to power production of Canada’s first exports of emissions-free hydrogen. Canada signed a non-binding agreement in 2022 to ship green hydrogen to Germany starting in 2025.

But World Energy GH2, an affiliate of Boston-based renewable fuels producer World Energy, won’t make that timeline, managing director Sean Leet told Reuters.

“The offtakers are not going to be ready to accept product within 2025, actually not until 2027,” Leet said, referring to buyers who would pre-purchase some of the project’s hydrogen.

The challenges for prospective buyers involve developing new technology to ship, further process and transport the hydrogen by pipeline at its last destination, Leet said.

World Energy GH2 now hopes to start production in late 2026, he said. It requires approval from Newfoundland’s environmental department and strong pre-purchase interest to attract financing before starting production.

Those buyer commitments hinge on the Canadian government
finalizing details of a tax credit for up to 40% of the
capital cost of building hydrogen plants, Leet said.

The company intends to build three onshore wind farms in Newfoundland to power production of 250,000 metric tons per year of hydrogen, at a total cost of $12 billion.

Advocacy group EnviroWatch NL, however, questions the efficiency of building wind turbines in Canada to produce hydrogen that will ultimately generate power for Europe thousands of kilometres away.

EverWind Fuels is on track to start production in Nova Scotia in 2025, said CEO Trent Vichie.  Its plant, a converted fuel storage facility, would eventually produce 1 million metric tons annually of ammonia, a compound that is a practical form of transporting hydrogen.

EverWind, which declined to disclose the project’s capital budget, expects to strike firm buyer agreements in the first half of 2024, a spokesperson said, and has memorandums of understanding to sell hydrogen to German power companies Uniper and E.ON.

The Canadian government agreed in November to loan EverWind $125 million to build its project, which still requires provincial approval of its wind farms. EverWind’s hydrogen plant has already received environmental approval.

Germany-based ABO Wind is applying for permits and land for a Newfoundland onshore wind farm that will provide electricity to produce hydrogen for Braya Renewable Fuels’ refinery as early as 2027, Robin Reese, director of development for ABO Wind Canada said.

Newfoundland selected EverWind, World Energy GH2, ABO and Exploits Valley Renewable Energy Corp in August to proceed with their wind-hydrogen projects on government land.

U.S.-based Pattern Energy plans to secure European buying agreements in mid-2024 and start construction in 2025 for its wind-hydrogen project on private land in Newfoundland, Canada country head Frank Davis said.

Some Skeptical Comments on the article

EnviroWatch is asking the right question. Why use all this great wind energy to electrolyze water to make hydrogen to convert it (presumably) to ammonia for shipping to Europe to produce energy. It makes absolutely no thermodynamic sense whatsoever. I highly doubt ANY of these projects get built. To quote Susan Powter from the 90s, “Stop the insanity!”.

It makes no economic, thermodynamic or business sense. But it’s great politics.

I’m not thinking Billions but rather Trillions to be wasted on wind power before the world comes to its senses! Twenty- thirty years of spending. Reminds me of the treasure supposedly buried at Oak Island!

Problem is, the alternatives are all expensive mega-projects. Darlington was 5 years late and $10 billion over budget, and we haven’t built a new nuclear plant since then (30 years ago). New hydro dams have similar problems. Wind is small and cheap enough to actually get built in large numbers. Have to expand the energy supply somehow.

The actual Darlington nuke plants were 20% over budget not bad for a first of a kind. The rest was caused by government foolish delays in a high interest rate environment. The next 8 Candu’s were built on time in under 4 years and on budget at under $2/watt average the latest just completed in India.

The $25B refurb project is also on time and under budget.

Actually wind is of little use in Canada as it disappears in summer doldrums and winter cold snaps but maximizes during springtime when hydro flows max out. Its intermittancy makes it 10 times the cost of Candu. 

Big Climate, Internally Conflicted, Descending into Farce


Please, let this be the final farce on the 33rd try

Raymond J. de Souza asks a good question at National Post: Is Big Climate over? That would be good for the environment.  Excerpts in italics with my bolds and added images.

Backing away from absurd, grandiose policies would
shift attention toward more practical measures

Is the era of Big Climate over? It may be that Prime Minister Justin Trudeau has implicitly declared as much.

He would not say such a thing, as when Bill Clinton emphatically declared the “era of big government over” in the 1990s. Clinton was trying to show that he was a different kind of progressive, leaving behind the activist government of the 1960s. In contrast, the Vogue-photographed Trudeau was Big Climate’s most glamorous spokesmodel.

His absence at the UN climate jamboree in Dubai is thus striking.

Instead, conservative premiers Danielle Smith and Scott Moe are both on hand to promote oil and gas deals in the petro-state, but not the prime minister. Was it only eight years ago that a newly elected Trudeau descended upon the climate summit in Paris with a bloated retinue of hundreds, all the better to declare that “Canada is back?” He has now backed away.

Canada really isn’t back — we have never been quite so marginal in international relations as we are now — but certainly we were celebrated in Big Climate circles. In the heady days of 2019 Trudeau was even granted an audience with Greta Thunberg.

That was a sign, in retrospect, that Big Climate was in decline.
Inviting a Swedish teenager to indignantly lecture global leaders
indicated that Big Climate was entering its absurd phase.

Big Government, Big Tobacco, Big Pharma, Big Football (FIFA now, NFL in future) are behemoths that seem unstoppable, commanding all they survey. Then they enter their absurd phase, when their excesses become increasingly implausible. They don’t disappear. The advantage of being big is a certain momentum that carries forward, albeit diminished.

There is a point though when there is a qualitative change, even if massive quantity endures for a while. For Big Government, perhaps it was Clinton’s declaration. For Big Tobacco, it was when the assembled chief executives swore under oath that they had no idea that smoking could be addictive.

Big Climate had a good run. Ecological consciousness has been growing since the late 1960s. It’s a relatively easy sell. Everyone desires clean air, clean water, parks and natural beauty. Conservatives like conservation, after all, and progressives like government regulation to get there.

Big Climate was born out of that wider ecological movement, specifically at the 1992 “Earth summit” in Rio. The current Dubai “COP28” conference is the 28th “conference of the parties” that grew out of Rio 1992. Big Climate grew ever bigger, so much so that 70,000 delegates landed in Dubai this year. Along the way were milestones, such as Kyoto 1997 and Paris 2015, in which Big Climate managed to get wide agreement on re-ordering the global economy in principle, if not practice.

This year, though, one gets the sense that Big Climate has become wrapped in too many contradictions, capped off with a farcical conference in the petro-state’s air-conditioned desert. The incongruity of it all was nicely highlighted by the brouhaha that erupted when the Emirati conference chairman blithely declared that there was no real scientific basis to phase out fossil fuels.

Consider the Germans, Big Climate’s biggest booster in the heart of Europe. This year marked the end of German nuclear power, with the last reactors closed. Germany has now moved to a higher carbon future, burning coal and natural gas.

That proved a bit tricky when at war with Russia in Ukraine, so Germany turned to Canada for natural gas supplies. Trudeau refused to sell Germans our natural gas, directing them instead to Qatar. That strikes most folks as absurd.

Canada and Germany Sign Agreement to Enhance German Energy Security with Clean Canadian Hydrogen August 2022.  And the hydrogen energy project is still pie in the sky.

Meanwhile, President Joe Biden, who began his administration with an ostentatious cancellation of the Keystone XL pipeline, lest Canadian resources pollute the American energy grid, has now decided to increase imports of Venezuelan oil and gas. That, too, is absurd.

Then there are billions upon billions of dollars — with Canada and the EU scrambling to match American subsidies — being lavished upon electric battery manufacturers, making “green jobs” a giant tax-funded boondoggle. That the great climate villain in the auto sector, Volkswagen, is a beneficiary of such largesse only makes the absurdity more galling.

Yes, those are trillions of dollars they are projecting.

Against all that, Trudeau’s decision to compromise his climate agenda to save a few Atlantic ridings is a rather low-voltage issue. Yet it shows that Big Climate is losing its power.

The end of Big Climate may be good for the climate. Backing away from grandiose and absurd policies shifts attention toward more practical and reasonable measures that will garner wider public support.

COP28 in the desert is a suitable end to Big Climate.
It ends with a bang, as it were. And Trudeau withdraws with a whimper.


Dubai, We Have a Problem: No Global Temperature Baseline Before 1900

An article in German presents the problem:  “Warmer than at any time since records began …” – The fraud with the reference period.”  LackmustestTester at reddit provides an English synopsis explaining the serious issue of global temperature records lacking prior to 20th century. Excerpts in italics with my bolds and added images. The original in German is here.

Temperature Records Lacking Before Last Century

Well, Copernicus, as an organization financed and probably also controlled by the EU, is one of those organizations that boast about data transparency. So we have obtained the data that Samantha Burgess refers to in her heat record letter, which you can get here, and counted out which measuring stations in which parts of the world are the basis for the global average temperature calculated for the years 1850 to 1900, which serves as the basis for the alleged increase of 1.46 degrees Celsius.

Well, let’s say right away that China and Southeast Asia are completely irrelevant for the global temperature from 1850 to 1900; neither China, Japan, India, Thailand, Indonesia and the Philippines, to name but a few, appear in the “reference period from 1850 to 1900” with even a single measurement date.

But that’s not all: the global temperature, calculated for the pre-industrial period from 1850 to 1900, which has become the basis for all claims about the significant increase in temperatures, does not include any data from not only Asia, it does not include any data for South America and Africa has shrunk to Algeria, Morocco, Tunisia and Egypt in the north, and South Africa in the south.

The earth temperature of the reference period 1850 to 1900 is essentially a North American temperature, which is primarily based on measurement data from the USA: 83.4% of the temperature data for the “global temperature” of the “reference period 1850 to 1900” for the northern hemisphere originate from the USA, 75.9% of all measuring stations on the basis of which the global temperature of the “reference period 1850 to 1900” is calculated are located in the USA, and just under 10% in Canada.

Not only to conceal this bias in the data basis, but also to
pass off the temperatures calculated for the “reference period
from 1850 to 1900” as “global temperatures” is fraud.

Another way to show the bias of the data, on the basis of which one can at best make statements about the USA and Canada, is to differentiate the measuring stations into those located in the northern hemisphere and those located in the southern hemisphere. The following figure shows, among other things, the result of this comparison.

Number and locations of the measuring stations used to calculate the reference period 1850 to 1900 – blue: NH, orange: SH, grey: only US, red: cumulative values

Just 9% of the measuring stations on the basis of whose data the temperature of the reference period 1850 to 1900 is calculated, as a measure of the pre-industrial temperature that is so important for the climate cultists, are located in the southern hemisphere and there they are mainly found in Australia, apart from a few scattered measuring stations in South Africa and two measuring stations in Sri Lanka.

The Earth’s temperature is obviously a temperature that can be
calculated independently of local temperatures in India, China,
Southeast Asia, South America and large parts of Africa.

If it is possible to calculate the Earth’s temperature for the period from 1850 to 1900 without taking large parts of the Earth into account, then the question arises as to whether it is possible to do without any measurement data at all, especially as their distribution over the years is very uneven: a total of 32 measuring stations form the basis for the global Earth temperature calculation for the years 1850 to 1859, with a further 62 from 1860 to 1869. As the figure above shows, the claim that the entire period from 1850 to 1900 is a reference period is simply fraudulent, as 77% of the measuring stations were only put into operation after 1890.

This is all a huge humbug that ultimately represents scientific fraud, and anyone who compares today’s data with the data from the reference period 1850 to 1900 and claims to be able to extract any information about the development of the global earth temperature from this is either out of their depth or a climate fraudster.

Footnote from Comments

The official record Copernicus uses goes back to 1940.

Additionally, it appears that at least the NH was just emerging from a prolonged cold period – the little ice age – which would assist in providing for the lower baseline temps. All in all, it seems silly to try and make such comparisons, and even when they are done we seem to run into ‘re-analysis’ of past temp data that persistently cools the past data sets, which of course make current temps seem warmer.

It’s not only NOAA doing these adjustments, German DWD does the same thing. They also placed new stations at inappropriate sites and reduced the number of stations.

Consider the Hot Air in recent claims like these:

Humanity has just lived through the hottest 12-month period in at least 125,000 years CNN

Earth posts hottest 12 months on record and probably 125,000 years Washington Post

This year is “virtually certain” to be the warmest in 125,000 years said E U scientists Reuters

The hottest temperature that our planet has experienced in something like 125,000 years Scientific American

Earth just had its hottest year on record — climate change is to blame Nature


Fighting Global Warming: All Cash, No Cooling

Through Dec. 12, the “Climate!” crowd is swarming COP28, Dubai’s carbophobia cavalcade. The fact that these global-warming alarmists are surrounded by Earth’s deepest pools of fossil fuels makes their Hajj infinitely ironic.

Also astonishing is the nearly immeasurable impact of these people’s gyrations. They blow trillions of dollars, bludgeon human freedom, and yet do shockingly little to fix their vaunted “climate crisis.”

One practically needs an electron microscope to find their promised
reductions in allegedly venomous CO2 or supposedly lethal temperatures.

According to #ActInTime’s Climate Clock, high above Manhattan’s Union Square, humans have — at this writing — five years and 227 days until we boil to death in a cauldron of steaming carbon. Since The End is scheduled for Saturday, July 21, 2029 (mark your calendars!)

Big Government Democrats offer jaw-droppingly paltry climate benefits,
despite their spine-chilling predictions and unbridled interventionism.

Clean Power Plan Cost/Benefit

Obama-Biden’s proposed Clean Power Plan was a diamond-encrusted specimen of do-nothingism. According to a May 2015 analysis by their own Energy Information Agency, between 2015 and 2025, the CPP would have slashed real GDP by $993 billion, or an average of $39.7 billion per year.

It would have sliced real disposable income by $382 billion, or $15.3 billion annually. It also would have chopped manufacturing shipments by $1.13 trillion, or $45.4 billion per year.

EIA forecast a decrease of 0.035° Fahrenheit. This would have cranked a thermometer from 72° F way down to 71.965°.  As Billy Joel once sang, “Is that all you get for your money?”

IRA Funded Green Energy Projects Cost/Benefit

Biden’s blessed Inflation Reduction Act budgeted $369 billion for green-energy projects. Goldman Sachs subsequently slapped a $1.2 trillion price tag on the IRA.

Danish environmental expert Bjorn Lomborg ran the IRA through the United Nations’ climate models. “Impact of new climate legislation,” Lomborg specified. Unnoticeable: 0.0009°F to 0.028°F in 2100.”  This would chill thermostats from 72° to 71.9991°. If we get lucky: 71.972°.

Biden said on Jan. 31 that “if we don’t stay under 1.5° Celsius” or 2.7° Fahrenheit, “we’re going to have a real problem.” If a 0.0009° F reduction costs $369 billion, then Biden’s 2.7° F goal would devour — brace yourself — $1.107 quadrillion — with a Q.

Biden EV Mandate Cost/Benefit

Emperor Biden’s electric-vehicle decree would require that at least 67% of new cars sold in 2032 be electric. This edict already is stalling the auto industry. On Nov. 29, 3,902 U.S. car dealers in all 50 states wrote Biden. Message: Stop tailgating!  “Already, electric vehicles are stacking up on our lots,” the dealers complained.  “The majority of customers are simply not ready to make the change.”

This chaos aside, Biden’s mandate would limit CO2 by 10 billion tons through 2055. Alas, China is expected to generate 320 billion tons of carbon in the next 32 years. So, Biden’s “savings” will asphyxiate in a giant Chinese carbon cloud.

Holman Jenkins of The Wall Street Journal calculates that Biden’s EV order will decrease planetary emissions by a whopping 0.18%. “The climate effect of the extravagantly expensive Biden plan will steadily approach zero,” Jenkins anticipates.

Bans on Gas Stoves and Heaters Cost/Benefit

Rather than jail criminals or deport illegal aliens, Governor Kathy Hochul, D-N.Y., bans gas stoves and demands that gas heaters yield to electric heat pumps — never mind that her constituents freeze to death during post-blizzard blackouts.

“The global effect of the costly program of compulsory electrification will be a reduction in greenhouse gas emissions of less than 0.05%,” the Empire Center for Public Policy calculates.

Summation

Obama, Biden, Hochul and their comrades might respond that no single bauble will fix everything, and every shiny object helps.  Maybe.  But these four schemes alone carry an enormously high price in shredded freedom and incinerated taxpayer dollars, yet still leave at least 99.82% of emissions untouched.

To quote another Briton, William Shakespeare, perhaps this “sound and fury, signifying nothing” is not about cutting emissions or curbing Earth’s temperatures.

Maybe it’s designed to help Democrats spend trillions of dollars to signal virtue, bark orders at the American people, and lavish taxpayers’ hard-earned cash on their politically connected pals — from the Potomac to the Persian Gulf.

Footnote:  

The estimates of lowering temperatures come from IPCC-approved models, which presume that Global Mean Temperature (GMT) rises in response to rising atmospheric CO2.  In fact that premise is itself dubious since basic physics requires that a cause precede an effect in time. The evidence points to changes in CO2 lagging rather than leading GMT changes.  This is true on all time scales, from last month’s observations to ice cores spanning millenia.

Confirmed: Temperature Drives CO2, not the Reverse

COP28 Showcases Globalist Agenda 2030

Two Sides of the Same Coin

Kit Knightly writes at off-guardian COP28: The Globalist Agenda Has Never Been More Obvious.  Excerpts in italics with my bolds and added images.  H/T Tyler Durden

As of this morning, we are four days into the two-week climate change summit in Dubai.

Yes, as we can all note for the thousandth time, literal fleets of private jets have descended on the desert so that bankers and billionaires can talk about making sure we don’t drive anymore or eat too much cheese.

What’s on the agenda? Globalism – and it’s never been more obvious.

President of Brazil Luiz Inácio Lula da Silva essentially said as much:

The planet is fed up with unfulfilled climate agreements. Governments cannot escape their responsibilities. No country will solve its problems alone. We are all obliged to act together beyond our borders,”

Thursday’s opening remarks were predictably doom-laden, with His Royal Highness Charles III and UN Secretary-General António Guterres falling into a traditional good cop/bad cop hustle.

Charlie warned that we are embarking on a “vast, frightening experiment”, asking “how dangerous are we actually prepared to make our world?”

While Tony offered just the barest, thinnest slice of hope to world leaders:

It is not too late […] You can prevent planetary crash and burn. We have the technologies to avoid the worst of climate chaos – if we act now.”

The rest of the two weeks will doubtless be committed to lobbyists, bankers, royals and politicians deciding exactly how they are going to “act”. Or, more accurately, how they are going to sell their pre-agreed actions to their cattle-like populations.

They are literally telling us their plans, all we have to do is listen.

For example, Friday and Saturday were given over to the “World Climate Action Summit”, at which over 170 world leaders pledged support for Agenda 2030.

Among the agreements and pledges signed at the summit so far is the “Emirates Declaration on Sustainable Agriculture, Resilient Food Systems and Climate Action”. Which, according to the BBC, pledges to:

take aim at planet-warming food”

We’ve all played this game long enough to know what that means, haven’t we?  It means no more meat and dairy, and a lot more bugs and GMO soy cubes.

They never say that, of course. Instead, they just use phrases like “orient policies [to] reduce greenhouse gas emissions”, or “shifting from higher greenhouse gas-emitting practices to more sustainable production and consumption approaches.”  Maintaining plausible deniability via vague language is part of the dance, but anyone paying attention knows exactly what they are talking about.

It doesn’t stop there. World leaders have also agreed to establish a “loss and damage fund”, a 430 million dollar resource for developing countries that need to “recover” after being “damaged” by climate change.

Ajay Banga, head of noted charitable organisation the World Bank, is all in favour of the idea and will be supporting the plan by agreeing to “pause” debt repayments from any government impacted by climate change.

Yes, those are trillions of US$ they are projecting.

We know how this works, we saw the same thing in the IHR amendments following Covid – it’s a bribe pool. One that serves to both further the narrative of climate change and instruct policy in the third world. Any developing nation’s government that wants a slice of that pie will have to publicly talk about all the negative impacts climate change has on their country.  At the same time, to get the money, they will almost certainly have to agree to “adopt climate-friendly policies” and/or submit their climate policies to an “independent panel of experts” appointed by the UN.

Alongside the food pledge and loss fund, we have the Global Renewables and Energy Efficiency Pledge, which aims to increase reliance on “green energy”. Over 120 countries signed that one.

And then there’s the Global Methane Pledge, which has been signed by 155 governments as well as 50 oil companies.  These companies represent around half the world’s oil production, and just want to help the planet, they have no financial stake in this situation at all.

There’s the smaller Declaration on Climate, Relief, Recovery and Peace, which was signed by only 70 countries (and 39 NGOs). That one emphasizes the link between war and carbon emissions and aims to “boost financial support for climate resilience in war-torn and fragile settings”, whatever that means in real terms I’m not sure.

And, of course, 124 countries (including the EU and China) have signed the inevitable ‘Declaration on Climate and Health’.

It is funded to the tune of 1 BILLION dollars from donors such as the Rockefeller Foundation, and supposedly aims to:

better leverage synergies at the intersection of climate change and health to improve the efficiency and effectiveness of finance flows.”

…which might be the worst sentence anyone has ever written.

All this is going to culminate in what they call the “Global Stocktake”. Essentially this is a mid-term report for the Paris Agreements, which can be “leveraged to accelerate ambition in their next round of climate action plans due in 2025”.

Whatever “leveraged to accelerate ambition” turns out to mean, you can be sure all of the attending governments will happily comply.  That includes every government in NATO, the European Union and BRICS by the way.  That includes the USA and China. That includes Russia and Ukraine.  That includes Israel…and Palestine.

It’s basically covid all over again.

♦   We know, just like Covid, the official narrative of climate change is a lie.

♦   We know, just like Covid, climate change is being used as an excuse to usher in massive social control and global governance.

♦   And we know, just like Covid, almost every world government on both sides of every divide is backing it.

Even if they don’t always agree, even if they are happy to kill each other’s citizens in large numbers, they are all on board the same globalist gravy train, all going in the same direction to the same destination, and it has never been more obvious.

UAH November 2023: Ocean Stays Warm, Land Cools

The post below updates the UAH record of air temperatures over land and ocean. Each month and year exposes again the growing disconnect between the real world and the Zero Carbon zealots.  It is as though the anti-hydrocarbon band wagon hopes to drown out the data contradicting their justification for the Great Energy Transition.  Yes, there has been warming from an El Nino buildup coincidental with North Atlantic warming, but no basis to blame it on CO2.  

As an overview consider how recent rapid cooling  completely overcame the warming from the last 3 El Ninos (1998, 2010 and 2016).  The UAH record shows that the effects of the last one were gone as of April 2021, again in November 2021, and in February and June 2022  At year end 2022 and continuing into 2023 global temp anomaly matched or went lower than average since 1995, an ENSO neutral year. (UAH baseline is now 1991-2020).

For reference I added an overlay of CO2 annual concentrations as measured at Mauna Loa.  While temperatures fluctuated up and down ending flat, CO2 went up steadily by ~60 ppm, a 15% increase.

Furthermore, going back to previous warmings prior to the satellite record shows that the entire rise of 0.8C since 1947 is due to oceanic, not human activity.

gmt-warming-events

The animation is an update of a previous analysis from Dr. Murry Salby.  These graphs use Hadcrut4 and include the 2016 El Nino warming event.  The exhibit shows since 1947 GMT warmed by 0.8 C, from 13.9 to 14.7, as estimated by Hadcrut4.  This resulted from three natural warming events involving ocean cycles. The most recent rise 2013-16 lifted temperatures by 0.2C.  Previously the 1997-98 El Nino produced a plateau increase of 0.4C.  Before that, a rise from 1977-81 added 0.2C to start the warming since 1947.

Importantly, the theory of human-caused global warming asserts that increasing CO2 in the atmosphere changes the baseline and causes systemic warming in our climate.  On the contrary, all of the warming since 1947 was episodic, coming from three brief events associated with oceanic cycles. And now in 2023 we are seeing an amazing episode with a temperature spike driven by ocean air warming in all regions. 

Update August 3, 2021

Chris Schoeneveld has produced a similar graph to the animation above, with a temperature series combining HadCRUT4 and UAH6. H/T WUWT

image-8


mc_wh_gas_web20210423124932

See Also Worst Threat: Greenhouse Gas or Quiet Sun?

November 2023 Ocean Stays Warm, Land Cools

banner-blog

With apologies to Paul Revere, this post is on the lookout for cooler weather with an eye on both the Land and the Sea.  While you will hear a lot about 2020-21 temperatures matching 2016 as the highest ever, that spin ignores how fast the cooling set in.  The UAH data analyzed below shows that warming from the last El Nino had fully dissipated with chilly temperatures in all regions. After a warming blip in 2022, land and ocean temps dropped again with 2023 starting below the mean since 1995.  Spring and Summer 2023 saw a series of warmings.  Now in November the high persisted due to another rise in ocean air temps in all regions, while land air temps cooled everywhere, most strongly in SH.

UAH has updated their tlt (temperatures in lower troposphere) dataset for November 2023. Posts on their reading of ocean air temps this month preceded updated records from HadSST4.  I last posted on SSTs using HadSST4 October 2023 Ocean Cooling Off.  This month also has a separate graph of land air temps because the comparisons and contrasts are interesting as we contemplate possible cooling in coming months and years.

Sometimes air temps over land diverge from ocean air changes.  November 2023 is notable for a dichotomy between Ocean and Land air temperatures in UAH dataset. Remarkably a new high for Ocean air temps appeared with warming in all regions, while Land air temps dropped with cooling in all regions.  As a result the Global Ocean and Land anomaly result remained little changed.

Note:  UAH has shifted their baseline from 1981-2010 to 1991-2020 beginning with January 2021.  In the charts below, the trends and fluctuations remain the same but the anomaly values change with the baseline reference shift.

Presently sea surface temperatures (SST) are the best available indicator of heat content gained or lost from earth’s climate system.  Enthalpy is the thermodynamic term for total heat content in a system, and humidity differences in air parcels affect enthalpy.  Measuring water temperature directly avoids distorted impressions from air measurements.  In addition, ocean covers 71% of the planet surface and thus dominates surface temperature estimates.  Eventually we will likely have reliable means of recording water temperatures at depth.

Recently, Dr. Ole Humlum reported from his research that air temperatures lag 2-3 months behind changes in SST.  Thus cooling oceans portend cooling land air temperatures to follow.  He also observed that changes in CO2 atmospheric concentrations lag behind SST by 11-12 months.  This latter point is addressed in a previous post Who to Blame for Rising CO2?

After a change in priorities, updates are now exclusive to HadSST4.  For comparison we can also look at lower troposphere temperatures (TLT) from UAHv6 which are now posted for November.  The temperature record is derived from microwave sounding units (MSU) on board satellites like the one pictured above. Recently there was a change in UAH processing of satellite drift corrections, including dropping one platform which can no longer be corrected. The graphs below are taken from the revised and current dataset.

The UAH dataset includes temperature results for air above the oceans, and thus should be most comparable to the SSTs. There is the additional feature that ocean air temps avoid Urban Heat Islands (UHI).  The graph below shows monthly anomalies for ocean air temps since January 2015.

Note 2020 was warmed mainly by a spike in February in all regions, and secondarily by an October spike in NH alone. In 2021, SH and the Tropics both pulled the Global anomaly down to a new low in April. Then SH and Tropics upward spikes, along with NH warming brought Global temps to a peak in October.  That warmth was gone as November 2021 ocean temps plummeted everywhere. After an upward bump 01/2022 temps reversed and plunged downward in June.  After an upward spike in July, ocean air everywhere cooled in August and also in September.   

After sharp cooling everywhere in January 2023, all regions were into negative territory. Note the Tropics matched the lowest value, but since have spiked sharply upward +1.4C, with the largest increases in April to July, and continuing in Autumn 2023.  NH also warmed to 0.83C in the last 9 months, while SH ocean air rose about the same. Global Ocean air November 2023 now exceeds the 2016 peak by 0.2C, the main difference being the much higher rise in SH anomalies since June.  The strength of the El Nino will determine the pattern in coming months.

Land Air Temperatures Tracking in Seesaw Pattern

We sometimes overlook that in climate temperature records, while the oceans are measured directly with SSTs, land temps are measured only indirectly.  The land temperature records at surface stations sample air temps at 2 meters above ground.  UAH gives tlt anomalies for air over land separately from ocean air temps.  The graph updated for November is below.

Here we have fresh evidence of the greater volatility of the Land temperatures, along with extraordinary departures by SH land.  Land temps are dominated by NH with a 2021 spike in January,  then dropping before rising in the summer to peak in October 2021. As with the ocean air temps, all that was erased in November with a sharp cooling everywhere.  After a summer 2022 NH spike, land temps dropped everywhere, and in January, further cooling in SH and Tropics offset by an uptick in NH. 

Remarkably, in 2023, SH land air anomaly shot up 1.6C, from  -0.56C in January to +1.03 in October, then dropped to 0.7 in November.  Tropical land temps are up 1.6 since January and NH Land air temps rose 0.9, mostly since May.  Now in November NH land air temps are little changed and Tropical land temps down nearly 0.2C.

The Bigger Picture UAH Global Since 1980

The chart shows monthly Global anomalies starting 01/1980 to present.  The average monthly anomaly is -0.05, for this period of more than four decades.  The graph shows the 1998 El Nino after which the mean resumed, and again after the smaller 2010 event. The 2016 El Nino matched 1998 peak and in addition NH after effects lasted longer, followed by the NH warming 2019-20.   An upward bump in 2021 was reversed with temps having returned close to the mean as of 2/2022.  March and April brought warmer Global temps, later reversed.

With the sharp drops in Nov., Dec. and January 2023 temps, there was no increase over 1980. Now in 2023 the buildup to the October/November peak exceeds the sharp April peak of the El Nino 1998 event. It also surpasses the February peak in 2016.  Where it goes from here, up or down, remains to be seen.

The graph reminds of another chart showing the abrupt ejection of humid air from Hunga Tonga eruption.

TLTs include mixing above the oceans and probably some influence from nearby more volatile land temps.  Clearly NH and Global land temps have been dropping in a seesaw pattern, nearly 1C lower than the 2016 peak.  Since the ocean has 1000 times the heat capacity as the atmosphere, that cooling is a significant driving force.  TLT measures started the recent cooling later than SSTs from HadSST3, but are now showing the same pattern. Despite the three El Ninos, their warming has not persisted prior to 2023, and without them it would probably have cooled since 1995.  Of course, the future has not yet been written.


COP28 Triggers Leap in Arctic Ice

The animation shows remarkable growth of Arctic ice extent just since COP28 began.  As noted in the previous Arctic ice post, Hudson Bay (lower right) was a lagging region, but freezing accelerated there. At the top, Barents and Greenland sea added ice. As well, both Bering and Okhotsk seas (far left) added fast ice on coastlines. In all, half a Wadham, 517k km2 of ice extent was added in just three days.

A Lufthansa aircraft at the snow-covered Munich airport on Saturday. Photograph: Karl-Josef Hildenbrand/AP

Coincidently, COP28 also triggered heavy snow bringing chaos to southern Germany causing Munich to suspend flights to anywhere, including Dubai.

The graph below shows the gains in ice extent erasing a brief deficit to average.

MASIE shows a gain of ~0.5M km2 from day 334 to 336, now exceeding average after being lower briefly.  SII (Sea Ice Index) also rose but is still estimating ice extent ~500k km2 lower.

The table below shows the distribution of ice in the Arctic Ocean basins.

Region 2023336 Day 336 2023-Ave. 2007336 2023-2007
 (0) Northern_Hemisphere 11113626 11059843  53782  10853632 259993 
 (1) Beaufort_Sea 1070966 1069301  1665  1054586 16380 
 (2) Chukchi_Sea 765844 797154  -31311  607874 157970 
 (3) East_Siberian_Sea 1087137 1080765  6372  1023256 63882 
 (4) Laptev_Sea 897845 897835  897845
 (5) Kara_Sea 812779 796332  16446  829462 -16683 
 (6) Barents_Sea 350616 259899  90717  222769 127847 
 (7) Greenland_Sea 711570 538651  172919  541176 170393 
 (8) Baffin_Bay_Gulf_of_St._Lawrence 571757 697517  -125760  755390 -183633 
 (9) Canadian_Archipelago 854860 853409  1451  852556 2304 
 (10) Hudson_Bay 553841 636088  -82247  812965 -259124 
 (11) Central_Arctic 3220281 3198662  21619  3177278 43003 
 (12) Bering_Sea 82391 154107  -71716  27916 54475 
 (13) Baltic_Sea 23276 4889  18387  2898 20378 
 (14) Sea_of_Okhotsk 106202 70731  35471  46377 59826 

Note that Arctic ice now exceeds 11M km2, or 74% of last March maximum.  As shown in the table above, the main deficits to average are in Hudson and Baffin Bays, along with less ice in Bering Sea. Offsetting are surpluses elsewhere, especially in Barents and Greenland seas.


Beware Next Genetic Experiment Sold as “Vaccine”

The warning comes from Klaus Steger, Ph.D., is a molecular biologist with a research focus in the genetic and epigenetic regulation of gene expression during normal and aberrant sperm development. Over the past 30 years, his research projects were continuously funded by the German Research Foundation, while he headed several gene technology laboratories regularly applying RNA-based technologies. He served as a professor of anatomy and cell biology at the University of Giessen, Germany, for 23 years before retiring this year. He holds a doctorate in natural sciences from the University of Regensburg. His article is:

Self-Amplifying RNA Shots Are Coming: The Untold Danger  The truth behind RNA-based vaccine technology (Part 3).  Excerpts in italics with my bolds and added images

The next generation of RNA-based injections will contain self-amplifying RNA (saRNA). If the term “self-amplifying RNA” sounds frightening, it should. It likely brings to mind images of scientific experiments run amok.

As discussed in a previous article, “mRNA vaccines” are not made with messenger RNA but with modified RNA (modRNA). These so-called vaccines are actually gene therapy products (GTPs), as modRNA hijacks our cells’ software. We have no possibility at all to gain influence on modRNA (or saRNA) after it has been injected.

What Distinguishes saRNA From modRNA?

The term “self-amplifying” is self-explanatory: saRNA replicates itself repeatedly, which is not natural, as natural mRNA is always (without exception) transcribed from DNA (this is called the “central dogma of molecular biology”).

Compared to modRNA, a small amount of saRNA results in an increased amount of produced antigen; one shot of saRNA-based injection may be enough to generate sufficient antibodies against a virus. Both saRNA and modRNA represent the blueprint for a viral protein, which, after entering our cells, will be produced by our cell machinery (i.e., ribosomes).

Scientists created the genetically modified modRNA sequence by replacing natural uridines with synthetic methyl-pseudouridines to generate a maximum amount of viral antigen. This modification is the basis of Pfizer-BioNTech and Moderna COVID-19 shots.

Unlike modRNA, saRNA does not contain methyl-pseudouridines, but uridines. Why? Since saRNA self-replicates and synthetic methyl-pseudouridines are not available in our cells, saRNA must rely on natural uridines that exist in our cells. Our cells will produce foreign proteins using their own cell machinery and their own natural resources—the main reason these cells finally become exhausted.

However, this causes a significant problem: mRNA is highly unstable and, therefore, has only a short lifespan—too short for our immune system to produce sufficient antibodies. The solution to this problem is the second difference between modRNA and saRNA.

Unlike modRNA, saRNA contains an additional sequence for the replicase, as destroyed (by RNases) saRNA must be replaced by new saRNA. As natural mRNA will never self-replicate, saRNA definitely represents a genetically modified RNA (modRNA).  Put simply, saRNA is just another type of modRNA.

Why the Change to saRNA?

saRNA is the political solution: the same amount (or even more) of antigen in only one shot! The public will likely be told that due to the regular mutations of the virus, yearly adapted boosters will continue to be necessary.

Numerous preclinical and clinical studies applying saRNA technology have already been undertaken. A 2023 review in the journal Pathogens touts saRNA vaccines as “improved mRNA vaccines.” The journal Vaccines published a summary of five years of saRNA study findings. Once the requisite clinical studies are finished, these new vaccines can be approved for use. It can be expected that this process will be as quick as it was for the COVID-19 vaccines. The approval process will become simpler, as it could be argued that the technique (modRNA in lipid nanoparticles) is already approved and that only the modRNA sequence is different. Hence, these new saRNA vaccines could be injected into an unsuspecting public at any time.

While BioNTech performed experiments with saRNA (BNT162c2) but finally focused on modRNA (BNT162b2), Arcturus Therapeutics was the first to announce (in 2022) that its COVID-19 saRNA vaccine candidate ARCT-154—now the most advanced saRNA vaccine in trials—meets the primary efficacy endpoint in a phase-3 study.  In the Arcturus Therapeutics study, participants received two doses, each containing 5 micrograms of saRNA. This is far less than the modRNA concentrations used by Pfizer-BioNTech (30 micrograms/shot) and Moderna (100 micrograms/shot).

saRNA Injections Will Not Solve the Problems With modRNA Injections

As we discovered with modRNA, the spike protein is poisonous to our bodies. We know that modRNA results in the production of more spike protein than would be available during a natural infection, and we know that repeated boosters cause immune tolerance.

Compared to modRNA, a small amount of saRNA results
in an increased amount of produced antigen.

The “dose” of viral antigen that current and future RNA-based vaccines bring about will show large fluctuations from one individual to the next, depending on the cell type producing the desired antigen, genetic predisposition, medical history, and other factors. This fact alone should prohibit the use of RNA-based injections as vaccines for healthy people.

Long-Term Presentation of an Antigen Is Known to Cause Immune Tolerance

After getting vaccinated, our bodies generate antibodies, mostly immunoglobulin G (IgG), including IgG1 and IgG4.

Vaccinated individuals show an antibody class switch starting with the third COVID-19 injection (the first booster). This is from inflammatory IgG1 antibodies (that fight the spike protein) to non-inflammatory IgG4 antibodies (that tolerate the spike protein). Elevated levels of IgG4 antibodies, in the long run, will exhaust the immune system, causing immune tolerance. This may explain COVID-19 “breakthrough” infections, reduced immune response to other viral and bacterial infections, and reactivation of latent viral infections. It may also cause autoimmune diseases and uncontrolled growth of cancer.

Notably, long-term IgG4 responses have been significantly associated with RNA-based injections, while individuals with a COVID-19 infection prior to vaccination exhibited no increased IgG4 levels, even when they received a shot after the infection.

This observation clearly discredits the World Health Organization’s policy that—assuming people have no immunity against novel viruses (completely ignoring the reality of cross-immunity)—people should be vaccinated before they come into contact with the virus.

RNA-Based Injections Are Recognized as Gene Therapy Products

Incomprehensibly, RNA-based injections for protecting against infectious diseases were named “vaccines,” which allowed exclusion from the strict regulations for gene therapy products (GTPs). Again, this happened without providing the public with any scientific justification.  Details on the regulatory issues of RNA-based vaccines are reported in excellent and comprehensive reviews by Guerriaud & Kohli and Helene Banoun.

In 2014, Uğur Şahin, already CEO of BioNTech, co-wrote an article published in Nature about developing a new class of drugs, “mRNA-based therapeutics.” The authors wrote, “One would expect the classification of an mRNA drug to be a biologic, gene therapy or somatic cell therapy.”

In 2021, the author of correspondence printed in Genes & Immunity described RNA-based vaccines created by Moderna and Pfizer-BioNTech as “a breakthrough in the field of gene therapy” and “a great opportunity for the FDA and EMA to revise the drug development pipeline to make it more flexible and less time-consuming.”

Two disturbing pieces of information have now come to light:

The contaminating DNA results from Pfizer-BioNTech’s change in the manufacturing process after finishing the BNT162b2 (Comirnaty) Clinical Trial C4591001. Initially (Process 1), Pfizer-BioNTech modRNA was produced by in-vitro transcription from synthetic DNA and amplified by PCR (polymerase chain reaction). However, to scale up manufacturing (see rapid responses to this BMJ study), modRNA encoding DNA was cloned into bacterial plasmids (Process 2). Put simply, the clinical trial was run on process-1 lots, but the world’s populations received process-2 lots.

This means that individuals who gave consent to be vaccinated
were injected with a substance different from the one approved
by regulatory agencies and to which they had consented.

It is now irrefutable that the RNA-based COVID-19 injections contain DNA.

RNA-based technology—especially when applied as vaccines to healthy individuals—is unjustifiable and unethical. Independent from the tragic number of adverse events or excess mortality rates, it is the technique that is the issue, and the same problems will occur in all future RNA-based “vaccines.”
RNA-based “vaccine” technology goes against the central idea of evolution over the past millions of years. While injected modRNA and saRNA produce antigens without stopping, in fact, the short lifespan of natural messenger RNA (mRNA) is a prerequisite for healthy and specific cell functions. (The short lifespan of mRNA allows our cells to adapt as quickly as possible to changing circumstances and avoid the production of unnecessary proteins.)

A premise of RNA-based “vaccine” technology—that all of our body cells have to
produce a foreign viral protein—goes against fundamental biological principles,
like distinguishing between our own cells and foreign invaders,
and will result in our immune system attacking our own cells.

RNA can be reverse-transcribed into DNA even without the presence of (the enzyme) reverse transcriptase (i.e., by LINE1 elements present in our genome/DNA). Contaminating DNA (in RNA-based vaccines) is the rule rather than the exception. As both RNA and DNA can be integrated into the human genome, the so-called “vaccines” based on RNA technology are actually gene therapy products.

It is in no way justifiable to subject RNA-based GTPs for medical use to strict controls but to exclude RNA-based GTPs, called vaccines, from these regulations even though they are intended for most of the human population. Even in an emergency, no one should be forced to be injected with any substance—least of all by politicians.

What is Genetic Engineering?

What Did COVID-19 Teach Us About Science, Politics, and Society?

For many years, scientists dreamed of manipulating human “software”—that is, DNA or RNA. Ethically, manipulating DNA has always been taboo. In retrospect, COVID-19 may represent the dawn of RNA-based “vaccines” and the end of the taboo against manipulating human DNA.

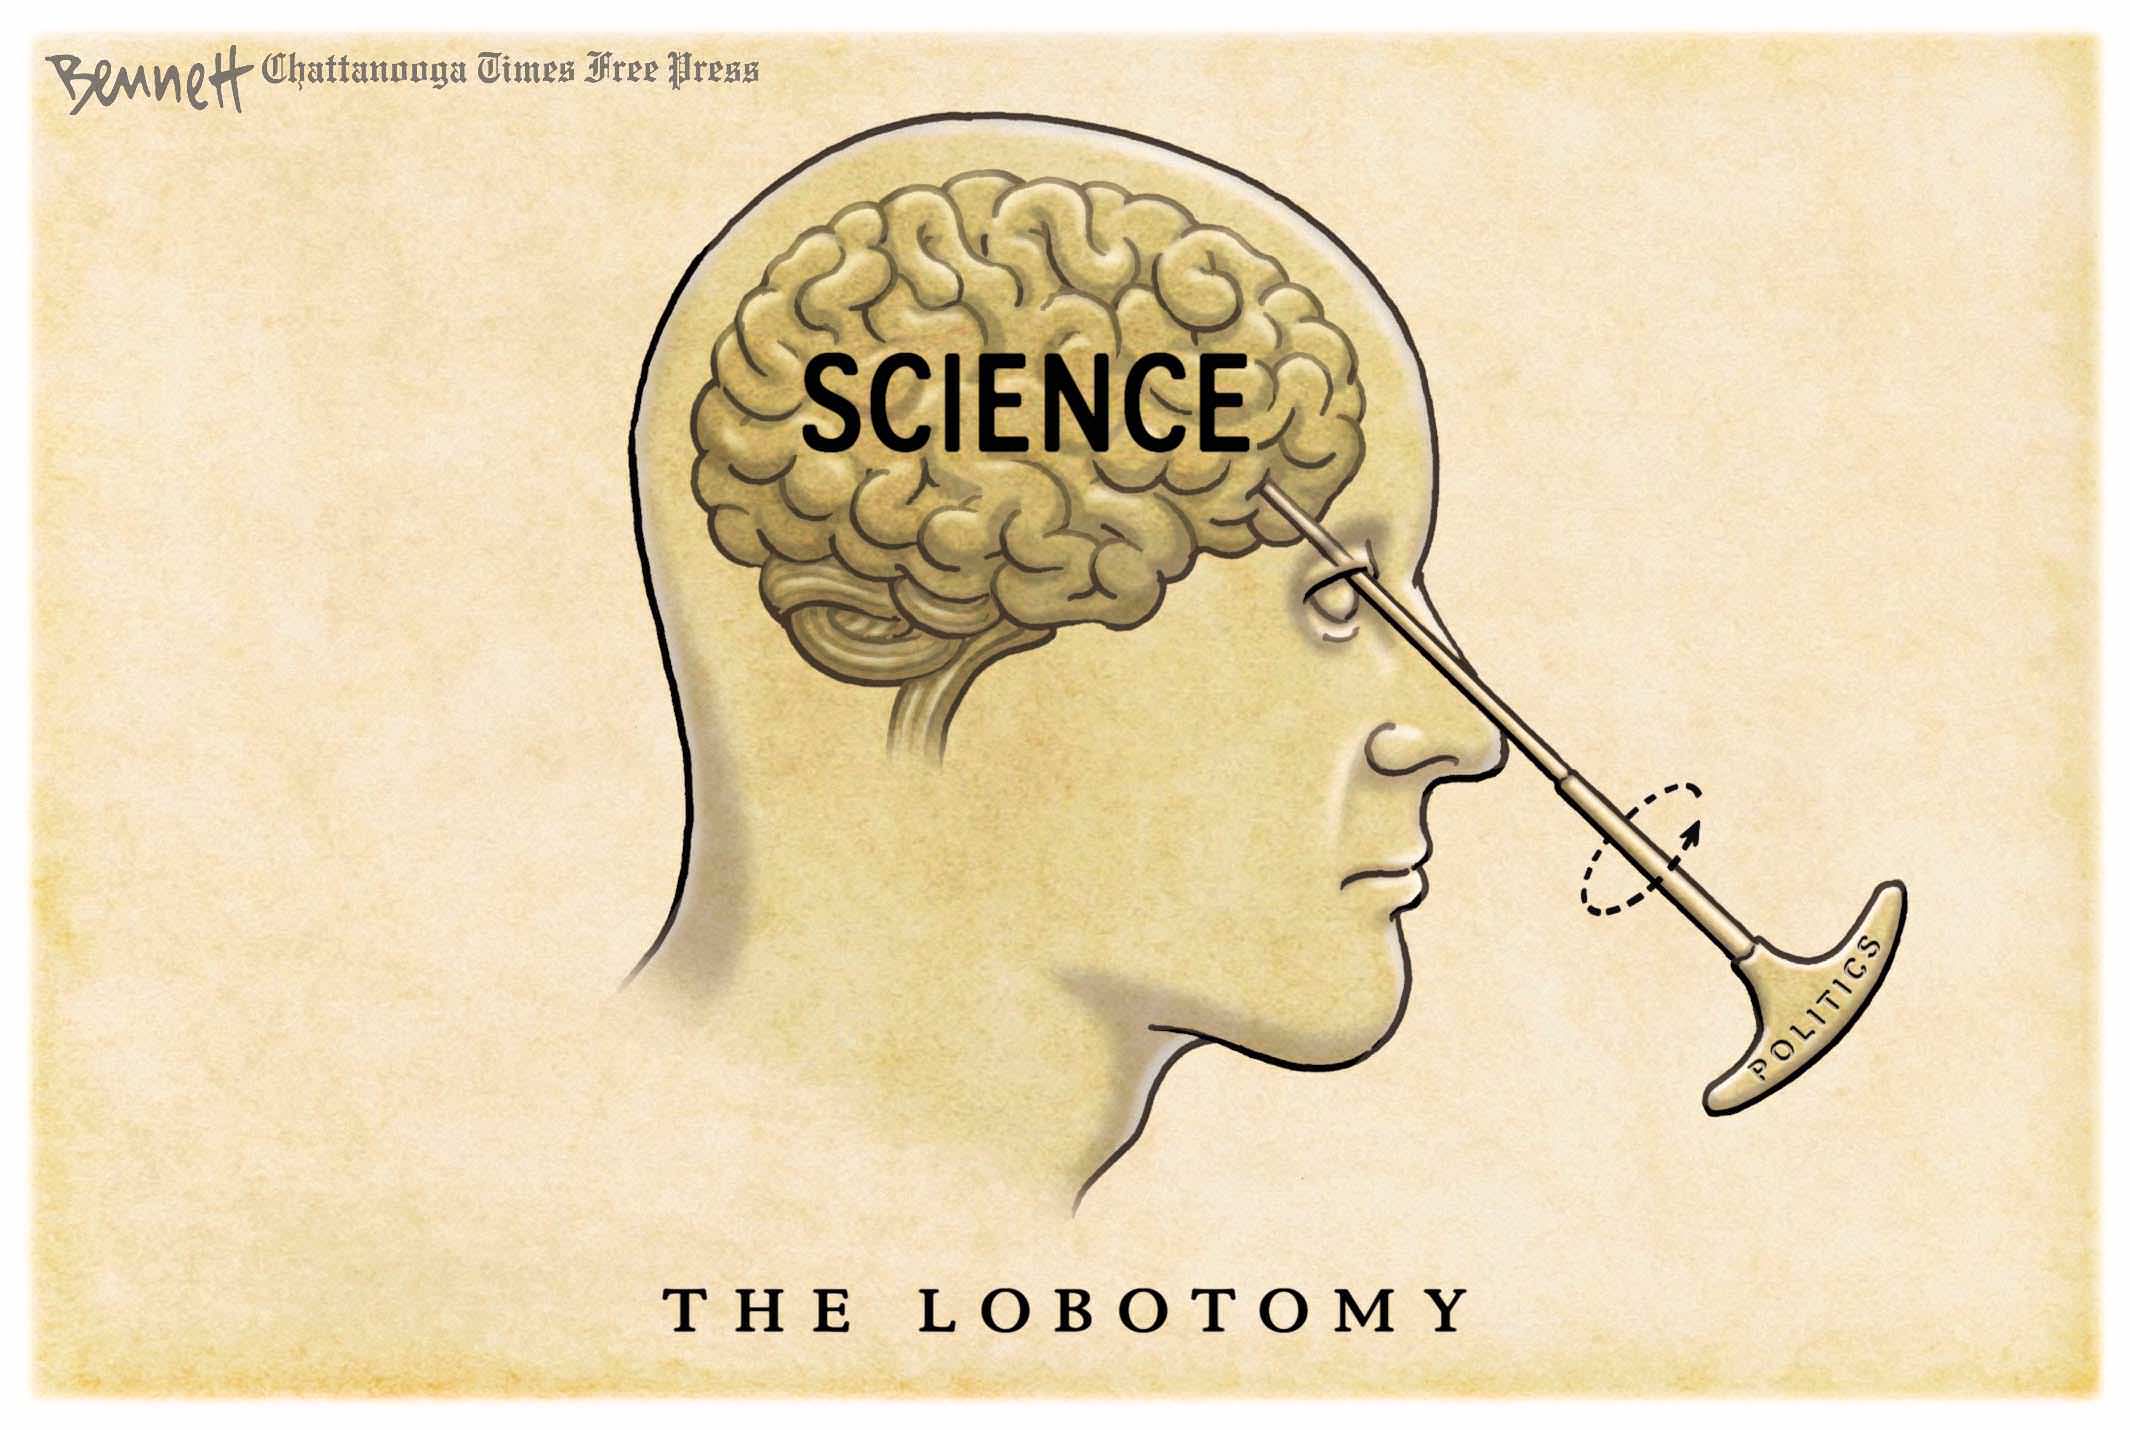
In a 2023 commentary in the Journal of Evaluation in Clinical Practice, the authors wrote that from the earliest days of the pandemic, it was obvious that some influential scientists and their political allies demonized dissenting scientific views and evidence offering a second opinion. Despite contradictory evidence, national politicians “assured the public that they were adopting COVID-19 policies by ‘following the science.’” However, scientific consent was achieved only by suppressing scientific debate.

Remember: When questions are allowed, it is science;
when they are not, it is propaganda.

So-called “experts” selected by politicians told us that we must be vaccinated to be able to fight a new respiratory virus. This contradicts the science of the human immune system. Our immune systems are dynamic and can clear a virus they have never encountered; they can also develop cross-immunity to identify variants even if the virus mutates. However, since RNA-based vaccines will produce a single antigen, our immune system is deprived of the possibility of developing cross-immunity against virus variants. This applies, in particular, to respiratory viruses exhibiting a high mutation rate. In the long run, this will lead to an increase in both the frequency and the severity of infectious diseases. Thus, politicians interested in protecting the population against future infections would be well-advised to offer health programs that strengthen the immune system before seasonal infections.

Scientists haven’t the faintest idea of how to direct modRNA or saRNA to a specific cell type or how to stop the translation of administered RNA. However, they continue to study how the stability of injected RNA and the amount of generated antigen can be further increased. The current development of RNA-based vaccine technology reminds one of the poem “The Sorcerer’s Apprentice,” which German poet Johann Wolfgang von Goethe wrote over 200 years ago:

“The spirits, whom I’ve careless raised, are spellbound to my power not.”

Source: Disney’s Sorcerer’s Apprentice

Climate “Loss and Damage”: Political, Not Scientific Notion

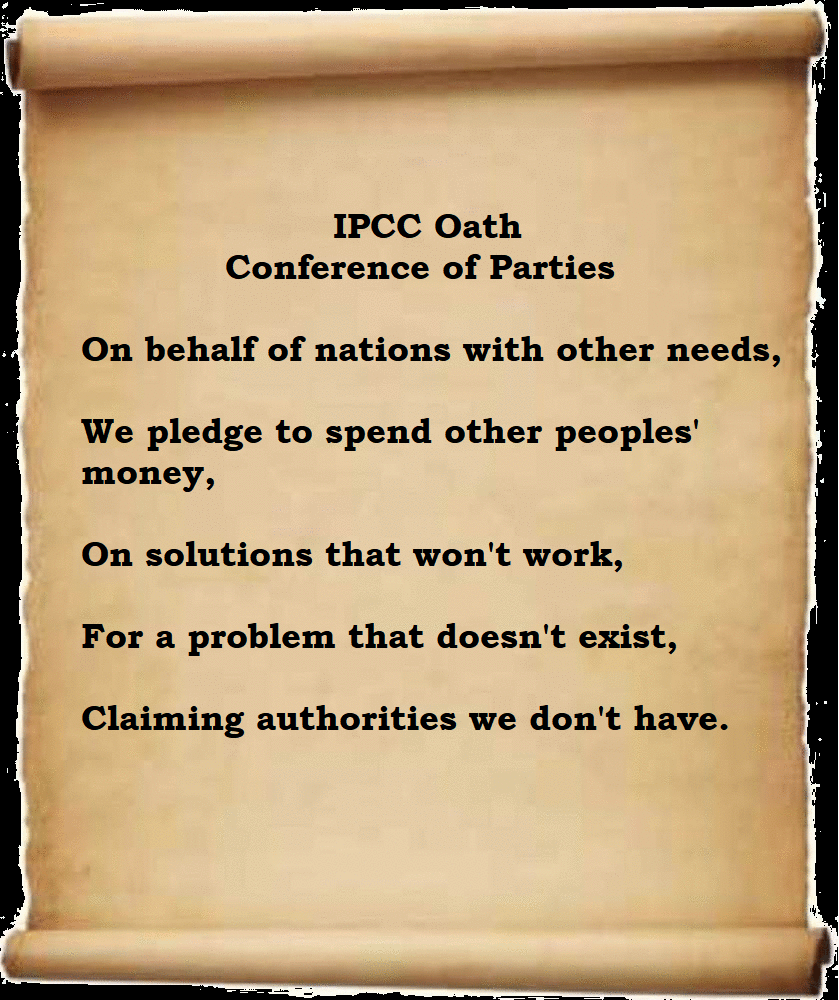
The media is replete with announcements of a “breakthrough” agreement at COP28 to make “operational” a fund through which “developed” countries compensate “developing” countries for “loss and damage” from “climate change.”  The six terms in quotations highlight the ambiguity depending on how those words are defined.  Let’s start with “breakthrough “, “operational” and “developed” vs. “developing” countries.

From Nature: First cash pledged for countries devastated by climate change: COP28 starts with historic decision. Excerpts in italics with my bolds.

Draft resolution on a ‘loss and damage fund’ has attracted more than
$400 million, but climate-vulnerable countries say more cash is needed.

Researchers and campaigners welcomed the move, while recognizing that much more is needed and that pledges are not the same as money in the bank.  “It remains to be seen how much money rich countries, developed countries and the polluting countries will be willing to put into that fund,” says Romain Weikmans, a climate-finance researcher at Université Libre de Bruxelles in Brussels.

Countries calling for the fund, especially those highly vulnerable to climate change, are expecting it to eventually reach at least $100 billion per year. Tom Mitchell, executive director of the International Institute for Environment and Development, an environmental-research think tank in London, says the total amounts so far “are really, really very modest”. Some of the least developed countries see the US commitment as “a slap in the face”, he adds.

Further details, such as how much of the money will be given out as grants versus loans and who will be eligible to receive funding have not been announced. [China, India?]

RTE adds: Questions Remain

There’s still a lot that needs clarifying about this fund. Some of the big outstanding questions include the fund’s size, its relationship to other funds, how it will be administered over the long term, and what its funding priorities will be.

In response to the announcement, leading African think-tank representative Mohamad Adhow noted there were “no hard deadlines, no targets, and countries are not obligated to pay into it, despite the whole point being for rich, high-polluting nations to support vulnerable communities who have suffered from climate impacts”.

Many Issues with Climate “Loss and Damage”

Roger Pielke Jr. explains the other problems with this initiative in a recent talk at the Canadian Global Affairs Institute Climate Change, Disasters, and the Rightful Place of Science  Excerpts in italics with my bolds.

“One thing I’d like to make clear is that climate change is real. It’s serious, and it deserves urgent attention to both mitigation and adaptation,” Pielke said. “But I’ve come to see, across my career, that the importance of climate change is held up by many people as a reason for why we can abandon scientific integrity. This talk is about climate and scientific integrity, how we maintain it, and how we use it in decision-making. Reasonable people can disagree about policies and different directions that we want to go, but none of us are going to benefit if we can’t take expertise and bring it to decision-making to ground policymaking in the best available knowledge. Overall, climate science and policy have a narrative problem.”

Hurricanes

In addressing the narrative problem, concerning the first area of public discourse- hurricanes, Pielke displayed a graph of official data from the National Oceanic and Atmospheric Administration. It displayed landfalling hurricanes in the U.S. and showed a long-term trend of no increase in hurricanes overall – despite environmental websites claiming the opposite. Pielke noted the reason for misreporting is the fact that there were no major hurricanes to hit the United States between 2005 to 2017, a pause reflected in the data chart which had a gap there from 2005 to 2017. So if you recently became climate aware in the last 20 years, which many in the media have, you would think that hurricanes were increasing.

“That’s why we do science – because our lived experience is not a good substitute for looking at data and evidence,” Pielke said. “So if you’re paying attention to the news, just this week, it was all over the news that the proportion of hurricanes that have become major hurricanes has increased. Well, not according to the science. So, one of the challenges that I try to emphasize is that there is good information out there.

If the media ignores it and in the political debates it’s ignored,
then it’s all of our responsibility to ferret out what’s real.”

Disasters

In addressing his second subject, disasters, Pielke differentiated disasters from extreme weather defining a disaster as an extreme weather event that intersects with an exposed and vulnerable society.

He quoted from an October 21, 2023 Financial Times article that at a private event last month, one executive at Lloyd’s of London that oversees the market told underwriters that they had not yet seen clear evidence that a warming climate is a major driver in loss claims. Pielke attended the event in person and perceived a concern in the room that anyone making that statement publicly would be called a climate denier, leading to a suppression or minimization of the statement.

Pielke also addressed UN Secretary-General António Guterres’ claim that the number of weather, climate and water-related disasters has increased by a factor of five over the past 50 years. He noted that Guterres used data from the Centre for Research on the Epidemiology of Disasters (CRED) to make this claim. Pielke referred to notes in CRED reports that have advised for decades “Don’t look at our data and use it to say anything about the weather” and advises their data shows the evolution of registration of natural disaster events over time, which has increased with better means of communication.

As well, since there is more international aid for disaster affected
communities, more communities are reporting.

The number of global weather and climate disasters has declined this century.

On the subject of U.S. disasters, in his sixteen years of affiliation with the National Oceanic and Atmospheric Administration, Pielke observed a reporting phenomenon – an addiction to reporting billion-dollar weather disasters. The reports are used by advocacy groups, and then the media, who publicize that climate change is causing more billion-dollar weather disasters, something Pielke says isn’t supported by science. He points out that as the United States has gotten wealthier, the actual proportion of that wealth that is damaged in disasters has gone down dramatically.

Misinterpreting Climate Scenarios

Pielke then addressed his third subject, climate scenarios and the effect of misinterpretation.

He referred to the Special Report on Emissions Scenarios (SRES) – a report by the IPCC that was published in 2000. The 1,184 greenhouse gas emissions scenarios described in the Report have been used to make projections of possible future climate change. Pielke noted that the area of discussion of climate scenarios “is so full of jargon and technical details, that it is almost impenetrable”. Since 1,184 scenarios weren’t easy to study, the community decided to simply to study the four you see represented by the four bold blue lines on the first graph below- namely RCP8.5, RCP 6.0, RCP4.5 and RCP2.6.

(RCP 4.5 is described by the IPCC as a moderate scenario in which emissions peak around 2040 and then decline. RCP 8.5 is the highest baseline emissions scenario in which emissions continue to rise throughout the twenty-first century. Climate change projected under RCP 8.5 will typically be more severe. RCP 2.6 at the bottom is what today we would call the Paris Accord target)

Pielke pointed out that the assumption underlying all the SRES scenarios is that the world is going to turn to coal as the dominant energy source in the 21st century. For this to happen, Pielke calculates that over 3000 new coal plants would have to be built by the year 2100, which he says won’t happen and the IEA expectation is in agreement. However, the Canadian government, the U.S. government, and the Indian government, all rely on the RCP 8.5 scenario and it is pervasive in global climate policy as the IPCC remains focused on it. Pielke points out that all the SRES scenarios have assumptions about GDP, the carbon intensity of energy, and more that are already out of date. Pielke also pointed out that the scientific community has increasingly relied on RCP 8.5 – the most extreme scenario and in 2023, the RCP 8.5 remains the most used scenario in research with many studies published each day using it.

“So why is that?” Pielke said. “The reason is, if you do a study with RCP 8.5 with massive amounts of emissions to 2100, you’re going to get big effects. You can publish that in a prominent journal. Your university will put out a press release on it. You might even get into the New York Times because these very extreme scenarios are notable. Scientists agree there are legitimate reasons for using extreme scenarios in research. Usually, it’s what we call exploratory research, not projective research. Scientists tell me ‘Well if we want to separate the signal of forced climate change from the noise of internal climate variability, we need these strong scenarios’.”

Pielke referred to this attitude as “noble cause corruption”- the idea that
less rigorous science and even bad science is excusable if it advances a cause.

A revision of the scenario projections was initiated in June 2023 and the process of generating the next generation of scenarios has begun and Pielke reports they have removed the top RCP8.5 and RCP 6.0 scenarios. However, he says because we are currently using scenarios developed in the early 2000s, leading media and advocacy narratives which use them extensively are problematic “because a lot of bad science has gotten mixed in with the good science and it’s really hard to tell the difference.”

Background Loss and Damage Post

Climate Loss and Damage Fails Again