How Warmists Turn the Public Off

Wildfires raging outside Athens this summer are just one reason environmentalists are raising alarms louder than ever — even as many activists insist their messages lack the proper resonance with voters. AP

Kevin D. Williamson explains at NY Post Why climate change activists have failed to score public support.  Excerpts in italics with my bolds.

We are hearing even more than usual about climate change this summer and that is not surprising — not with dog-days news cycles driven by record-setting heat waves, torrential rains and widespread Canadian wildfires.

Some climate activists think we are not hearing enough about the issue: Writing in The Guardian, columnist Jonathan Freedland insists that the problem is one of marketing. “The climate movement has devoted relatively few resources to reaching or persuading the public,” he writes, preposterously.

He quotes progressive p.r. man David Fenton — “We’re in a propaganda war, but only one side is on the battlefield” — and cites former United Nations climate grandee Christiana Figueres, who claims “the climate community has recoiled from marketing.” Why? Because, Figueres says, it is “sort of tainted. It’s icky. You know, ‘We’re too good for marketing. We’re too righteous’. . . Hopefully we’re getting over it.”

Of all the dumb and dishonest things that have been written and said in the climate debate, the notion that climate-change activists just can’t get their message out — that they won’t stoop to marketing — may be the very dumbest and most dishonest.

Billions of dollars have been spent on climate-change advocacy,
to say nothing of money devoted to actual climate policies.

Raging wildfires in Eastern Canada have sent vast plumes of smoke across North America this summer. Environmentalists loudly suggest the smoke is proof of a changing planet, even as progressives insist their agenda is being silenced. via REUTERS

The government leaders of practically every democratic country speak about the issue constantly.

In the intergovernmental sector, you have everybody from the United Nations to the International Monetary Fund ringing the climate alarm bells, while in the private sector you can count on the likes of BlackRock, Goldman Sachs and other corporate titans to do the same.

ESG rules have pushed the climate issue onto the corporate agenda in a big way—companies are spending billions in total (as much as $1.4 million per company) on climate-reporting costs alone.

Even the supposed villains in the story — big energy companies such as ExxonMobil — spend billions of dollars a year advertising the green agenda. “In the past ten years we have reduced greenhouse gas emissions in our operations by more than 7 million metric tons,” ExxonMobil boasts, “which is the equivalent of taking about 1.4 million cars off the road.” You may not think they are sincere, but they are far from silent about the issue.

Companies such as private equity biggie BlackRock are spending billions on ESG programs, which link their investment strategies with left-wing social goals. REUTERS

Climate activists have the commanding heights. What do the so-called deniers have?
A few of my cranky libertarian friends.  .  . And voters.

The real issue with climate policy isn’t that voters don’t know about the issue — it is that they disagree. Climate policy touches everything from big tech to farming to economic growth, everything from the homes we live in to the cars we drive, and, as such, an ambitious climate program will necessarily impose big costs.

The Alexandria Ocasio-Cortezes of the world can pretend that green policies will pay for themselves, but no serious person believes that.

One of the clearest ways to reduce our reliance on fossil fuels is to expand access to nuclear energy, which requires major investment in new infrastructure. Getty Images

Sure, Guardian headline writers can straight-up declare “The beauty of a Green New Deal is that it would pay for itself” — this is nothing more than that “marketing” to which our green friends supposedly are so averse.

American voters do care about climate issues, but not as intensely as activists would like. Climate routinely polls in the single digits when it comes to voters’ top concerns, far behind (surprise!) the economy and health care.  Independents rate immigration a more pressing issue than climate change.

Maybe you think the US government is under the heel of the oil barons, but no democratic country has undertaken the kind of economic transformation climate activists advocate.

The signatories of the Paris Agreement are far from meeting their climate obligations; the $100 billion a year in climate-finance commitments promised at the UN climate summit in Glasgow have not been fully funded; even in the European Union, the leaders of which take a much stronger climate line than their US counterparts, there has been no radical change.

A coal excavator in Germany, which boosted coal mining in the wake of gas shortages caused by the Ukraine crisis. AP

Germany responded to Russia’s recent energy blackmail by reopening coal plants.

European voters rank climate a higher priority than Americans do, but it typically polls behind economic growth and immediate issues such as the invasion of Ukraine.

That is not oil-drenched propaganda at work— that is, for better and for worse,
democratic politics at work.

While there has been piecemeal progress, countries across the globe are moving at a glacial pace when it comes to the one policy that can reliably reduce greenhouse-gas emissions at a reasonable cost: rapidly expanding nuclear power, which has an operational carbon footprint of approximately zero.

The state government in Pennsylvania got that collapsed interstate overpass reopened in record time by waiving all sorts of planning and permitting rules, but no such urgency exists in the case of nuclear power or other needful energy infrastructure.

Christiana Figueres, who leads the UN’s climate change campaign, contends that environmental issues suffer from a lack of proper marketing. Many would certainly disagree. LightRocket via Getty Images

That, unfortunately, is democracy, too.  What is needed is not more marketing — more propaganda, more hysteria.   What is needed is a more attractive set of trade-offs.

But finding better trade-offs means admitting that there are trade-offs, which climate activists — hostage to their marketing departments — have too often refused to do.

Promises made at major multi-national climate conferences such as the Paris Accords remain unmet as liberal democracies appear unable to overhaul their energy strategies. Getty Images

It isn’t that climate activists aren’t selling their agenda — it is that
voters in democratic countries around the world are not buying it.

Arctic Ice Surplus End July 2023

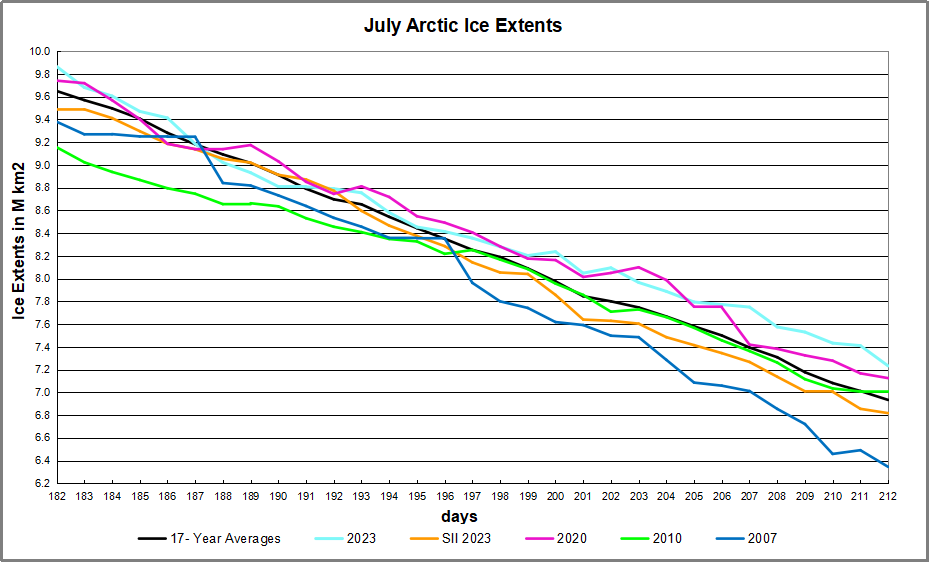
The animation above shows the Arctic sea ice extent on day 212 (end of July) from 2007 to yesterday 2023. Unsurprisingly the distribution varies, most notably there being less open water 2023 along the Russian shelf seas on the left side.  OTOH, Hudson Bay in most years still has some ice, but this year not.  Overall, Arctic ice this year is in surplus to the 17-year average and to 2007.

The graph above shows the July monthly average ice extent for the last 17 years for both MASIE and SII datasets.  Most years SII is slightly lower with the MASIE average at 8.279M km2 and SII at 8.033 (not shown).  Note that 2007 was near the lowest in the period and 2023 among the highest.

The graph for the last 30 days shows the normal melt is 2.7M km2 down to 6.9M km2.  2023 was tracking average for 2 weeks, and well above average after that.  SII tracked the MASIE average throughout, and sllghtly lower the second half. 2007 was average mid-July, but dropped much lower toward the end.

The table for day 212 shows how the ice extent is distributed across the Arctic regions, in comparison to 17 year average and 2007.  2023 was ~300k km2 above average, or 4% of total extent.

Region 2023212 Day 212 Average 2023-Ave. 2007212 2023-2007
 (0) Northern_Hemisphere 7232358 6936889  295469  6344860 887498 
 (1) Beaufort_Sea 723443 799968  -76525  760576 -37133 
 (2) Chukchi_Sea 659025 540756  118269  382350 276675 
 (3) East_Siberian_Sea 675190 756025  -80835  445385 229805 
 (4) Laptev_Sea 474071 371485  102587  314382 159689 
 (5) Kara_Sea 265568 161953  103615  239232 26336 
 (6) Barents_Sea 54417 29804  24612  23703 30714 
 (7) Greenland_Sea 328529 296824  31705  324737 3792 
 (8) Baffin_Bay_Gulf_of_St._Lawrence 243516 144525  98991  94179 149337 
 (9) Canadian_Archipelago 514780 555079  -40299  510063 4717 
 (10) Hudson_Bay 79485 143888  -64403  93655 -14170 
 (11) Central_Arctic 3213192 3134907  78285  3154837 58355 

The table shows earlier than average melting in Beaufort and East Siberian seas and Hudson Bay.  Surpluses are everywhere else, especially in Chukchi, Laptev and Kara Seas, as well as Baffin Bay and Central Arctic.  2007 was nearly a full Wadham less than 2023 yesterday.

Illustration by Eleanor Lutz shows Earth’s seasonal climate changes. If played in full screen, the four corners present views from top, bottom and sides. It is a visual representation of scientific datasets measuring Arctic ice extents and snow cover.

Ocean Warming Mystery: Two Natural Factors

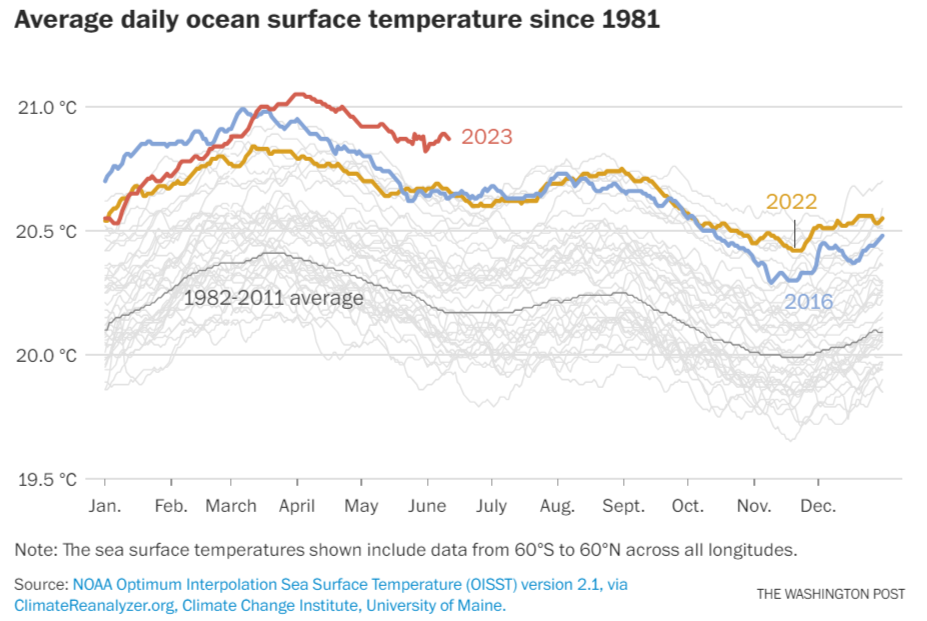
Many have seen the media news splash of ocean warming.  For example, from Washington Post Scientists are baffled why the oceans are warming so fast.  The image above comes from that article, excerpts below with my added bolds.

A steady and remarkable rise in average global ocean temperatures this year is now outpacing anything seen in four decades of satellite observations, causing many scientists to suddenly blare alarm over the risks and realities of climate change. But even those typically aligned on climate science can’t agree on what, exactly, triggered such rapid warming and how alarmed they should be.

Some climate researchers suspect that a drastic reduction in air pollution from ships has allowed more sunlight to radiate into oceans, a conclusion others vigorously criticize. Meteorologists also say a weakening of Atlantic winds may be encouraging warming; normally these winds help cool waters and carry sun-blocking plumes of Saharan dust.

Scientists nonetheless agree on this: Conditions are ever ripening for extreme heat waves, droughts, floods and storms, all of which have proven links to ocean warming.

In the Pacific Ocean, warming temperatures are to be expected during El Niño — its impacts on weather around the world stem from warmer-than-normal surface waters along the equatorial Pacific. But the extreme warmth extends beyond the Pacific. Record warmth is also occurring in the equatorial and northern Atlantic — and in the tropics, where hurricanes form.

“This is totally bonkers and people who look at this stuff routinely can’t believe their eyes,” Brian McNoldy, a hurricane researcher at the University of Miami, wrote on Twitter. “Something very weird is happening.”

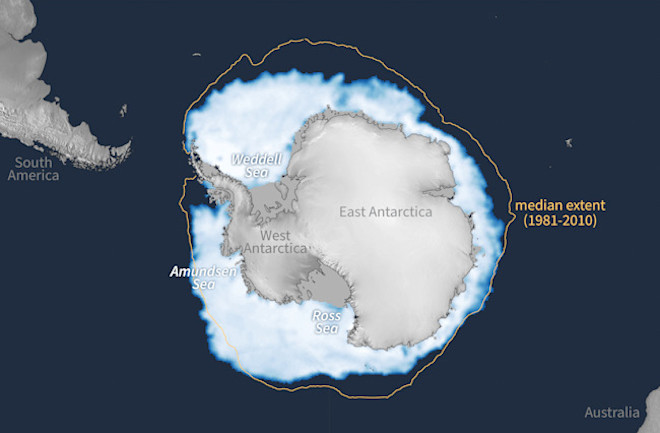
Antarctic sea ice concentration on June 27, 2023, with white representing solid ice and dark blue representing open ocean. The median ice edge for 1981–2010 is drawn in orange. (Credit: Map by NOAA Climate.gov, based on data from the National Snow and Ice Data Center)

And of course there is the added warning about Antarctic sea ice not freezing as rapidly as usual in SH winter.  The media always refers to “climate change” as the causal factor, which is code for rising CO2 and humans to blame.  For a more reasonable discussion, see Antarctic Sea Ice Varies, It’s Complicated.

What About Natural Factors?

Because the power, glory and money comes from CO2 hysteria and taking over the energy industry, the theories are all about the atmosphere.  Realists know that Oceans Make Climate, and look for more direct means by which sea temperatures can warm.

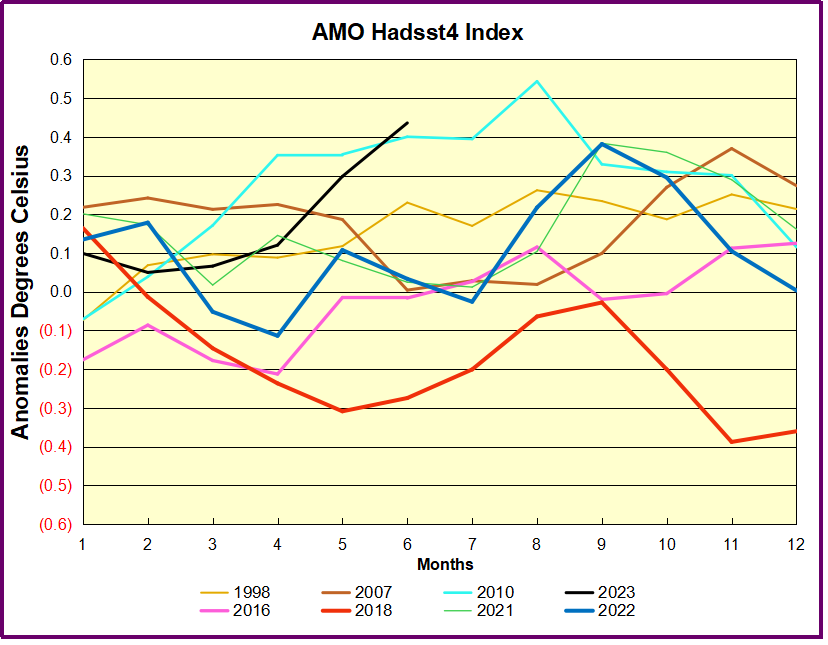
The HadSST4 AMO dataset was finally updated and showed dramatic 2023 warming in the North Atlantic. Let’s consider two possibilities.

1.  The Ocean Warming Could Be Bottom Up

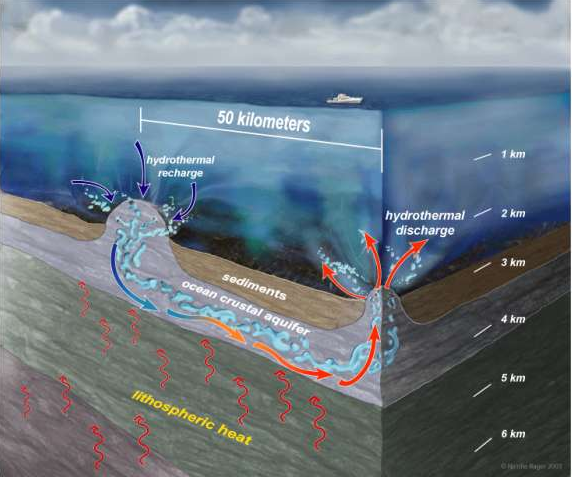
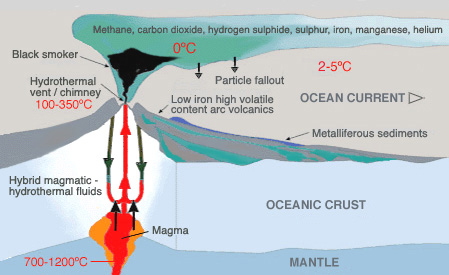
An article from CICOS explains the importance of hydrothermal action on the ocean floor.  Excerpts in italics with my bolds and added images.  Scientists Discover Three New Hydrothermal Vent Fields on Mid-Atlantic Ridge

An international team of scientists led by CICOES researcher David Butterfield
work together to rapidly find and explore large hydrothermal vents
on the world’s longest mountain range.

Sometimes Mid-Atlantic ridge is called the “40,000-mile Volcano”

Scientists have discovered three new hydrothermal vent fields over a 434-mile-long stretch of the Mid-Atlantic Ridge during the first scientific expedition aboard Schmidt Ocean Institute’s recently launched research vessel Falkor (too).

The multidisciplinary science team representing 11 institutions from the United States, Canada, and France used advanced ocean technologies to make the discovery. Scientists used autonomous and remotely operated underwater vehicles resulting in 65 square miles (170 square kilometers) of seafloor mapped at one-meter scale resolution, an area approximately the size of Manhattan Island.

The discovery of the active hydrothermal vents is the first on this section of the world’s longest underwater mountain range, the Mid-Atlantic Ridge, in more than 40 years. One of the discovered vent fields was located at the Puy des Folles volcano and has five active sites over 6.95 square miles (18 square kilometers). High-temperature ‘black smoker’ vents were also found at the Grappe Deux vent system and Kane Fracture Zone.

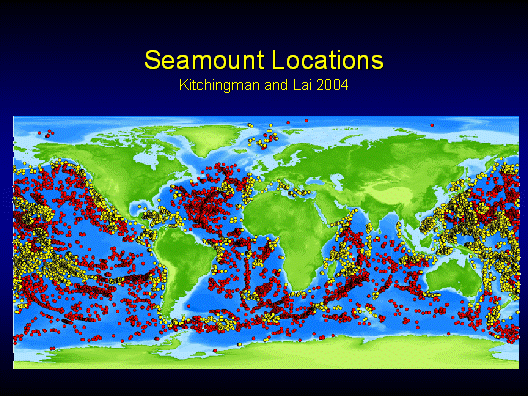
This discovery of new hydrothermal vents under the Atlantic ocean reminds of hundreds of thousands of sea mounts active on the ocean floor, with a high concentration in the North Atlantic  For a more complete discussion of bottom up ocean warming, See Post:

Overview: Seafloor Eruptions and Ocean Warming


2. It May Be the Aftermath of Hunga Tonga Eruption 2022

Khaykin et al. (2023) explan the climate impact in their article Global perturbation of stratospheric water and aerosol burden by Hunga eruption.  Excerpts in italics with my bolds.

The eruption of the submarine Hunga volcano in January 2022 was associated with a powerful blast that injected volcanic material to altitudes up to 58 km. From a combination of various types of satellite and ground-based observations supported by transport modeling, we show evidence for an unprecedented increase in the global stratospheric water mass by 13% relative to climatological levels, and a 5-fold increase of stratospheric aerosol load, the highest in the last three decades. Owing to the extreme injection altitude, the volcanic plume circumnavigated the Earth in only 1 week and dispersed nearly pole-to-pole in three months.The unique nature and magnitude of the global stratospheric perturbation by the Hunga eruption ranks it among the most remarkable climatic events in the modern observation era, with a range of potential long-lasting repercussions for stratospheric composition and climate.

The perturbation of stratospheric water vapour burden by 13% is tremendous and has no frame of comparison in the entire observation record dating back to 1985. As there are no efficient sinks of water vapour in the stratosphere, this perturbation is expected to last over several years. Indeed, in 9 months since the eruption, the water vapour mass anomaly has gradually decreased only by 2.5% (4.3 ± 0.1% annual rate), which should lead to the perturbation timescale of over 3 years, assuming the further linear decay trend. The persistent stratospheric moist anomaly may lead to changes in atmospheric radiative balance; stratospheric dynamics as well as amplification of the polar ozone depletion through wider occurrence of polar stratospheric clouds. The ability to assess the longer-term impacts of the HT eruption on stratospheric chemistry will depend strongly on the quality and availability of global satellite observations such as MLS in the coming years.

In addition to blasting seawater to the stratosphere, the event shook the ocean floor worldwide.  

The massive volcanic blast in the Pacific last year was felt 18,000km away on the other side of the world, on the floor of the Atlantic Ocean.  The cataclysmic eruption of Hunga-Tonga Hunga-Ha’apai on 15 January 2022 sent pressure waves through Earth’s atmosphere that connected with the sea surface and triggered 50 highly sensitive seismometers placed 5,000m under water on the seabed.  It was one of a number of intriguing phenomena picked up by the instrument network in the Azores-Madeira-Canary Islands region. Source:  BBC

Summary

Let’s stop pretending we can alter nature by spending trillions of dollars “fighting climate change.”  Better to solve actual problems we are causing and can fix, rather than obsessing over imaginary ones.


Heatless in Seattle Summer 2023

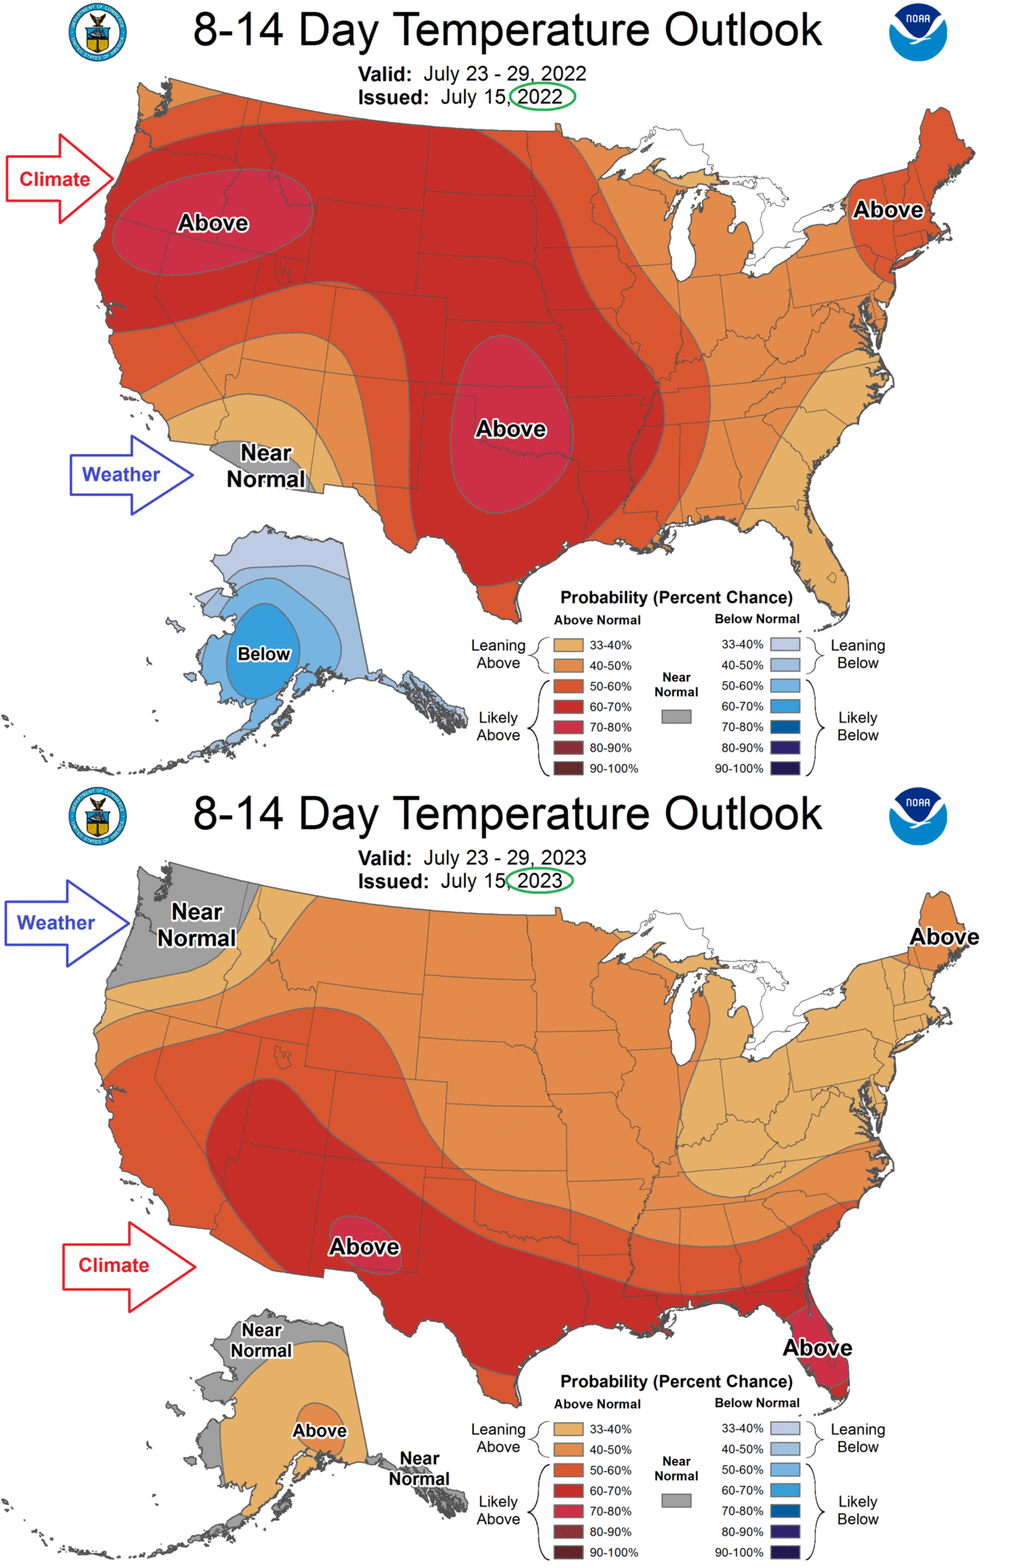
With all the media noise about “Global Boiling”, they must think we are all frogs in a pot on the stove (electric, no gas permitted).  And yet, what a difference a year makes in the US Northwest, as Cliff Mass reminds at his blog A Summer Without Extreme Heat in the Northwest.  Excerpts in italics with  added images.

With all the talk of heat waves in the media these days, it is fascinating to note that the Pacific Northwest has NOT had extreme heat this summer.  

No major heatwaves.   A lack of warm temperature records.

A really moderate, benign summer regarding high temperatures.  And the temperate weather is not over.

And more surprises…there is really little evidence over the past decades of increases in extreme July heat in our region.

Let me show you some data, to prove the above to you.

Just a reminder….the end of July is climatologically the warmest time of the year (see the climatology of SeaTac Airport, below).   By the end of August, solar radiation has declined so much that the temperatures inevitably decline.


A July Without Extreme Heat

Below you will find plots of the highest temperature in July over many decades for five local stations:  Olympia and Bellingham in western Washington, Wenatchee and Kennewick in eastern Washington, and Portland, Oregon.  I have plotted the July highs for the entire period of record and plotted a linear trend line for your reference.

Really interesting.   The high temperatures in July at these stations have been very average and FAR below record levels.  

Most of you have not needed AC this month.

Perhaps Shocking to Some
Now look at the trend of the extreme July temperatures above (brown lines) and you will notice something that is perhaps surprising:  there are no large increases in record July temperatures over many decades.
About a 1°F increase at Bellingham and Olympia, roughly .5 °F at Portland and Wenatchee, and a DECLINE of roughly 2 F at Kennewick over many decades.
The background global warming of mean temperatures is about 2F.  Our regional extremes are going up LESS than that.  
There is no local amplification of extreme temperatures as the planet slowly warms.
To bring home the message of the lack of extreme temperatures this July, below are the temperatures at Olympia and Wenatchee (blue bars showing observed highs and lows), with record daily highs shown by the red colors.
No daily high-temperature records were broken.  None. Nada. Zippo.

Finally, the moderate temperatures are not over.  

To illustrate, the latest 7-day forecast from the European Center ensemble (shown below) indicates cooler than normal conditions (blue colors) over and west of the Cascade crest (this is for the daily average temperature, NOT the high temperatures).
As noted in my previous blogs, the lack of extreme high temperatures is associated with a persistent atmospheric circulation pattern.  It also helps explain the lack of wildfires over the region.


What’s Wrong with ESG Investing? Plenty

Investors Sour on ESG Activism

Andy Puzder explains how bogus and damaging is ESG investing.  Perhaps others are getting the memo.  WSJ reports with a sad tone what is actually good news that investors are pushing back against ESG political correctness. Their article is: ESG Blowback: Exxon, Chevron Investors Reject Climate Measures  Excerpts in italics with my bolds.

An investor-driven climate change push at some of the
world’s largest oil companies has stalled out.

On Wednesday, Exxon Mobil and Chevron’s shareholders struck down a raft of proposals urging the companies to cut greenhouse-gas emissions derived from fuel consumption, put out new reports on climate benchmarks and disclose certain oil-spill risks, among other initiatives.

The votes were abysmal for climate activists. All but two of the 20 shareholder proposals for the two companies garnered less than 25% of investors’ vote, according to preliminary results, with some performing much worse than similar proposals put forward last year.

Zero Carbon zealots attacking ExxonMobil, here seen without their shareholder disguises.

Among the most controversial proposals were those that would have had the companies adopt targets for reducing emissions including those from third-party consumption of their products, such as when drivers burn gasoline in their cars, also known as Scope 3 emissions. Those received only 11% and 10% of the vote among Exxon and Chevron investors, respectively, compared with 27% and 33% for similar proposals last year.

In recent weeks, similar climate proposals failed to win over most shareholders
at annual meetings of British oil and gas giants BP and Shell in London.

Investment strategies linked to ESG, short for environmental, social and corporate-governance issues, had gained momentum in recent years, particularly following the onset of the pandemic in 2020. Investors pressed oil companies to show how they were working to reduce their climate footprint, set long-term environmental goals and curtail the flaring of unwanted natural gas.

In 2021, investment firm Engine No. 1 prevailed in a historic proxy battle against Exxon, winning three board seats at the company’s annual meeting with the backing of investment firms, Vanguard, State Street and BlackRock. The firm argued that Exxon needed to form a better strategy to prepare for the world’s anticipated energy transition.

After the defeat, Exxon adopted a so-called net zero commitment — a goal to reduce
or offset greenhouse-gas emissions from its operations to zero by 2050.

But Wednesday’s votes demonstrated how some shareholders have backed off pushing major oil companies to embrace certain climate goals. Investors said many voices pushing ESG measures have been drowned out following Russia’s war in Ukraine, which caused oil and gas prices to skyrocket as global supplies were crimped.

Mark van Baal, founder of environmental activist group Follow This, said shareholders missed an opportunity at the annual votes. Investors know that avoiding climate disaster will require global emissions to fall by almost half by 2030, he said, but many are focused on short-term profits. [Note: van Baal is wrong about disaster–see Even 3°C Warming Can’t Stop World Prosperity. ]

The industry and its allies have said some countries, particularly in Europe, were too quick to move away from fossil fuels toward clean energy sources such as solar and wind. A movement against climate activism has gained political traction in the U.S., particularly among Republican voters. Entrepreneur Vivek Ramaswamy, a candidate for the Republican presidential nomination, has made anti-ESG policies a central plank of his campaign.

The pushback against ESG measures has also hit investment firms such as BlackRock,
which have faced potential boycotts in Texas and other red states.

Republican officials in Florida, Texas, Louisiana and South Carolina pulled more than $4 billion in pension and investment funds from BlackRock starting last year. BlackRock brought in $230 billion from U.S. clients in 2022.

It wasn’t immediately clear how BlackRock, State Street and Vanguard voted at the meetings this week.  State Street and BlackRock declined to comment. Vanguard didn’t immediately respond to a request for comment.

Investments in fossil fuels pushed many oil companies to record profits last year, which lured back some investors who had fled after years of meager returns from the industry. Exxon Chief Executive Darren Woods said Wednesday the company had benefited from investing in fossil fuels when others pulled back.

Even in Europe, energy executives have shown a willingness to alienate clean-energy investors to tailor strategies to the thirst for fossil fuels. BP and Shell’s record full-year 2022 profits and hefty returns to investors have attracted new investors, and won back some who were dubious of their energy-transition strategies, executives said.

Shell and BP executives have said their strategies are consistent with targets to lower global emissions, while also helping supply the oil and gas still demanded in coming years globally. Exxon and Chevron have said they support the emissions targets set by the Paris climate accords and reducing emissions from their operations.

But Woods and other industry executives have argued some climate-related proposals would backfire or leave the economy worse off. Woods said several proposals rejected Wednesday would have required the company to assume the world will cut carbon emissions at a much faster pace than observers have projected.

“Some [would] go so far as to force us to decrease oil and gas development,” he said. “This would do nothing to reduce global demand.”

What is actually beyond debate is not that we are in a climate crisis
but that if we don’t stop destroying our conventional energy economy,
we are going to be in a civilizational crisis.

No CNN, Gulf Stream is Not Collapsing

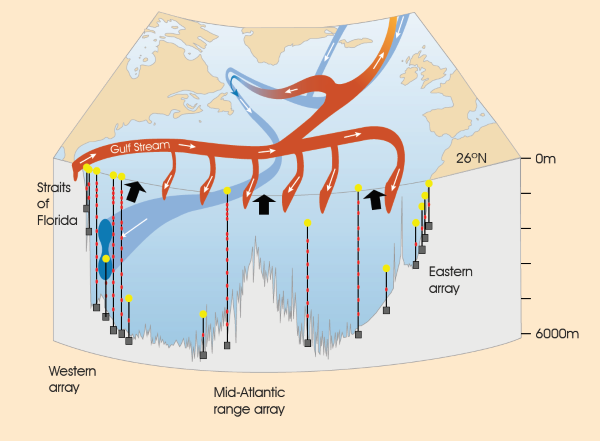
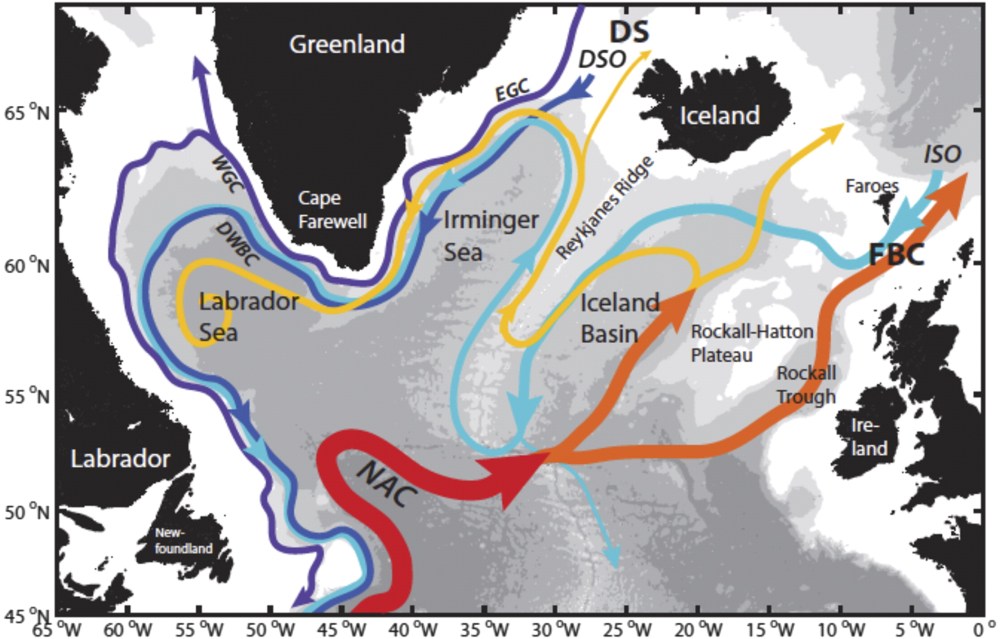
Atlantic Meridional Overturning Circulation (AMOC). Red colours indicate warm, shallow currents and blue colours indicate cold, deep return flows. Modified from Church, 2007, A change in circulation? Science, 317(5840), 908–909. doi:10.1126/science.1147796


Leave it to CNN to jump the shark with scary claims Excerpts in italics with my bolds.

A crucial system of ocean currents is heading for a collapse that ‘would affect every person on the planet’

A new study published Tuesday in the journal Nature, found that the Atlantic Meridional Overturning Current – of which the Gulf Stream is a part – could collapse around the middle of the century, or even as early as 2025.

Scientists uninvolved with this study told CNN the exact tipping point for the critical system is uncertain, and that measurements of the currents have so far showed little trend or change. But they agreed these results are alarming and provide new evidence that the tipping point could occur sooner than previously thought.

Yikes!  Shades of Day After Tomorrow

Scientists Admonish Against Going Over the Top

Fortunately knowledgable experts in the area have weighed with context and perspective at Science Media Centre Expert reaction to paper warning of a collapse of the Atlantic meridional overturning circulation. 

Of course some commented as cheerleaders, but many cautioned against exaggeration and speculation. The RAPID programme (see diagram at top) measures daily flows of water at several depths between the North Atlantic and Arctic oceans, and its scientific coordinator, Prof Meric Srokosz, National Oceanography Centre, University of Southampton, said:

While the possible collapse of the AMOC with significant climatic impacts is a concern, providing a warning of its collapse is problematic as a long set of observations is required. In this paper the warning depends on using proxy AMOC data (here based on sea surface temperature, SST) as direct continuous AMOC measurements are only available since 2004. The warning comes from applying statistical techniques to a long time series (over a century) of proxy AMOC data, but the warning is only as good as the proxy data are in representing the true AMOC. So, this warning needs to be treated with caution as there is no consensus as to which proxies can accurately capture the behaviour of the AMOC over the long term.”

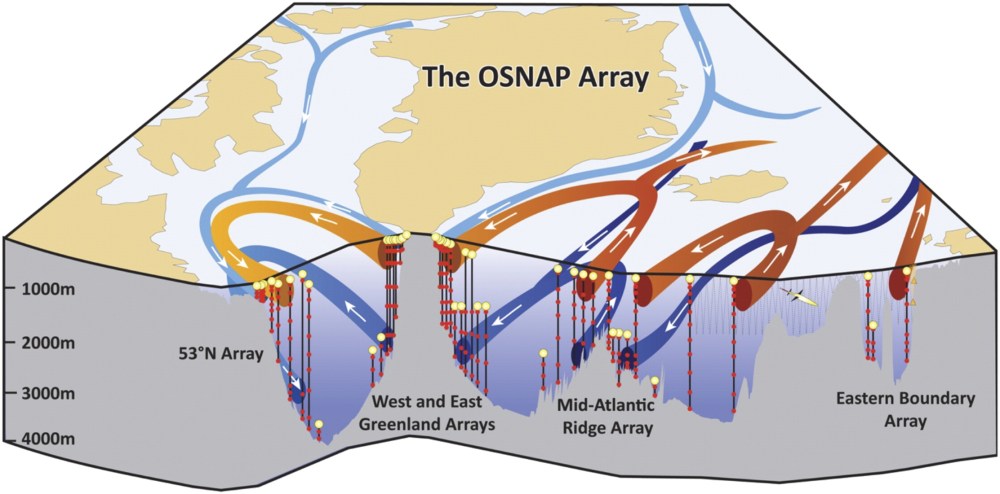
Prof Penny Holliday, Head of Marine Physics and Ocean Circulation at the National Oceanography Centre, and Principal Investigator for OSNAP, an international programme researching AMOC processes, variability and impacts, said:

“Confidence in the validity of the conclusions are undermined by our knowledge that sea surface temperature of the North Atlantic subpolar gyre is not a clear indicator of the state of the AMOC, and that there is no evidence that the AMOC has dramatically weakened in the past 50-75 years. A collapse of the AMOC would profoundly impact every person on Earth but this study overstates the certainly in the likelihood of it taking place within the next few years.”

Does the press release accurately reflect the science?

“On the whole it does – the title of the paper is more sensational than the actual statements within it, and the press release does make that clear. However there are two statements that are not accurate as follows:

‘The strength of the AMOC has only been monitored continuously since 2004 and these observations have shown AMOC to be weakening’

“This is stated in the paper but it is not correct information. The observations since 2004 show that the AMOC goes through fluctuations of being in a stronger or weaker state that last for about 10 years. The observations since 2004 show the subtropical AMOC getting slower from 2004 to 2012, but gradually becoming stronger since then. The only data from AMOC observations shown in the paper are from 5 sparse ship surveys and are used out of context – the authors use them to argue for a severe decline in the AMOC, but that interpretation has long been discredited in the scientific literature (including in the reference they cite for it).

‘The authors found early warning signals of a critical transition of the AMOC system and suggest that it could shut down or collapse as early as 2025 and no later than 2095.’

“This is not quite as the paper states. In the paper the time period of potential collapse depends on choices they have made in how they construct the time series of sea surface temperature which they use as evidence for change. They present three versions of the temperature records, and the three resulting model predictions suggests a collapse is ‘likely’ at any time from 2024 to 2180. The 2025-2095 is the period of time their statistical model predicts that a full or partial collapse is most likely.

How does this work fit with the existing evidence?

“The conclusions are different to the consensus derived from climate projections as described by the IPCC AR6 assessment. The averaged AMOC projections from climate models under all the IPCC emissions scenarios all show an AMOC decline, but not a collapse (a “high confidence” conclusion). Some individual climate model runs do show a future collapse in the AMOC, so the possibility cannot be entirely ruled out.

Are there any important limitations to be aware of?

“There are some questionable assertions and decisions in the methods as follows. The authors state confidently that the sea surface temperature (SST) of the North Atlantic subpolar gyre can be used as a proxy for the strength of the AMOC. The validity of an SST proxy for AMOC strength is a matter of ongoing scientific debate however, because it is based on model behaviour and is not proven using real-world data.

There is solid evidence that there is no such clear relationship,
especially on timescales of less than 30 years.

“I believe the authors have overstated the pattern of subpolar North Atlantic SST change by subtracting two (and three) times the global mean surface temperature trend. This is not the usual approach for highlighting North Atlantic regional temperature trend (instead it is more usual to subtract just 1 x the global trend). The choice means that some of the SST data they use in the statistical model has exaggerated decline since the 1970s when the global SST began to sharply rise. In the version of the statistical model for which the global mean SST trend is removed, the predicted likely time of a partial or complete collapse becomes later and over a wider window of time.

“As mentioned above, the actual observations of AMOC since 2004 have long-since discredited the evidence that the authors are using to validate their modified SST temperature record. The 5 data points they show in the paper were collected several years apart by ship surveys, and it is well known and well established that they give a highly misleading impression of AMOC decline. All the observational evidence we have shows no evidence of dramatic decline in the AMOC over the past 50-75 years.

How uncertain are the uncertainties?

“The authors say that the model’s 95% confidence interval is 2025-2095. This is a measure of statistical uncertainty and they state in the discussion that they cannot rule out slowing rather than a collapse, as well as listing other reservations and caveats. Because of the limitations of their use of modified SST as a proxy for AMOC, the uncertainty in the stated message in the title and abstract is high.

What are the implications in the real world?

“The potential for the AMOC system of currents to collapse under global warming is a high impact, low likelihood scenario, and policymakers and planners do need to be aware of it. NOC and international partners are investing in ongoing observations of the AMOC in order to determine how closely changes in AMOC contribute to changes in SST and consequential climate and social and economic impacts on people. The strength of the out-of-sight ocean currents of the AMOC has surprisingly direct impacts on food, water and energy security, infrastructure risk, biodiversity, and human health. The paper demonstrates that decades of observations are needed to be able to detect a major tipping point in the AMOC, and the authors call for continued measurements of these great Atlantic ocean currents for long enough to do so.

Prof. Dr. Jochem Marotzke, Director of the Department Ocean in the Earth System, Max-Planck-Institute for Meteorology, Hamburg, Germany, said:

“The work provides no reason to change the assessment of the 6th IPCC Assessment Report: ‘There is medium confidence that there will be no abrupt collapse before 2100′. The statement so confidently made in this paper that collapse will occur in the 21st century has feet of clay. The maths are solid, but the starting point is highly dubious: the essential equation – marked with (1) in the paper – relies on the simplified models representing bifurcation – i.e. AMOC collapse – also being correct. But the more comprehensive models do not show this very bifurcation. In this respect, the paper does not live up to its self-imposed claim: ‘The strategy is to infer the evolution of the AMOC solely on observed changes in mean, variance and autocorrelation.’

The interpretation relies to an enormous extent on the authors’ theoretical
understanding being correct, and there are huge doubts about that.

“It must be added that there is considerable doubt as to whether surface temperature measurements are a valid proxy for the AMOC. Again, the paper addresses these uncertainties inadequately.

“When reporting about this study, it is important to include the key aspects in which this paper fails to include the scientific uncertainties.

Prof Niklas Boers, Professor of Earth System Modelling at the Technical University of Munich, said:

“I do not agree with the outcome of this study. While the qualitative statement that the AMOC has been losing stability in the course of the last century is true and supported by the data, uncertainties are too high to reliably estimate a time of tipping. In particular, the uncertainties in the heavily oversimplified model assumptions by the authors are too high. Moreover, the uncertainties in the underlying datasets are huge and would make the extrapolation carried out by the authors far too uncertain to actually report a year or even a decade for the AMOC tipping.”

Background Post 2019 AMOC Update: Oceans Moderate Climate Threat

Fig. 1. Schematic of the major warm (red to yellow) and cold (blue to purple) water pathways in the NASPG (North Atlantic subpolar gyre ) credit: H. Furey, Woods Hole Oceanographic Institution): Denmark Strait (DS), Faroe Bank Channel (FBC), East and West Greenland Currents (EGC and WGC, respectively), NAC, DSO, and ISO.

Antarctic Sea Ice Varies, It’s Complicated

Antarctic sea ice concentration on June 27, 2023, with white representing solid ice and dark blue representing open ocean. The median ice edge for 1981–2010 is drawn in orange. (Credit: Map by NOAA Climate.gov, based on data from the National Snow and Ice Data Center)

One of the more measured current reports of Antarctic sea ice is at Discover Antarctic Sea Ice Reaches a “Record-Smashing Low”.  Excerpts in italics with my bolds.

The sea ice extent is nearly a million square miles
below the long-term average for late June.

Some scientists believe that what we’ve seen since 2022 may be signaling a significant and potentially long-lasting change. As Ted Maksym, a climate scientist and polar oceanographer at the Woods Hole Oceanographic Institution, put it in a recent story in Wired:

“Now there’s this question about: Have we got into a regime shift? A few of us are sort of speculating that that may be true, where the variability in Antarctic sea ice has changed and we might see these low sea ice extents for some time.”

But Maksym also says he and his colleagues are “watching with bated breath” to see if things will return to normal — and they could. Scientists just don’t know.

That’s because the Antarctic is a very different environment than the Arctic — in a way that complicates drawing firm conclusions. The latter consists of an ocean surrounded by land, whereas the former is a giant landmass surrounded by oceans.

Sea ice around Antarctica is affected by a host of complex factors,
including shifts in ocean currents and sea and air temperatures.

Given how remote, forbidding and large Antarctica is, observations of these factors have been relatively sparse. Moreover, the record of satellite observations of sea ice dates only to 1979, making it difficult to separate out a human-caused signal from natural variability. And the sparseness of data, and the complexity of myriad factors, have made modeling of Antarctic sea ice very challenging.

Bottom line: Scientists haven’t seen anything like what’s been happening to Antarctic sea ice in the past two years. But it will take time to know whether a dramatic shift truly has occurred, and more research to tease out the role of anthropogenic climate change in what’s happening.

Background Annual Cycle of Antarctic Sea Ice

Firstly, the annual minimum average is ~2.5 M km2 vs. an average maximum of ~17.5 M km2.  So the sea ice extent each year nearly disappears.  Secondly, since 2010, some years were well above the 1981-2010 average, and obviously there were likely many prior years below average.  Which suggests this may be a return to the mean, or not, as the experts say.

Previously, Antarctic Sea Ice Grew Steadily

Robot Sub Finds Surprisingly Thick Antarctic Sea Ice Nov. 24, 2014

Antarctica’s ice paradox has yet another puzzling layer. Not only is the amount of sea ice increasing each year, but an underwater robot now shows the ice is also much thicker than was previously thought, a new study reports.

The discovery adds to the ongoing mystery of Antarctica’s expanding sea ice. According to climate models, the region’s sea ice should be shrinking each year because of global warming. Instead, satellite observations show the ice is expanding, and the continent’s sea ice has set new records for the past three winters. At the same time, Antarctica’s ice sheet (the glacial ice on land) is melting and retreating.

Measuring sea ice thickness is a crucial step in understanding what’s driving the growth of sea ice, said study co-author Ted Maksym, an oceanographer at the Woods Hole Oceanographic Institution in Massachusetts. Climate scientists need to know if the sea ice expansion also includes underwater thickening.

“If we don’t know how much ice is there is, we can’t validate the models we use to understand the global climate,” Maksym told Live Science. “It looks like there are significant areas of thick ice that are probably not accounted for.”

The Antarctic sunlight illuminates the surface of the sea ice, intensifying the effect of the fracture lines, Oct. 2003. (NSIDC, University of Colorado)

Theory:  Climate Change Increases Antarctic Sea Ice Extent

From AP Oct. 10, 2012 Increase in Antarctic ice may be sign of climate change.  Excerpts in italics with my bolds.

While the Arctic is open ocean encircled by land, the Antarctic — about 1.5 times the size of the U.S. — is land circled by ocean, leaving more room for sea ice to spread. That geography makes a dramatic difference in the two polar climates.

The Arctic ice responds more directly to warmth. In the Antarctic, the main driver is wind, Maksym and other scientists say. Changes in the strength and motion of winds are now pushing the ice farther north, extending its reach.

Those changes in wind are tied in a complicated way to climate change from greenhouse gases, Maksym and Scambos say. Climate change has created essentially a wall of wind that keeps cool weather bottled up in Antarctica, NASA’s Abdalati says.

And the wind works in combination with the ozone hole, the huge gap in Earth’s protective ozone layer that usually appears over the South Pole. It’s bigger than North America.

It’s caused by man-made pollutants chlorine and bromine, which are different from the fossil fuel emissions that cause global warming. The hole makes Antarctica even cooler this time of year because the ozone layer usually absorbs solar radiation, working like a blanket to keep the Earth warm.

And that cooling effect makes the winds near the ground stronger and steadier,
pushing the ice outward, Scambos says.

University of Colorado researcher Katherine Leonard, who is on board the ship with Maksym, says in an email that the Antarctic sea ice is also getting snowier because climate change has allowed the air to carry more moisture.

Does Sea Ice Growth or Decline Negate or Confirm Climate Change?  No.

From LA Times August 29, 2014 Does Antarctic sea ice growth negate climate change? Scientists say no.  Excerpts in italics with my bolds.

This year, Antarctic sea ice has expanded its frigid reach with unprecedented speed, setting records in June and July. By the time spring punctures the long Antarctic night, 2014 stands a decent chance of topping 2012 and 2013, which each broke records of maximum total ice extent.

In fact, since scientists started making satellite observations in the late 1970s, they have watched winter sea ice around Antarctica swell slowly but indisputably, despite predictions that it should shrink.

This poses a puzzle that climate scientists struggle to explain:
How can sea ice grow in a warming world?

Climate skeptics have pounced on this apparent discrepancy, citing it as proof that climate change isn’t real, or at least that scientists don’t completely understand it. But those who study Antarctic sea ice say their curious observations shouldn’t shake anyone’s confidence. Dramatic changes in temperature, sea level and extreme weather around the world are proof enough the planet is warming, they say; the only question is how these changes affect the Antarctic as they ripple through the climate system.

“Climate is a complicated thing,” said Ted Maksym, an oceanographer at the Woods Hole Oceanographic Institute in Massachusetts. “Understanding how these kinds of changes play out in different regions is tricky business.”

The westerly winds blow fierce and constant around Antarctica, isolating the continent in a kind of permanent polar vortex. Scientists think they exert the most direct control over the state of Antarctic sea ice.

Ice requires cold temperatures to form, and winds help it grow by blowing it around the polar ocean. When the ice moves, new water is exposed to the chilly air, creating an opportunity to make more ice.

But it’s not quite as simple as more wind, more ice.

“It makes no sense to talk about a circumpolar average,” Stammerjohn said. “There’s so much regional variability.”

The Ross Sea, which faces New Zealand, has seen a dramatic increase in peak ice extent and 80 more days of ice cover since 1979, when satellites began tracking changes. But along the Antarctic Peninsula, which stretches toward the tip of South America, the ice-covered season in the Bellingshausen Sea is three months shorter than it was 35 years ago.

Scientists say sea ice and continental ice are probably responding to the same forces — namely, changes in ocean circulation and winds. However, they also influence each other. Sea ice helps buffer ice shelves, the floating tongues of glacial ice that dam the ice sheets and keep them from spilling irreversibly into the sea. It also keeps warm ocean waters trapped beneath a frozen lid, insulating the ice sheet from their destructive heat.

In the long run, however, scientists expect Antarctic sea ice to decline everywhere.
That it hasn’t done so yet suggests there’s still much to learn about the region
.

Antarctic Sea Ice Grows to All-Time Record High: NSIDC October 09, 2014

Antarctica Heat Hype

Jennifer Marohasy throws cold water on heat hype in her Spectator Australia article Warming in Antarctica? Only using ‘creative’ statistics.  Excerpts in italics with my bolds and added images.

Much has been written in the tabloids, and repeated by the fashionable, about it being very hot through June – even in Antarctica. Really, I wondered. Is Antarctica melting?

The Australian Bureau of Meteorology has measured air temperatures at the Mawson weather station in Antarctica since early 1954 – this is one of the longest continuous surface temperature records for that part of the world. The Russians did not establish the more famous and isolated Vostok weather station until 1957. The satellite temperature record doesn’t begin until 1979.

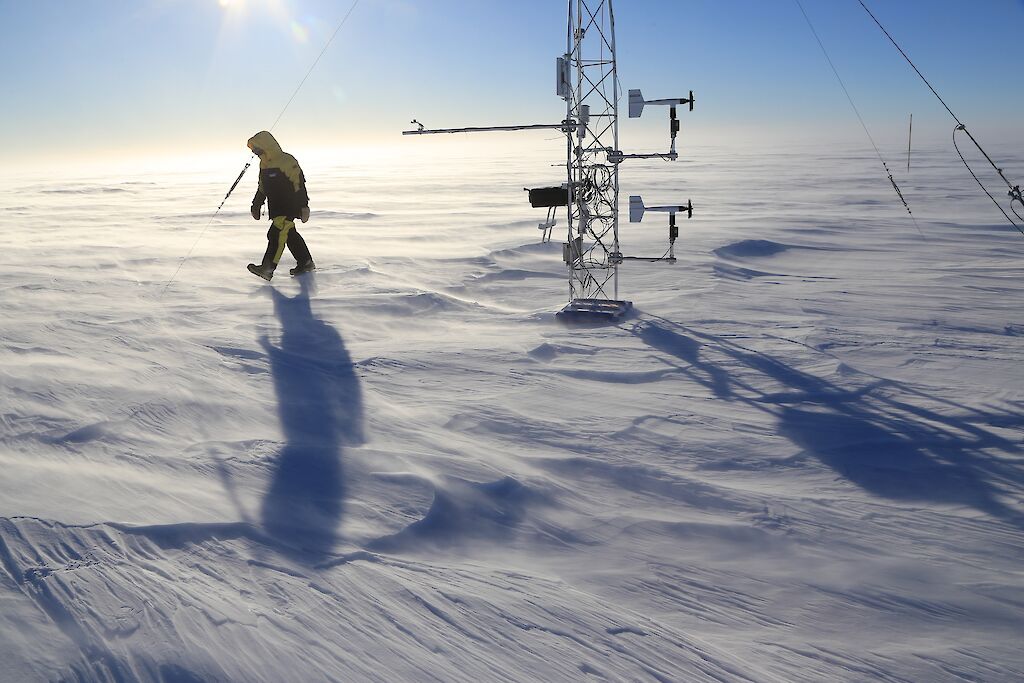
Automatic weather station (AWS) near Mawson. Photo: John Burgess

The Bureau makes very few adjustments to the temperatures as measured at Mawson that oscillate within a band of some few degrees – mostly below freezing. These same temperatures show no statistically significant long-term warming trend, at least not since 1954. There are longer proxy temperature series, based on ice core records, and they show an overall cooling trend, considering the last 1,900 years. Here, again, I am referring to data from published studies, for example, the temperatures of East and West Antarctica were reconstructed by a team led by Barbara Stenni including scientists from the Australian Antarctic Division, British Antarctic Survey, and Russian Antarctic Research Institute. It is only remodelled proxy series that show warming over this same period.

Last month (June 2023), Antarctica was reported as ‘hot’ in various publications including Vox.com. It’s even hot in Antarctica, where it’s winter.  Yet the average maximum temperature for Mawson was minus 12.6 degrees Celsius, which is not quite as cold as the long-term June average for all years since 1954 which is minus 13.5 C. When the June maximum temperatures for Mawson are ranked highest to lowest, June 2023 comes in as the 29th hottest, and 42nd coldest – suggesting temperatures in Antarctica were not particularly newsworthy and rather cold.

Yet the tabloids, and fashionable, are claiming June 2023 as hot – even in Antarctica. It is all nonsense.

Some of these claims have their origin in the University of Maine’s Climate Reanalyzer, a tool that uses satellite data and computer simulations. So, they represent a remodelled average. Indeed, there is not a single place where anyone, can measure the average temperature of the Earth – or Antarctica. Rather, when it is announced that it is the hottest it has ever been, reference is made to a statistic.

This average temperature is necessarily a number
that has been derived from other numbers.

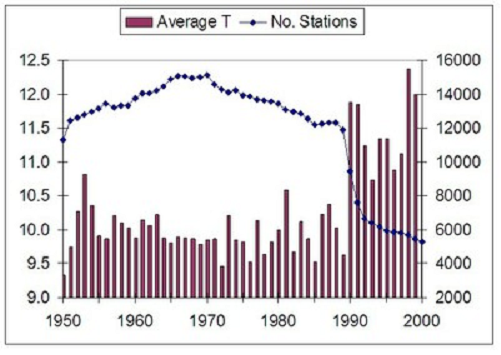
There will perhaps have been some measuring done here and there, and then some adjusting, and then some adding up and some adjusting again. This is how it is with the calculation of regional and global average temperatures – whether from satellites, tree rings, ice cores, or thermometers. To be sure, every year we are told it is getting hotter, and back in the late 1980s, this was achieved for the globally averaged thermometer record by dropping out some of the colder weather stations. This had the effect of increasing the overall average global temperature, at a time when temperatures at many individual sites were dipping somewhat.

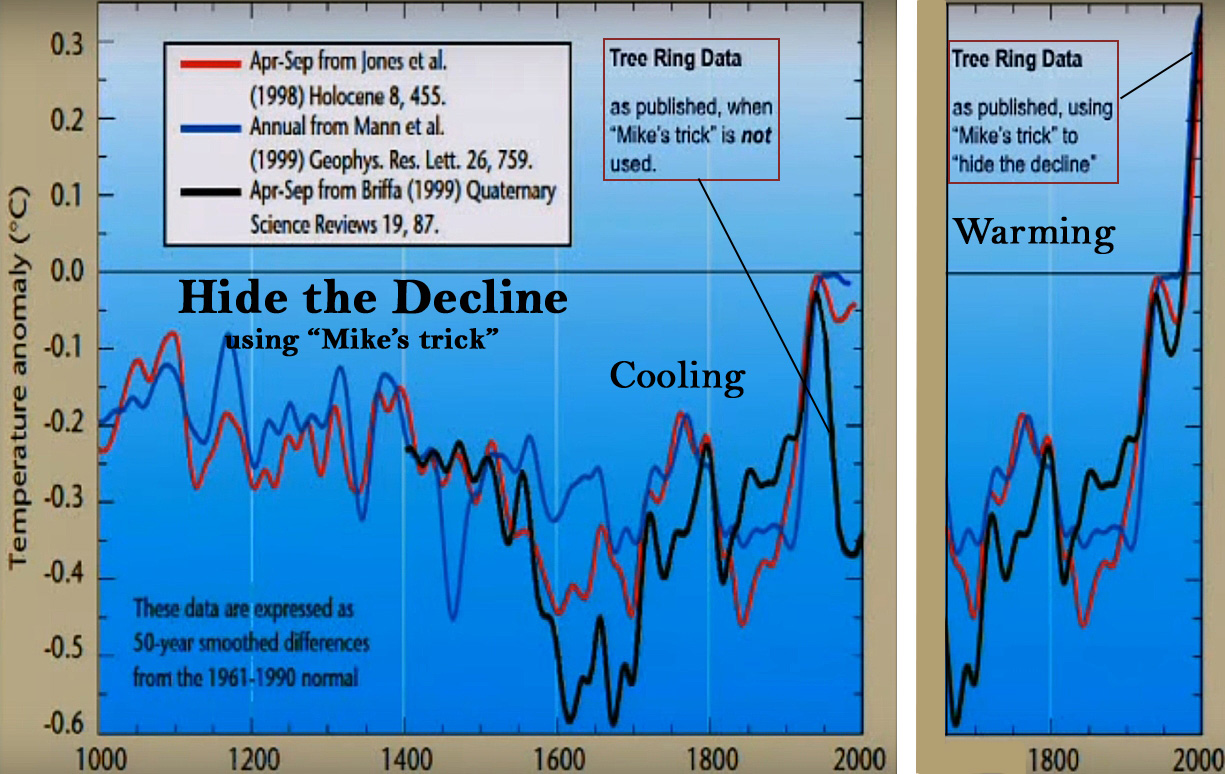
Those who have followed the politics of measuring temperatures may also remember the infamous line in the Climategate emails, whereby the globally averaged temperatures based on tree rings, which also show a decline after 1980, are ‘corrected’ by substituting the globally averaged temperature from thermometer records – never mind that the dip in that record had already been ‘corrected’ by removing data from a great many high latitude Canadian and Russian weather stations.

Drawing from this sordid history of calculating global and regional temperatures, I can think of a large number of ways that the University of Maine’s Climate Reanalyzer could possibly generate a higher-than-average temperature for Antarctica and especially the Earth. Indeed, the larger the geographic area covered, the more opportunity for creative accounting, for which corporates using similar techniques would go to jail, while climate scientists are more usually promoted.

The solution is to perhaps give up on believing the nonsense news headlines, especially when there is no reference to a specific weather station, like Mawson. Or do away with a random selection of weather stations and focus instead on a simple index based on a good sample of well-sited weather stations with long histories, like Mawson.

Such a concept could be based on the Dow Jones Averages or the S&P 500. No one ever tries establishing an impossible-to-define ‘average stock price’ — including many stocks of doubtful provenance — and nobody cares. Rather the solution is to have a pre-selected index of certain representative stocks, that are then followed over a long-time span. So why not have an index of agreed weather stations?

The only problem is, the tabloids and the fashionable, might then have nothing to talk about – should they limit reporting to the same weather stations and with temperatures reliably measured, which will require some modification to current methods and of course, no subsequent adjusting.

There may be no catastrophe to report at least not when it comes to weather as a measure of climate, for which the lack of reliable measures, and the great number of potentially creative solutions, are currently being exploited over and over to justify rather large expenditures on all manner of things.


Hooks for Fake Ballots: Names, Addresses


Jay Valentine explains how to block the fraudulent ballots intended for the 2024 election in his American Thinker article The Achilles Heel of Mail-In Ballot Fraud.  Excerpts in italics with my bolds and added images.

The difference between the Republican ballot operation and that of the leftists is that the leftists manufacture ballots, whereas Republicans only collect them.

Elections are for big stakes. Pretty much everything is political, and thus, who controls the Legislature gets the goodies.

If you are a government pro, you live or die according to whether your team is in power. You do what the pros do — you make sure you control your food source.

The laughable RNC “out-ballot-harvest the left” plan is one any sentient adult knows cannot work. That of course leaves out Republican state operatives, for whom hope exceeds common sense.

Leftists learned early that running out of ballots to cast on election day is like running out of beer on July 4. They took that lesson and improvised in ingenious ways.

Ballot-manufacturing appears pretty easy at first but has lots of little complexities. Mastering those complexities gives our leftist pals unlimited numbers of ballots to handle any surging MAGA candidate.

Manufacturing ballots requires two ingredients: an address and a person.

On the person side, leftists do all the obvious stuff: register college kids in droves, do voter drives in homeless shelters where vagrants come in and out, build apps and pay anyone who will sign up a few dozen new voters (Wisconsin) with no regard to whether these are eligible voters.

With these and scores of other techniques, the inventory of names aggregates.

That burgeoning list is permanent — voter integrity teams in most states report they cannot get many of these people off voter rolls even when they prove that those people are long gone. Leftists control most of the voter commission apparatus, so that inventory remains safe.

Try to get those names off the voter list, and you will be attacked by leftist press, threatened by the Justice Department, or doxed on social media.

The other ingredient for ballot-manufacturing is the address.

Addresses and voters have fundamentally different characteristics.

Addresses can be misspelled in innumerable ways yet still be considered correct. Addresses do not move — they are a plot of dirt with a number. Addresses do not have lawyers, and they do not have 40 years of leftist court opinions to protect someone challenging their authenticity.

Addresses cannot be manufactured. Voters can.

Leftists can create all the voters they want from homeless shelter lists, but they face a constraint: every voter must tie to an address. It is this constraint — fixed addresses — that is the Achilles heel for mail-in voter fraud.

Addresses conveniently have the world’s singularly most accurate, current database maintained in every county in America — the real estate property tax record. These records are consulted daily by real estate agents doing comps. Tax authorities review them monthly, ensuring they squeeze every dollar from the citizen for any improvement.

Addresses, dear reader, are the key to stopping ballot-manufacturing.

Addresses have not been analyzed at scale in granular detail — down to the square footage, the number of bedrooms, baths, year built — because the tools to do so were not there. They are now.

The Fractal team was asked by some state legislatures to compare voter rolls with real estate tax rolls. They couldn’t do it themselves — they did not have the compute power — in a major state. That is why it has never been done before.

Two adjacent counties may report similar real estate data in different fields. Each county may use different nomenclature for the same record. Records are stored in relational databases with the address field broken into multiple segments — almost impossible to easily resurrect in real time with traditional tech.

These systems were built to be accessed one file at a time, not comparing the entire database with another.   Comparing detailed property tax records — think 120 columns of info — against voter files lights up where a ballot will be mailed but not meet an eligible voter.

This week, the Fractal team ran a test. We used current relational SQL technology, of which we are masters, and Fractal to ingest the property tax roll for a major county. The Fractal system was able to finish in hours — with a real-time system giving answers in seconds. After several days, the SQL team reported the originating data from the county — in a SQL relational file — was so complicated that it would take them several weeks to prepare for real-time retrieval.

We were also able to project response times. The property tax records with Fractal were instantaneous. With SQL, complete database comparisons would take days, perhaps a full week.

Leftists continue to pad voter rolls with vagrants and other transients, but
they must tie them to an address. That is a pretty hard card to hide.

When voters are added to large apartment buildings, leftists cannot add the apartment number, or the legit resident will probably get that ballot. The trick is to mail the ballot to the main address, where it collects, and the Postal Service retrieves it for the bad guys.


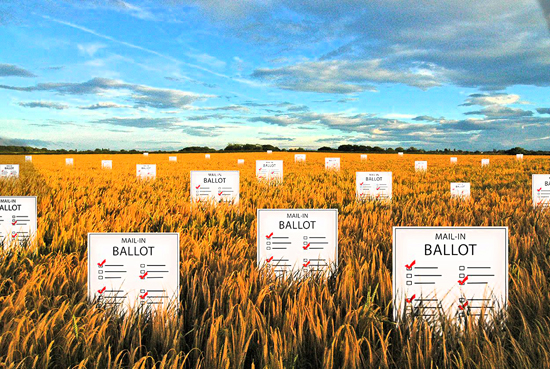
Another strategy is to create an address. 126 Chestnut Street and 130 Chestnut street are contiguous properties. Our leftists create 128 Chestnut, which does not exist, and will generate a floating ballot.

Often, college dorms are used to send thousands of ballots to students who left years ago. We recounted many stories about 106-year-old voters in frat houses still casting a ballot.

Then there are the construction sites, where leftists have 224 registered voters in an apartment building — under construction. No roof, no walls, no electricity, but 224 solid votes.

In Florida, our leftist pals created an entire fake street — then moved real voters there — and when ballots were sent out, they accumulated. Innovation! Never ceases to impress!

These and hundreds of other schemes fail in a single click when the real-time real estate property rolls come into play. With that one click, one can see every address that does not exist in the property roll — yet has voters.

Another click shows every apartment building, compared with every voter record, kicking out the list, by street, of every person without that unit number — thus ineligible.

One more click, and every voter registered at a location with more than four people per 500 square feet of living space — thus challenging the county health regs — pops out.

What we have here is something of true beauty: one government database showing the nonsense in another government database. When leftists say “show me the fraud,” one needs only to do one click — “voters who voted in 2022, who the government tax records note are ineligible.”

In 2024, the leftists are pulling out all the stops. Hundreds of thousands of American voters will wake up in the 90 days before the election with strangers living in their homes, apartment buildings, the local 7-11, or the vacant field. Those are the Trump anti-votes.

The difference between 2020 and 2024 is that they will become visible months before the election. They will be challenged the week they register. Press conferences will be held on that construction site lawn, next to the cement mixer, noting that this address houses “224 real voters.”

Dare the Justice Department to intervene — the real estate tax rolls are challenging
an address, not a person. Meet the Undeliverable Ballot Database™.

Now that Fractal makes every address in any county visible, across every of those 120 or more columns, and compares them with voter rolls in seconds, from a phone, our 2024 pal Achilles may find us grabbing him by the heel — or maybe somewhere where it hurts even more!


How Climate Models Get Clouds Wrong

Why Did IMF Disinvite Nobel Laureate?

CO2 Coalition explains.  Nobel Laureate (Physics 2022) Dr. John Clauser was to present a seminar on climate models to the IMF on Thursday and now his talk has been summarily cancelled. According to an email he received last evening, the Director of the Independent Evaluation Office of the International Monetary Fund, Pablo Moreno, had read the flyer for John’s July 25 zoom talk and summarily and immediately canceled the talk. Technically, it was “postponed.”

Dr. Clauser had previously criticized the awarding of the 2021 Nobel Prize for work in the development of computer models predicting global warming and told President Biden that he disagreed with his climate policies. Dr. Clauser has developed a climate model that adds a new significant dominant process to existing models. The process involves the visible light reflected by cumulus clouds that cover, on average, half of the Earth. Existing models greatly underestimate this cloud feedback, which provides a very powerful, dominant thermostatic control of the Earth’s temperature.

More recently, he addressed the Korea Quantum Conference where he stated, “I don’t believe there is a climate crisis” and expressed his belief that “key processes are exaggerated and misunderstood by approximately 200 times.” Dr. Clauser, who is recognized as a climate change skeptic, also became a member of the board of directors of the CO2 Coalition last month, an organization that argues that carbon dioxide emissions are beneficial to life on Earth.

What Difference Clouds Make in Climate Models

Obviously the Clauser presentation is not accessible and I don’t find a link to a publication concerning his treatment of clouds in climate models.  But we can see how the models react to clouds by means of an important paper The Mechanisms of Cloudiness Evolution Responsible for Equilibrium Climate Sensitivity in Climate Model INM-CM4-8 by Evgeny Volodin AGU 03/12/2021.  Excerpts in italics with my bolds.

Abstract

Current climate models demonstrate large discrepancy in equilibrium climate sensitivity (ECS). The effects of cloudiness parameterization changes on the ECS of the INM-CM4-8 climate model were investigated. This model shows the lowest ECS among CMIP6 models. Reasonable changes in the parameterization of the degree of cloudiness yielded ECS variability of 1.8–4.1 K in INM-CM4-8, which was more than half of the interval for the CMIP6 models.

The three principal mechanisms responsible for the increased ECS were increased cloudiness dissipation in warmer climates due to the increased water vapor deficit in the non-cloud fraction of a cell, decreased cloudiness generation in the atmospheric boundary layer in warm climates, and the instantaneous cloud response to CO2 increases due to stratification changes.

Introduction

In CMIP6 the lowest and highest ECS (Equilibrium Climate Sensitivity) values are 1.8 and 5.6 K, respectively (Zelinka et al., 2020). Climate response to some external forcing produces feedbacks. Positive feedback enhances the response to forcing, negative feedback weakens it. Analysis of climate feedback shows that cloud feedback is the principal reason for the broad range of ECS (Zelinka et al., 2020). Clouds (especially low clouds) are significantly reduced with global warming in models with high ECS, resulting in positive feedback. Models with low sensitivity show small cloudiness changes with global warming; some models feature an increase in low clouds in warmer climates, creating a negative feedback.

Clouds produce shortwave and longwave radiative effects. The shortwave cloud radiative effect (SW CRE) is generally negative, because cloudiness reflects solar radiation that would otherwise be absorbed by the climate system. The shortwave effect is usually strongest for low clouds that have high amounts of liquid water and high albedos. The longwave cloud radiative effect (LW CRE) is generally positive, because cloud tops are usually much colder than the surface of the Earth; thus, thermal radiation from the cloud top is much lower than that from the surface. Negative/positive CRE produces cooling/warming from clouds.

The goal of this study is that we turn off some mechanisms responsible for large-scale cloud evolution that lead to increase or decrease ECS, and ECS is changed by the factor of more than 2. The role of a chosen mechanism in decrease or increase of ECS can be clearly seen. At the same time, all model versions show preindustrial climate with systematic biases compared to that for the version used in CMIP6. A realistic way of estimating the impact of change in parameterization on cloud feedback by keeping the cloud mean state realistic in all model versions and running 4xCO2 experiments rather than uniform +4K experiments are used in this study.

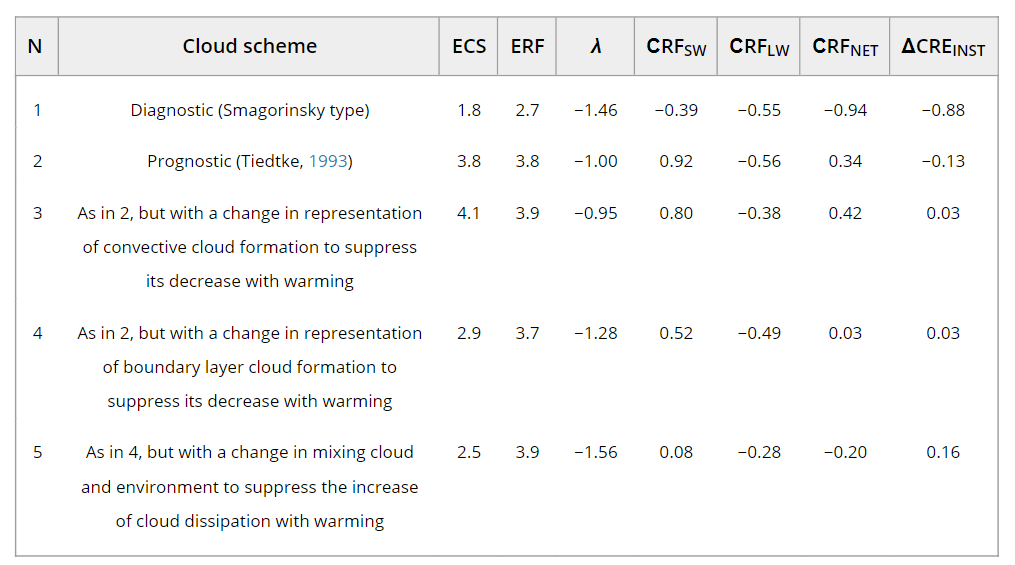
Table 1. Summary of Model Versions

Note. Equilibrium climate sensitivity ECS (K), effective radiation forcing ERF (W m−2), climate feedback parameter λ (W m−2 K−1), shortwave cloud radiative feedback СRFSW, longwave cloud radiative feedback СRFLW, net cloud radiative feedback СRFNET (W m−2 K−1) and instantaneous cloud radiative forcing change ΔCREINST (Wm−2).

The ECS estimation method is commonly used in CMIP5 and CMIP6 and was proposed by Gregory et al. (2004). The two model runs performed were the control run, in which all forcings were fixed at preindustrial levels, and the run where the concentration of CO2 in the atmosphere was four times higher than in the control run (4CO2 run). The initial state for both runs was the same and taken from a sufficiently long control run. Each run had a length of 150 years. Subsequently, the global mean difference of GMST and the heat balance at the top of atmosphere (THB) for 4CO2 and the control run were calculated for each model year.

Results of the sensitivity experiments performed with the five climate model versions.

Version 1 shows a very low ECS of 1.8 K due to a low negative climate feedback parameter value of −1.46 W m−2 K−1 (interval from −0.6 to −1.8 W m−2 K−1 for CMIP5 and CMIP6) and a low ERF value of 2.7 W m−2 (intervals of 2.6–4.4 and 2.7–4.3 W m−2 for CMIP5 and CMIP6, respectively, Zelinka et al., 2020). The low ECS was accompanied by mostly negative CRF in both the SW and LW spectral intervals (Figure 2 below).

Figure 2  Shortwave (top), longwave (middle) and net (bottom) cloud radiation feedback (Wm−2 K−1) for model version 1 (purple), 2 (yellow), 3 (red), 4(green), and 5 (blue). Data are multiplied by cosine of latitude.

The parameterization replacement scheme for cloudiness in version 2 dramatically changed all the parameters, and the ECS more than doubled to 3.8 K. ERF increased to 3.8 W m−2, without changes to the radiation code because ΔCREINST changed from −0.88 W m−2 to −0.13 W m−2. Additionally, the climate feedback parameter increased from −1.46 W m−2 K−1 to −1.0 W m−2 K−1. In version 2, global warming was associated with decreased cloudiness at all levels. The net cloud radiative feedback became positive. Version 2 yielded significantly increased net and SW cloud radiative feedbacks at all latitudes compared with version 1. Analysis of the sensitivity experiment results of versions 3–5 helps understand the mechanisms of these significant changes.

Version 3 features a suppressed mechanism of high tropical cloudiness due to decreased convective mass flux and higher ECS than version 2 (4.1 K); however, the change is not very pronounced. The LW CRF in the tropics increases in version 3 compared to version 2. The decrease in SW CRE is not very pronounced; therefore, increased net CRF increases ECS. This confirms our hypothesis that suppressing the decrease in tropical cloudiness should increase ECS and that the impact of this mechanism on ECS is noticeable but not very strong.

ECS is noticeably lower in version 4 (2.9 K) than in version 2. Thus, the mechanism of the decrease in boundary layer cloudiness due to decreased cloudiness generation by boundary layer turbulence is crucial for ECS. SW and LW CRF decreased in version 4 compared to version 2, primarily in the tropics and subtropics.

The mechanism of increased cloud dissipation under global warming conditions was suppressed in version 5, ECS was reduced to 2.5 K, and the climate feedback parameter decreased to −1.56 W m−2 K−1. Additionally, the SW CRF decreased in version 5 compared with version 4, primarily in the tropics and subtropics. In this version, all the mechanisms that decrease clouds with increased temperature, as raised in the previous section, are suppressed. The principal reason for the ECS difference between versions 1 and 5 is the instantaneous adjustment rather than the feedback (see Table 1). ΔCREINST values in versions 1 and 5 were −0.88 and 0.16 W m−2, respectively.

Conclusion

All model versions demonstrate similar model bias values for annual mean CRE, near-surface temperature, and precipitation; thus, determining a relation between present-day climate simulation model quality and ECS is difficult. Version 1 has slightly better quality (because it is a CMIP6 version) due to extensive tuning. The cloudiness scheme used in version 1 contained the dependence of low clouds on stratification. An increase in CO2 leads to more stable stratification and more low clouds and may be the primary cause of the low ECS. Bretherton (2015) and Geoffroy et al. (2017) obtained similar results. The decrease in clouds in warmer climates due to the mixing of cloud air with the unsaturated environment was also stated in a review by Gettelman and Sherwood (2016). Our results confirm those by Bony et al. (2006), Brient and Bony (2012), and others that a significant change in the response of low clouds to global warming leads to significant changes in cloud radiative feedback and ECS.

Comment

The main finding is: If warming increases low clouds, then SW (incoming solar radiation) is reduced, counteracting the warming, in effect a negative feedback.  That is consistent with Clauser’s position.