The Normal Ones


E.M. Smith provides an helpful critique of a recent incomplete theory of earth’s climate functioning in his Chiefio blog post So Close–Missing Convection and Homeostasis. Excerpts in italics with my bolds and added images. The reference is to a video by Sabine Hossenfelder you can view below in the post.
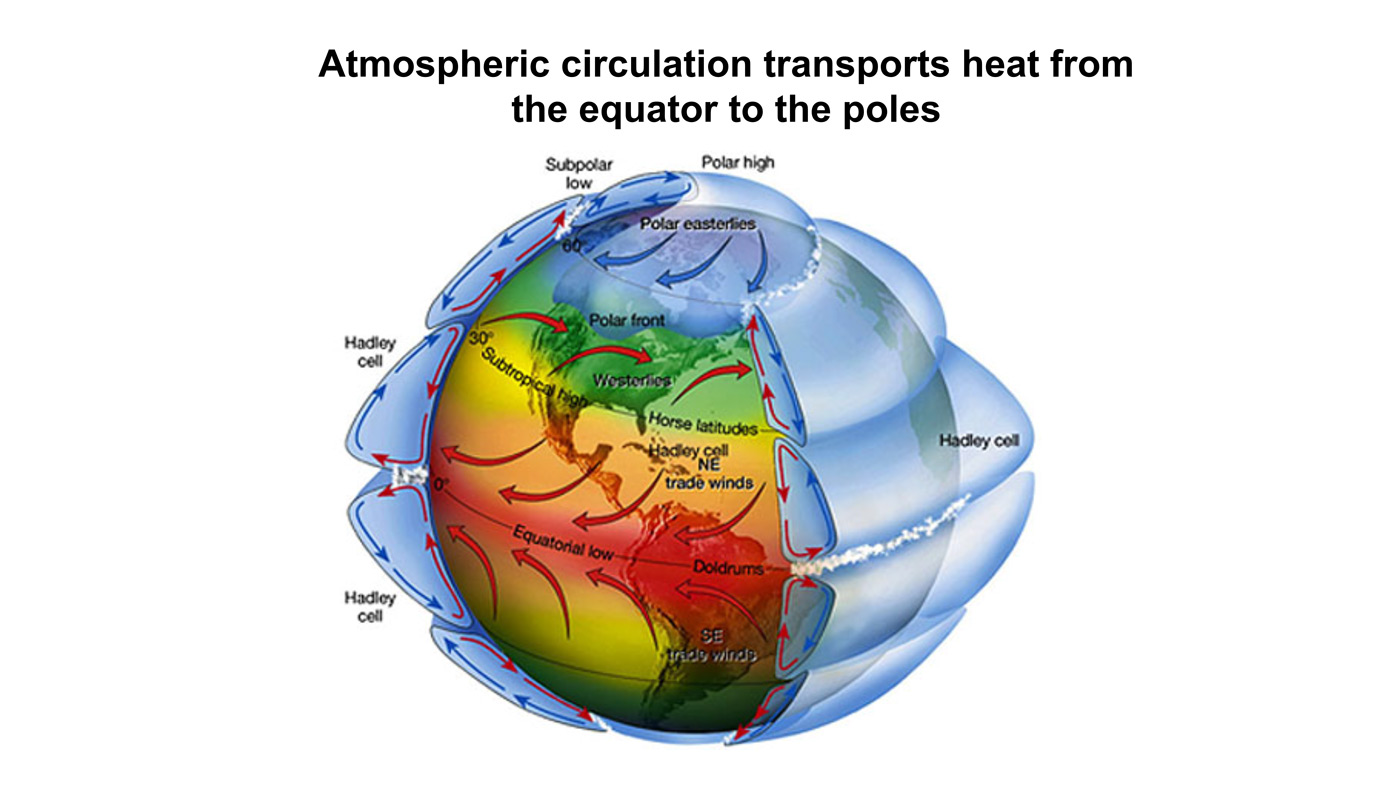
It is Soooo easy to get things just a little bit off and miss reality. Especially in complex systems and even more so when folks raking in $Millions are interested in misleading for profit. Sigh.
Sabine Hosenfelder does a wonderful series of videos ‘explaining’ all sorts of interesting things in and about actual science and how the universe works. She is quite smart and generally “knows her stuff”. But… It looks like she has gotten trapped into the Radiative Model of Globull Warming.
The whole mythology of Global Warming depends on having you NOT think about anything but radiative processes and physics. To trap you into the Radiative Model. But the Earth is more complex than that. Much more complex. Then there’s the fact that you DO have some essential Radiative Physics to deal with, so the bait is there. However…
It is absolutely essential to pay attention to convection in the lower atmosphere
and to the “feedback loops” or homeostasis in the system.
The system acts to restore its original state. There is NO “runaway greenhouse” or we would have never evolved into being since the early earth had astoundingly high levels of CO2 and we would have baked to death before getting out of our slime beds as microbes.
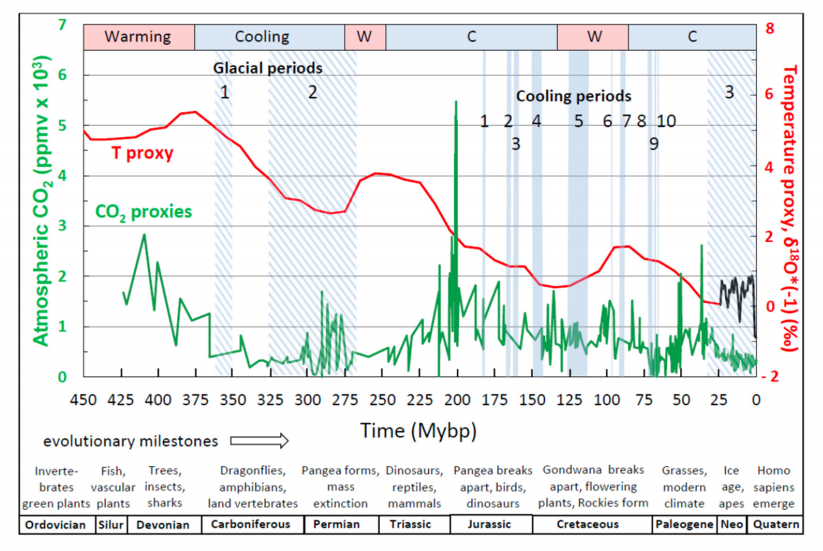
Figure 16. The geological history of CO2 level and temperature proxy for the past 400 million years. CO2 levels now are ~ 400ppm. Source: Davis, W. J. (2017).
OK, I’ll show you her video. It is quite good even with the “swing and a miss” at the end. She does 3 levels of The Greenhouse Gas Mythology so you can see the process evolving from grammar school to high school to college level of mythology. But then she doesn’t quite make it to Post-Doc Reality.
Where’s she wrong? (Well, not really wrong, but lacking…)
I see 2 major issues. First off, she talks about the “lower atmosphere warming”. Well, yes and no. It doesn’t “warm” in the sense of getting hotter, but it does speed up convection to move the added heat flow.
In English “heating” has 2 different meanings. Increasing temperature.
Increasing heat flow at a temperature.
We see this in “warm up the TV dinner in the microwave” meaning to heat it up from frozen to edible; and in the part where the frozen dinner is defrosting at a constant temperature as it absorbs heat but turns it into the heat of fusion of water. So you can “warm it up” by melting at a constant temperature of frozen water (but adding a LOT of thermal energy – “heat”) then later as increasing temperature once the ice is melted. It is very important to keep in mind that there are 2 kinds of “heating”. NOT just “increasing temperature”.
In the lower atmosphere, the CO2 window / Infrared Window is already firmly slammed shut. Sabine “gets that”. Yay! One BIG point for her! No amount of “greenhouse gas” is going to shut that IR window any more. As she points out, you get about 20 meters of transmission and then it is back to molecular vibrations (aka “heat”).
So what’s an atmosphere to do? It has heat to move! Well, it convects. It evaporates water.
Those 2 things dominate by orders of magnitude any sort of Radiative Model Physics. Yes, you have radiation of light bringing energy in, but then it goes into the ocean and into the dirt and the plants and even warms your skin on a sunny day. And it sits there. It does NOT re-radiate to any significant degree. Once “warmed” by absorption, heat trying to leave as IR hits a slammed shut window.

The hydrological cycle. Estimates of the observed main water reservoirs (black numbers in 10^3 km3 ) and the flow of moisture through the system (red numbers, in 10^3 km3 yr À1 ). Adjusted from Trenberth et al. [2007a] for the period 2002-2008 as in Trenberth et al. [2011].
Our planet is a Water Planet. It moves that energy (vibrations of atoms, NOT radiation) by having water evaporate into the atmosphere. (Yes, there are a few very dry deserts where you get some radiative effects and can get quite cold at night via radiation through very dry air, but our planet is 70% or so oceans, so those areas are minor side bars on the dominant processes). This water vapor makes the IR window even more closed (less distance to absorption). It isn’t CO2 that matters, it is the global water vapor.
What happens next?
Well, water holds a LOT of heat (vibration of atoms and NOT “temperature”) as the heat of vaporization. About 540 calories per gram (compared to 80 for melting “heat of fusion” and 1 for specific heat of a gram of water). Compare those numbers again. 1 for a gram of water. 80 for melting a gram of ice. 540 for evaporating a gram of water. It’s dramatically the case that evaporation of water matters a lot more than melting ice, and both of them make “warming water” look like an irrelevant thing.
Warming water is 1/80 as important as melting ice, and it is 1/540 th as important as evaporation of the surface of the water. Warming air is another order of magnitude less important to heat content.
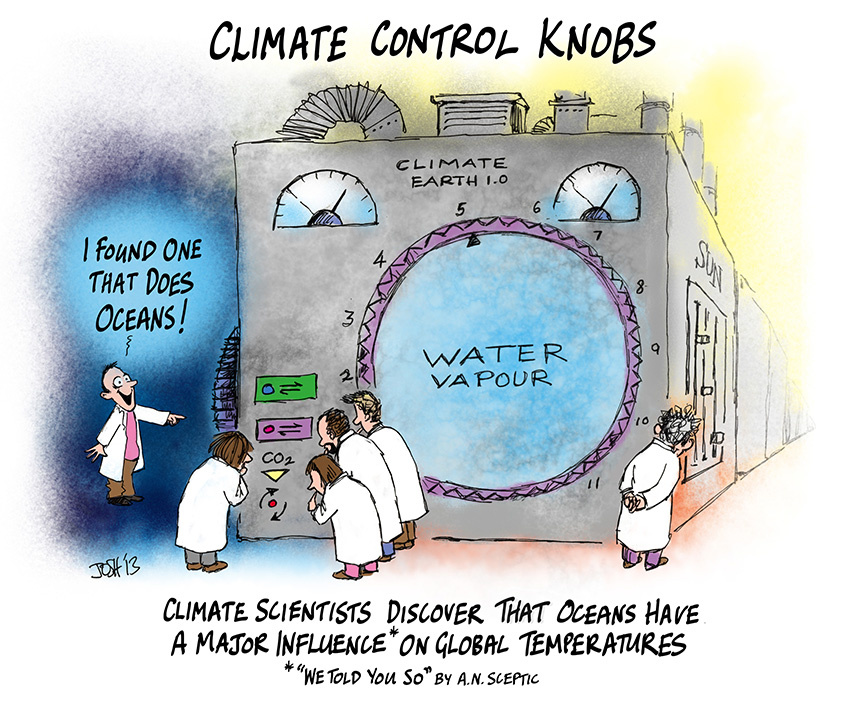
So to have clue, one MUST look at the evaporation of water from the oceans as everything else is in the small change.
Look at any photo of the Earth from space. The Blue Marble covered in clouds. Water and clouds. The product of evaporation, convection, and condensation. Physical flows carrying all that heat (“vibration of atoms” and NOT temperature, remember). IF you add more heat energy, you can speed up the flows, but it will not cause a huge increase in temperature (and mostly none at all). It is mass flow that changes. The number of vibrating molecules at a temperature, not the temperature of each.
In the end, a lot of mass flow happens, lofting all that water vapor with all that heat of vaporization way up toward the Stratosphere. This is why we have a troposphere, a tropopause (where it runs out of steam… literally…) and a stratosphere.
What happens when it gets to the stratosphere boundary? Well, along the way that water vapor turns into water liquid very tiny drops (clouds) and eventually condenses to big drops of water (rain) and some of it even freezes (hail, snow, etc.). Now think about that for a minute. That’s 540 calories per gram of heat (molecular vibration NOT temperature, remember) being “dumped” way up high in the top of the troposphere as it condenses, and another 80 / gram if if freezes. 620 total. That’s just huge.
This is WHY we have a globe covered with rain, snow, hail, etc. etc. THAT is all that heat moving. NOT any IR Radiation from the surface. Let that sink in a minute. Fix it in your mind. WATER and ICE and Water Vapor are what moves the heat, not radiation. We ski on it, swim in it, have it water our crops and flood the land. That’s huge and it is ALL evidence of heat flows via heat of vaporization and fusion of water.
It is all those giga-tons of water cycling to snow, ice and rain, then falling back to be lofted again as evaporation in the next cycle. That’s what moves the heat to the stratosphere where CO2 then radiates it to space (after all, radiation toward the surface hits that closed IR window and stops.) At most, more CO2 can let the Stratosphere radiate (and “cool”) better. It can not make the Troposphere any less convective and non-radiative.
Then any more energy “trapped” at the surface would just run the mass transport water cycle faster. It would not increase the temperature.
More molecules would move, but at a limit on temperature. Homeostasis wins. We can see this already in the Sub-Tropics. As the seasons move to fall and winter, water flows slow dramatically. I have to water my Florida lawn and garden. As the seasons move to spring and summer, the mass flow picks up dramatically. Eventually reaching hurricane size. Dumping up to FEET of condensed water (that all started as warm water vapor evaporating from the ocean). It is presently headed for about 72 F today (and no rain). At the peak of hurricane season, we get to about 84 or 85 F ocean surface temperature as the water vapor cycle is running full blast and we get “frog strangler” levels of rain. That’s the difference. Slow water cycle or fast.
IF (and it is only an “if”, not a when) you could manage to increase the heat at the surface of the planet in, say, Alaska: At most you would get a bit more rain in summer, a bit more snow in winter, and MAYBE only a slight possible, of one or two days that are rain which could have been snow or sleet.
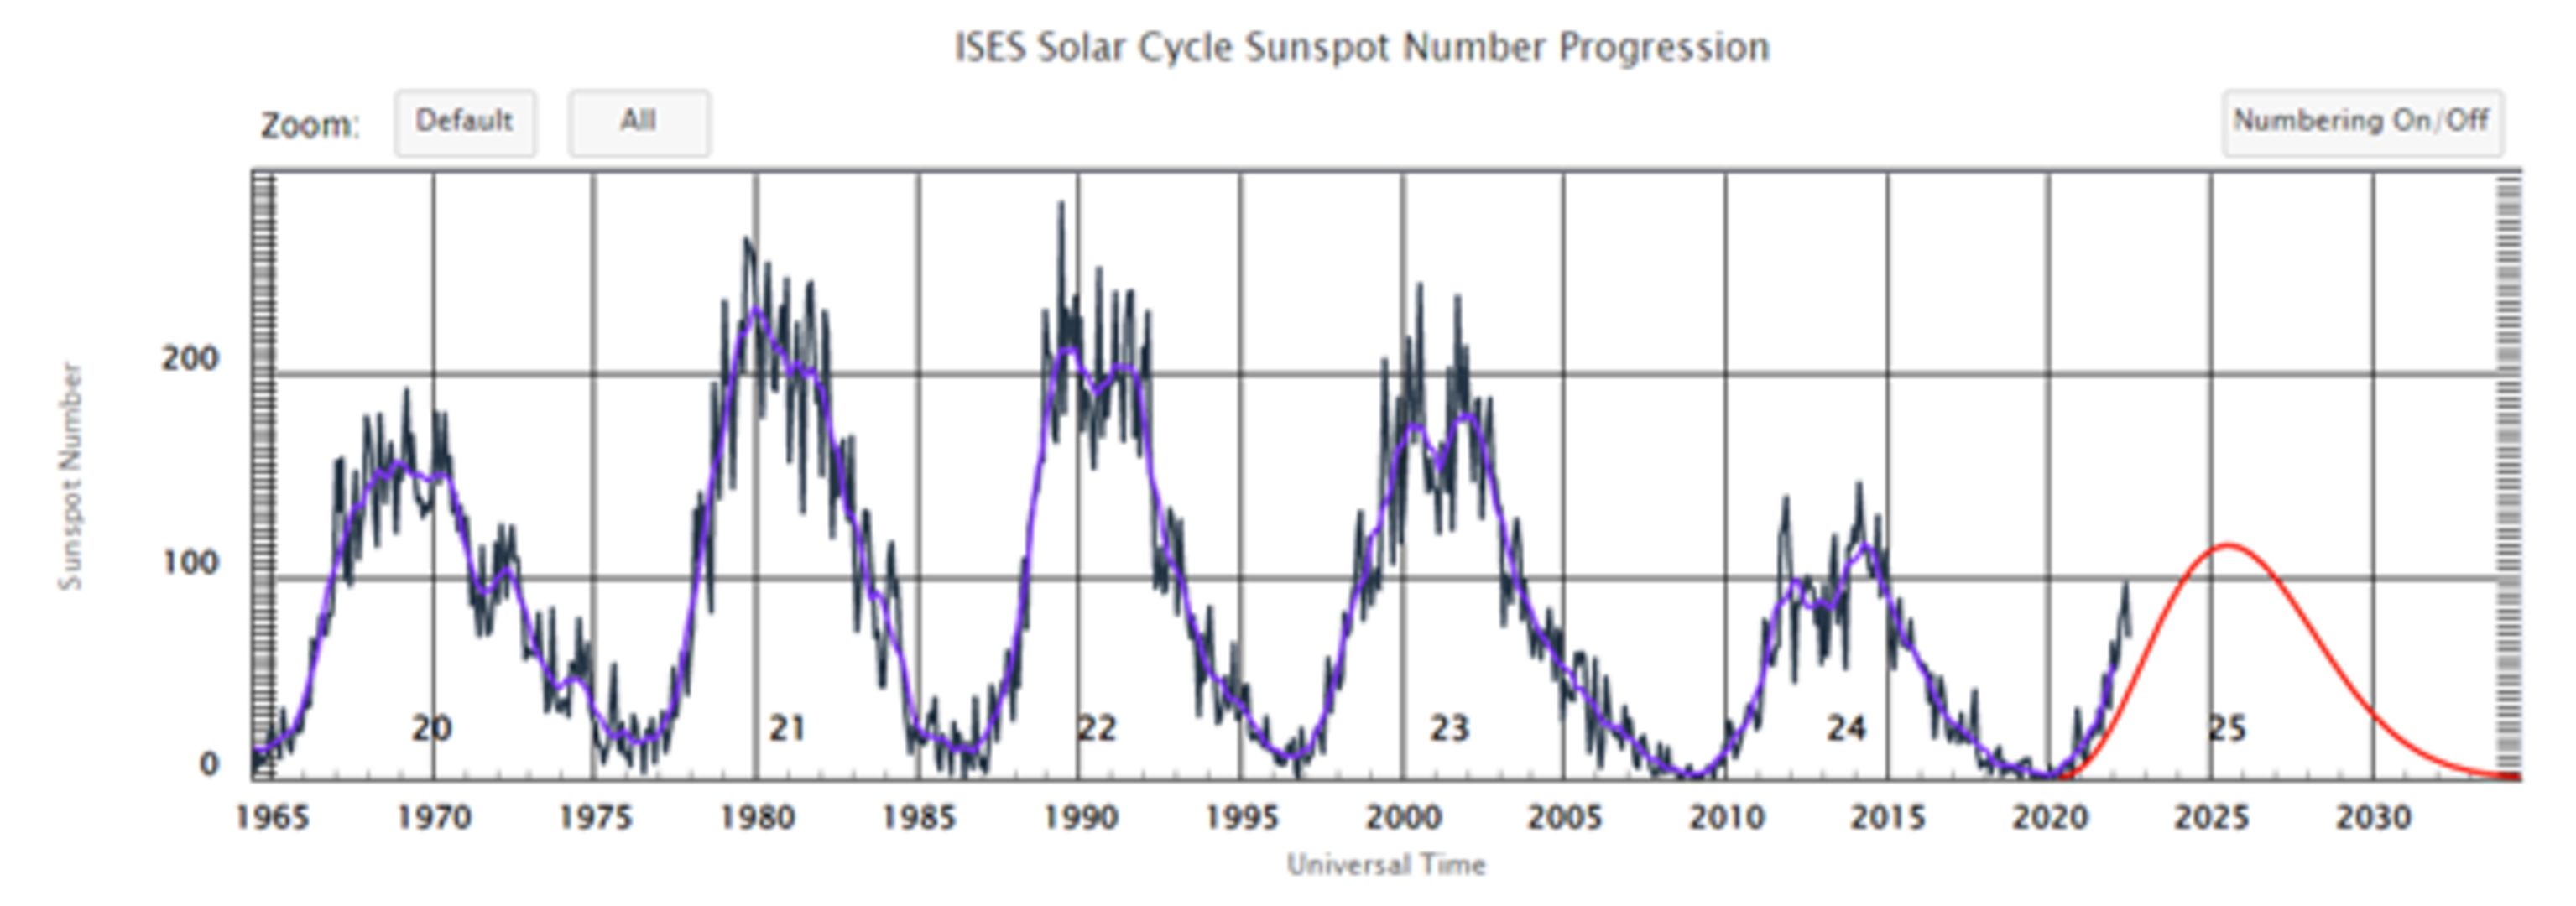
Then there’s the fact that natural cycles swamp all of that CO2 fantasy anyway. The Sun, as just one example, had a large change of IR / UV levels with both the Great Pacific Climate Shift (about 1975) and then back again in about 2000. Planetary tilt, wobble, eccentricity of the orbit and more put us in ice ages (as we ARE right now, but in an “interglacial” in this ice age… a nice period of warmth that WILL end) and pulls us out of them. Glacials and interglacials come and go on various cycles (100,000 years, 40,000 years, and 12,000 year interglacials – ours ending now, but slowly). The simple fact is that Nature Dominates, and we are just not relevant. To think we are is hubris of the highest order.
See Also Bill Gray: H20 is Climate Control Knob, not CO2
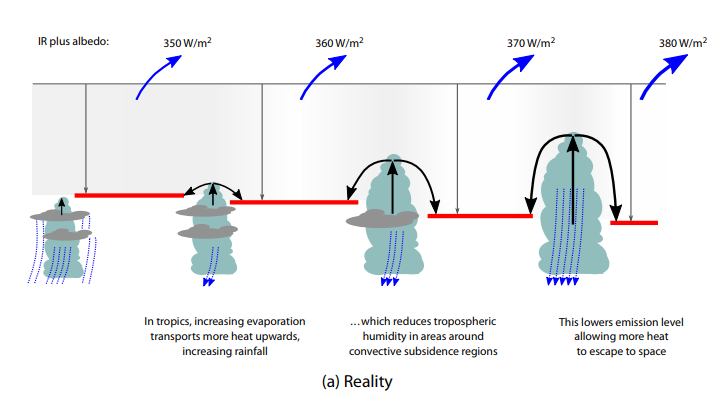
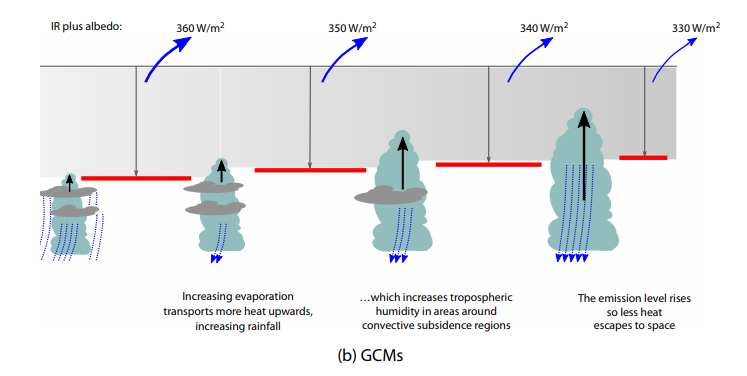
Figure 9: Two contrasting views of the effects of how the continuous intensification of deep cumulus convection would act to alter radiation flux to space. The top (bottom) diagram represents a net increase (decrease) in radiation to space
There are two main reasons why investigators are skeptical of AGW (anthropogenic global warming) alarm. This post intends to be an antidote to myopic and lop-sided understandings of our climate system.

Myopia is a failure of perception by focusing on one near thing to the exclusion of the other realities present, thus missing the big picture. For example: “Not seeing the forest for the trees.” AKA “tunnel vision.”
2. CO2 Alarm is Lopsided: CO2 forcing is too small to have the overblown effect claimed for it. Other factors are orders of magnitude larger than the potential of CO2 to influence the climate system.

Lop-sided refers to a failure in judging values, whereby someone lacking in sense of proportion, places great weight on a factor which actually has a minor influence compared to other forces. For example: “Making a mountain out of a mole hill.”

Tyler Durden reports at zerohedge Lab-Grown Meat Gets Green Light On US Menus. Excerpts in italics with my bolds.
The World Economic Forum’s dietary blueprint for the masses is becoming a reality as lab-grown meat, bugs, and plant-based foods are quickly being adopted under the guise of solving ‘climate change.’ The latest move by elites and governments to reset the global food supply chain is US regulators approving the sale of meat cultivated from Chicken cells. This makes the US the second country worldwide, besides Singapore, to approve the sale of lab-grown fake meat.

The Agriculture Department approved Upside Foods and Good Meat to begin selling “cell-cultivated” or “cultured” chicken meat from labs in supermarkets and restaurants.
“Today’s watershed moment for the burgeoning cultivated meat, poultry and seafood sector, and for the global food industry,” Good Meat said in a statement.
Researchers conducted a life-cycle assessment of the energy needed and greenhouse gases emitted in all stages of production and compared that with beef. One of the current challenges with lab-grown meat is the use of highly refined or purified growth media, the ingredients needed to help animal cells multiply. Currently, this method is similar to the biotechnology used to make pharmaceuticals. This sets up a critical question for cultured meat production: Is it a pharmaceutical product or a food product? -UC Davis
“If companies are having to purify growth media to pharmaceutical levels, it uses more resources, which then increases global warming potential,” according to lead author and doctoral graduate Derrick Risner, of the US Davis Department of Food Science and Technology. “If this product continues to be produced using the “pharma” approach, it’s going to be worse for the environment and more expensive than conventional beef production.”

Cultured Beef Burger grown from stem cells of cattle made by Professor Mark Post of Netherland’s Maastricht University.
The scientists considered the ‘global warming potential’ to be the carbon dioxide equivalents emitted for each kilogram of meat produced – and found that the global warming potential (GWP) of lab-based meat using these purified media is up to 25 times greater than the average for retail beef.
The study is Environmental impacts of cultured meat: A cradle-to-gate life cycle assessment Derrick Risner et al. (UC Davis) 2023. Excerpts in italics with my bolds and added images.
Interest in animal cell-based meat (ACBM) or cultured meat as a viable environmentally conscious replacement for livestock production has been increasing, however a life cycle assessment for the current production methods of ACBM has not been conducted.
Currently, ACBM products are being produced at a small scale and at an economic loss, however ACBM companies are intending to industrialize and scale-up production. This study assesses the potential environmental impact of near term ACBM production.
Updated findings from recent technoeconomic assessments (TEAs) of ACBM and a life cycle assessment of Essential 8™ were utilized to perform a life cycle assessment of near-term ACBM production. A scenario analysis was conducted utilizing the metabolic requirements examined in the TEAs of ACBM and a purification factor from the Essential 8™ life cycle assessment was utilized to account for growth medium component processing.
The results indicate that the environmental impact of near-term ACBM production
is likely to be orders of magnitude higher than median beef production
if a highly refined growth medium is utilized for ACBM production.

Figure 1 is a process flow diagram of a fed-batch ACBM production system with associated energy requirements.
After all the inputs were identified and consolidated, a life cycle impact assessment was completed utilizing data and methods from the E8 LCA, OpenLCA v.1.10 software and OpenLCA LCIA v2.1.2 methods software. The tool for reduction and assessment of chemicals and other environmental impacts (TRACI) 2.1 was the LCIA methods utilized in the OpenLCA LCIA software, and these results were combined with the facility power data to determine the potential environmental impact of the production of 1 kg ACBM (wet basis).
Scenario analysis
All scenarios utilize a fed-batch system as described in the Humbird (2021) TEA. Energy estimates from the Humbird TEA are utilized in all scenarios. Growth medium components were assumed to be delivered to the animal cells as needed and the build-up of growth inhibiting metabolites such as lactate or ammonia are not accounted for unless specifically stated in the scenario. The growth medium substrates are also assumed to be supplied via fed batch to achieve the highest possible specific growth rate in the production bioreactor. The three minimum/base scenarios were defined utilizing data from the Risner et al. and Humbird TEAs then a purification factor was applied based on the results from a LCA which examined the environmental impact of fine chemical and pharmaceutical production (Wernet et al., 2010).
Each of the three base scenarios were examined independently and then
with the purification factor applied for a total of six scenarios in the assessment.
The LCIA was conducted on both the base scenarios and scenarios with purified growth medium components. The GWP for all ACBM scenarios (19.2 to 1,508 kg of CO2e per kilogram of ACBM) was greater than the minimum reported GWP for retail beef (9.6 kg of CO2e per kg of FBFMO) (Poore & Nemecek, 2018). The GWP of all purified scenarios ranged from 246 to 1,508 kg of CO2e per kilogram of ACBM which is 4 to 25 times greater than the median GWP of retail beef (∼60 kg CO2e per kg of FFBMO). Without purification of the growth medium components, the GWP of the GCR scenario is approximately 25% greater than reported median of GWP of retail beef (Poore & Nemecek, 2018).
It should be noted that the system boundary of this LCA stops at the ACBM production facility gate and does not include product losses, cold storage, transportation, and other environmental impacts associated with the retail sale of beef. Inclusion of these post-production processes would increase the GWP of ACBM products.

Figure 3 illustrates the difference in the GWP of retail beef and cradle to upstream ACBM production gate.
Our results indicate that ACBM is likely to be more resource intensive than most meat production systems according to this analysis. In this evaluation, our primary focus has been on the resource intensity of the growth mediums. We have largely focused on the quantity of growth medium components (e.g. glucose, amino acids, vitamins, growth factors, salts, and minerals) and attempted to account for purification requirement of those components for animal cell culture. We also acknowledge that our analysis may be viewed as minimum environmental impacts due to several factors including incomplete datasets, the exclusion of energy and materials required to scale the ACBM industry and exclusion of the energy and materials needed to scale industries which would support ACBM production.
Animal cell culture is inherently different than culturing bacteria or yeast cells due to their enhanced sensitivity to environmental factors, chemical and microbial contamination. This can be illustrated by the industrial shift to single use bioreactors for monoclonal antibody production to reduce costs associated with contamination (Jacquemart et al., 2016). Animal cell growth mediums have historically utilized fetal bovine serum (FBS) which contains a variety of hormones and growth factors (Jochems et al., 2002). Serum is blood with the cells, platelets and clotting factors removed. Processing of FBS to be utilized for animal cell culture is an 18-step process that is resource intensive due to the level of refinement required for animal cell culture.
Thus, the authors believe that commercial production of an ACBM product utilizing
FBS or any other animal product to be highly unlikely given this high level of refinement.
Critical assessment of the environmental impact of emerging technologies is a relatively new concept, but it is highly important when changes to societal-level production systems are being proposed (Bergerson et al., 2020). Agricultural and food production systems are central to feeding a growing global population and the development of technology which enhances food production is important for societal progress. Evaluation of these potentially disruptive technologies from a systems-level perspective is essential for those seeking to transform our food system. Ideally, systems-level evaluations of proposed novel food technologies will allow policymakers to make informed decisions on the allocation of government capital. Proponents of ACBM have hailed it as an environmental solution that addresses many of the environmental impacts associated with traditional meat production.
Upon examination of this highly engineered system, ACBM production appears
to be resource intensive when examined from the cradle to production gate
perspective for the scenarios and assumptions utilized in our analyses.
Our environmental assessment is grounded in the most detailed process systems available that represent current state-of-the-art in this emerging food technology sector. Our model generally contradicts previous studies by suggesting that the environmental impact of cultured meat is likely to be higher than conventional beef systems, as opposed to more environmentally friendly. This is an important conclusion given that investment dollars have specifically been allocated to this sector with the thesis that this product will be more environmentally friendly than beef.

In sum, understanding the minimum environmental impact of near term ACBM is highly important for governments and businesses seeking to allocate capital that can generate both economic and environmental benefits (Zimberoff, 2022). We acknowledge that our findings would likely be the minimum environmental impact due to the preliminary nature of our LCA. This LCA aims to be as transparent as possible to allow the interested parties to understand our logic and why we have developed these conclusions. We also hope that our LCA will provide evidence of the need for additional critical environmental examination of new food and agriculture technologies.
“Our findings suggest that cultured meat is not inherently better for the environment than conventional beef. It’s not a panacea,” said corresponding author Edward Spang, an associate professor in the Department of Food Science and Technology. “It’s possible we could reduce its environmental impact in the future, but it will require significant technical advancement to simultaneously increase the performance and decrease the cost of the cell culture media.”
Even the most efficient beef production systems reviewed in the study outperform
cultured meat across all scenarios (both food and pharma), suggesting that
investments to advance more climate-friendly beef production may yield
greater reductions in emissions more quickly than investments in cultured meat.


From energypost.eu comes the news Nearly half of national climate pledges (NDCs) intend to keep extracting fossil fuels. Excerpts in italics with my bolds.
Nationally Determined Contributions” (NDCs) are a nation’s published plans to reduce emissions and adapt to the impacts of climate change. Nations are obliged to update their NDCs every five years, to give more detail. That added detail is a cause for concern in the latest round of NDCs: there is an increase in countries communicating plans to maintain or increase production rather than phase it out.
This goes against the fact that oil and gas production needs to decline
by at least 65% by 2050 in scenarios that limit warming to 1.5C.
We found that more and more countries are discussing the production of fossil fuels in their “nationally determined contributions” (NDCs).
The topic is mentioned in two-thirds of fossil fuel-producing countries’ second-round NDCs, an increase on the first iteration, highlighting the increased discussion around the topic.
But we observe that while a few countries are reporting on measures to phase out fossil fuel production, nearly half of second-round NDCs included plans to maintain or even increase fossil fuel production.
Here, we take a closer look at the growing discussion of fossil fuel production in NDCs and “long-term low emissions development strategies” (LT-LEDS), the significance of their inclusion and how governments could build in targets and pathways for winding down production as we look to the next NDC cycle.
Within the analysis, we looked at 103 first-round NDCs (those published between 2015-19), 95 second-round NDCs (2019-March 2023) and 31 LT-LEDS belonging to fossil fuel producing countries.
Additionally, we looked at 65 first-round NDCs, 48 second-round NDCs and 19 LT-LEDS submitted by countries that do not produce fossil fuels.
Overall, only two countries discuss targets or policies designed to restrict or wind down fossil fuel production in their first-round NDCs, illustrated by the mid-green sliver in the second column from the top of the chart above. This rises to five in second-round NDCs (dark green) and 13 in LT-LEDS (light green).

Others – as shown in the first set of bars – do not include active policies, but, rather, quietly acknowledge the reality that their fossil fuel production will decrease. Australia is in this camp, for instance. Its LT-LEDS, while pledging to continue producing fossil fuels for as long as the world needs them, predicts that production will be 35% lower in 2050 than in 2020 due to changes in global demand.
However, a much larger number of countries plan to increase fossil fuel production, or indicate that they will maintain current levels: 35 first-round NDCs, 45 second-round NDCs, and 13 LT-LEDS . This is illustrated in the second set of bars in the figure above (“continuing or increasing production”).
In particular, this increase within the second-round of NDCs is notable, with 15 new countries including the continuation or expansion of fossil fuel production in their second-round NDCs, while only three have dropped the reference in the second iteration.
Indeed, two countries that do not currently produce oil and gas – Lebanon and Senegal –
expressed intent to begin in their second-round NDC.
Many countries, such as Canada, Norway, the United Arab Emirates and Saudi Arabia, include commitments to reduce flaring, electrify processes or increase the energy efficiency of fossil fuel production.
These countries mostly do not simultaneously indicate any intention to scale down production volumes, however, despite the fact that oil and gas production declines by at least 65% by 2050 in scenarios that limit warming to 1.5C.

In the past few years, the earth cooled after warming from the 2015-2016 El Nino, and with higher North Atlantic summer anomalies repeating in 2020. The cooling was significant as shown in the chart below (from the UAH satellite temperature dataset.)
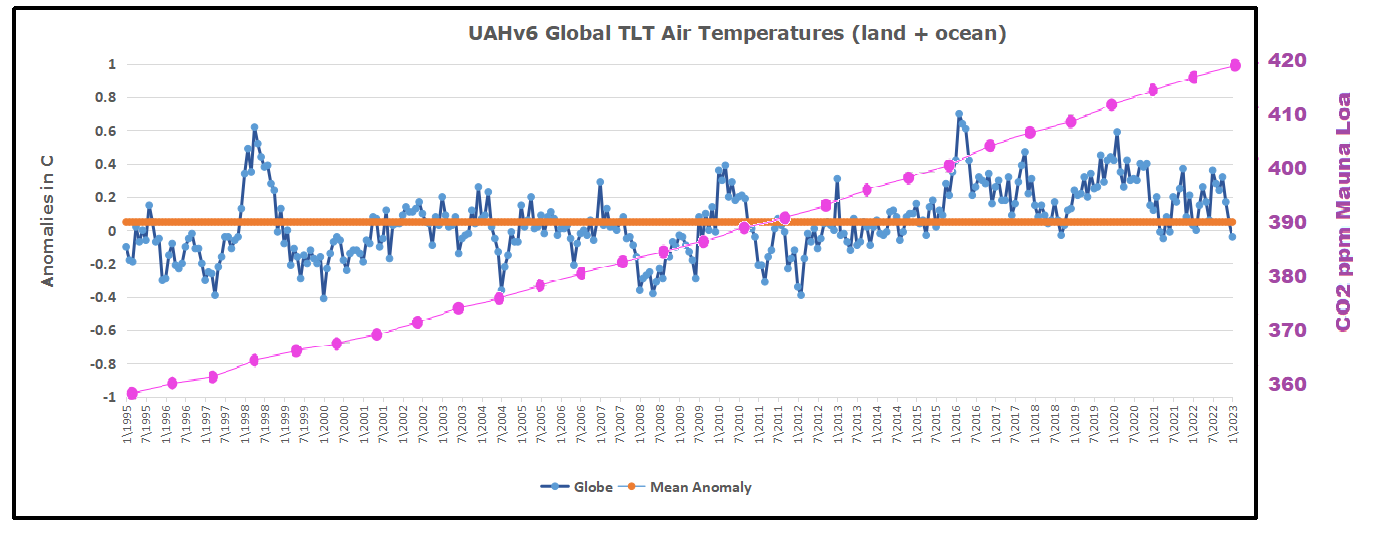
The Global anomaly dropped from +0.7C January 2016 to <0.0C January 2023. And of course the media ignored that cooling since they are addicted to the global warming narrative: temperatures can only go up, since CO2 keeps rising. On the contrary, the chart shows CO2 did rise steadily, while temps fluctuated up and down, ending this period of 27 years flat.
The calendar turning to June and the official start to summer triggers the usual alarms that this year will surely be the hottest ever. Headlines recently:
♦ Is 2023 going to be the hottest year on record? World Economic Forum
♦ Why 2023 is shaping up to be the hottest year on record New Scientist
♦ Global temperatures in 2023 set to be among hottest on record The Guardian
♦ 2023 will be ‘one of the hottest on record’ says Met Office BBC
And of course you can count on NYT to totally jump the shark:
♦ The Last 8 Years Were the Hottest on Record – The New York Times
Curiously, a lot of us have so far seen unseasonably cool temperatures this year, and wonder where this hottest year could be? I mean, 60 cm of snow yesterday in Jasper Park Alberta? Suspecting that we have again a weather/climate perception that exists everywhere elsewhere, I turned to NOAA’s Climate at a Glance website to see what their data shows.
Climate reporting is confusing because the scope of temperature averaging gives very different impressions, and at the mega scale rarely corresponds to anyone’s particular experience. So generalizations are claimed extrapolating from statistics, contradicted by many persons’ direct experience.
NOAA State of the Climate is another site advocating for the IPCC agenda and illustrates how this works. First the Global Climate Report:
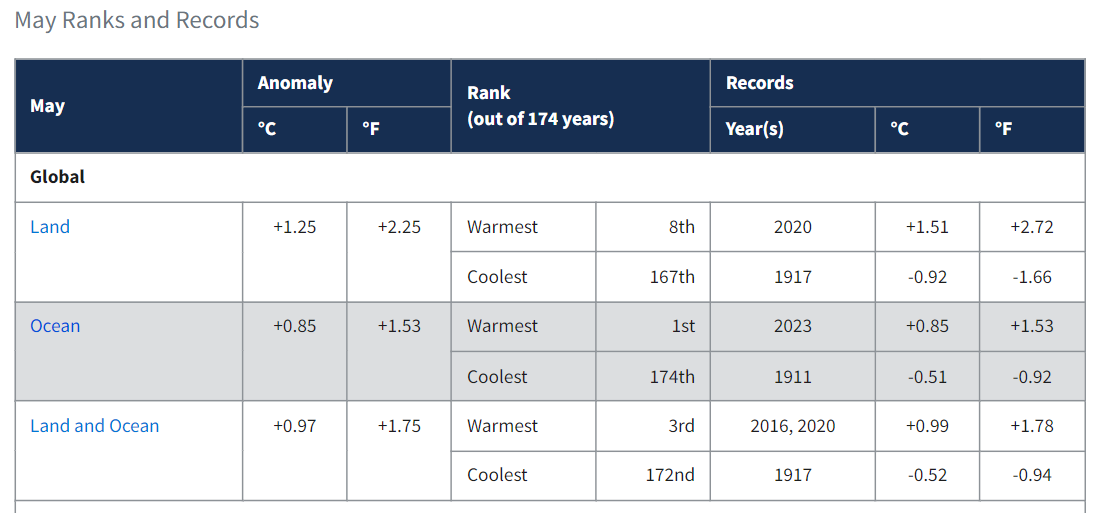
So there is the #1 warmest Ocean, but we now can see the Land was 8th and combined Global is 3rd, not 1st. Now let’s look at the year to date (YTD):
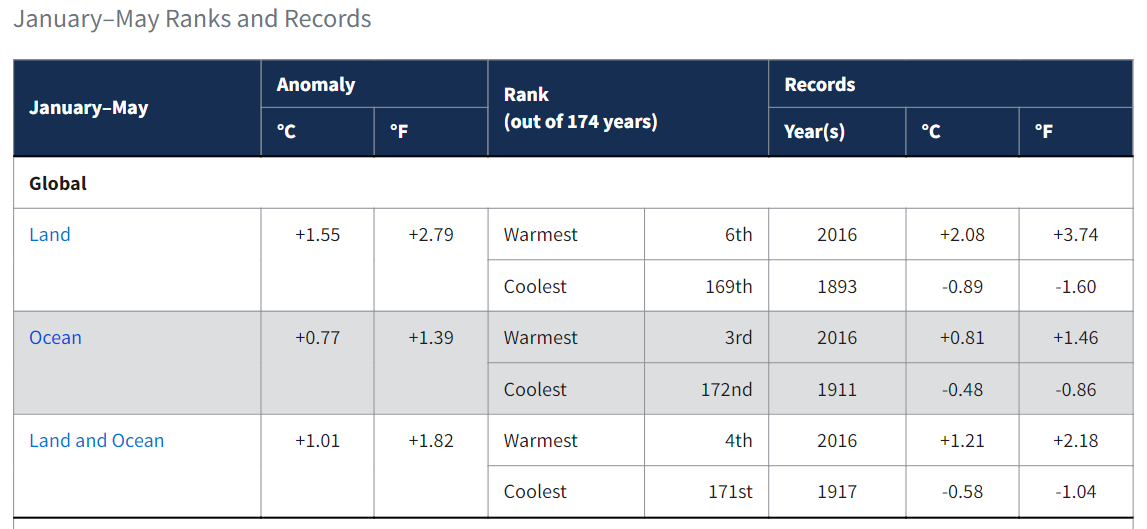
Oh oh, that’s not as scary; the first 5/12ths of 2023 are not #1, but the ocean is #3, Land #6, and the Global start to the year is #4. And the table shows that 2016 was the hottest, consistent with the UAH graph above.
And to understand why most people will be put off by hottest year claims, we go to the Regional Analysis in order to see what the year has been like in various continents (land by definition).
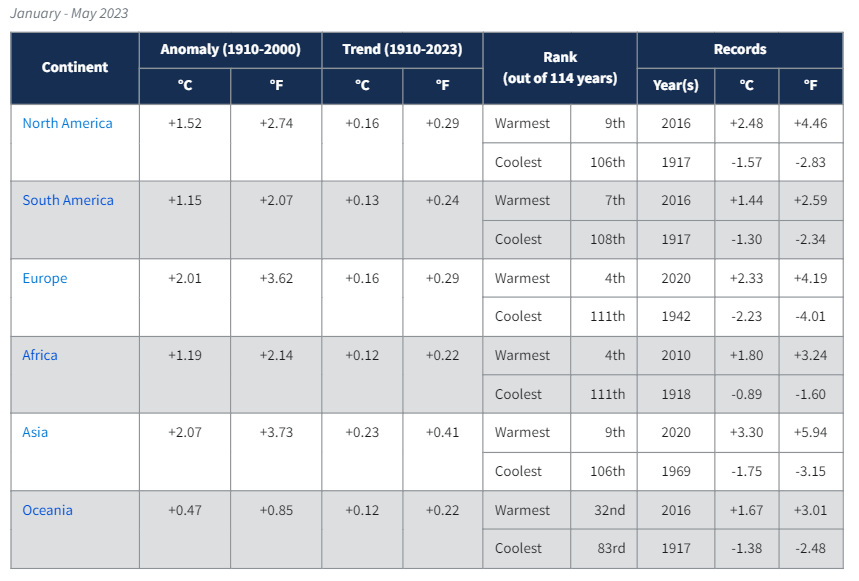
It becomes obvious that no matter where I live, don’t tell me this is the hottest year ever. OK some Africans and Europeans may agree, but those in Oceania (mostly Australians) will boo you out of the room.
Footnote: Everyone has an agenda and packages data in support of their POV. Those who joined the anti-hydrocarbon crusade are bound to find and amplify any bit of global warming they can find. My agenda is for people to consider the full amount of relevant data and facts, and to reason accordingly rather than go along with the crowd or their feelings. My approach is best expressed in this essay:
Jim Hoft reports at Gateway Pundit Jury Trial Finally Possibility For 2020 Election Fraud Claims As Philly Judge Rejects Protective Order Request. Excerpts in italics with my bolds and added images.

Leah Hoopes and Gregory Stenstrom were GOP poll watchers
in Chester Pennsylvania during the 2020 election.
The far-left officials running the local elections forced the GOP poll watchers into a small pen where they could not witness the ballot counting. This was a common tactic used in swing states by far-left officials during the 2020 election. GOP poll watchers were abused and prevented from doing their job in several states.
These tactics resulted in massive chain of custody issues across the US — and the actions always hampered Republican poll watchers, never the other way around. This is one tactic Democrats used to cheat and steal the controversial election.

After Leah Hoopes and Gregory Stenstrom testified in Gettysburg, Pennsylvania, special agents from the state Attorney General’s office showed up at their door to harass them. And then Delaware County sued Leah and Greg for court costs after they spoke out nationally on the voter fraud they witnessed in their county.
Jury Trial Finally Possibility For 2020 Election Fraud Claims As Philly Judge Rejects Protective Order Request — Attorney Conor Corcoran got a solid spanking when Judge Michael E. Erdos denied his request for a protective order against election whistleblowers Leah Hoopes and Greg Stenstrom, today, June 20, in Philadelphia Common Pleas Court.
Erdos rejected everything Corcoran sought which included a $15,000 fine, the removal of guns and “incendiary” devices from the defendants’ homes, and that they never come within a mile of his client.
Corcoran is representing former Delaware County, Pa. Voting Machine
Warehouse supervisor James Savage in a defamation suit
regarding claims that the 2020 election was rigged in Delco.
The pair’s co-defendants include President Donald Trump, Rudy Giuliani and Jen Ellis.
Corcoran based his request on Stenstrom’s frequent used of Frederick Douglass’s boxes of liberty during interviews and public speaking engagements. Douglass said liberty depends on three boxes: the ballot box, the jury box and the cartridge or powder box, depending on the version.
Corcoran said that Stenstrom’s use of powder box made him fear
that Stenstrom was planning to blow him up.
It was a ridiculous stretch as was indicated by the decision. Why would Corcoran waste the court’s valuable time with this foolishness? Was he hoping that the pair, who are representing themselves, would not show? That they would not be prepared? Well, they did and were, and the professional attorney ended up with pie on his face, albeit Savage will be getting the bill.
Stenstrom and Mrs. Hoopes noted that several figures in American history have used the phrasing.
Stenstrom further noted that he was veteran who had seen war. He said violence was the last thing he wanted in America. He said he emphasized at every speaking event or interview that the law is the only path to trustworthy elections.

Erdos asked that the defendants be circumspect in their used of the boxes of liberty statement but did not order them to stop using it.
Erdos said that none of the various cases regarding 2020 election fraud allegations ever went before a jury and that the eyes of the world will be on Philadelphia when this case goes to trial.

Apparently someone posted on Facebook that Arctic ice extent is presently surplus to average, which triggered the fact checking agency employed by the platform. The content below is from The Cable Fact Check No, short time data can’t determine overall decline of arctic sea ice. In italics with my bolds and comments in parentheses.
Facebook post has claimed that arctic ice is neither declining nor disappearing.
Attached to the post was an article showing a graph for arctic ice for mid-April through mid-May in 2007, 2018, 2021 and 2023.
The article was titled: “Arctic Ice Plentiful Mid May 2023”.
The graph indicated that the area of the ocean covered by a certain percentage of ice is higher in 2023 than in the other listed years and similar to the 17-year average.
“The ice is not disappearing,” says the Facebook post, which claimed that data for the month of April and May 2023 shows that the arctic sea ice is not declining. [consistent with “similar to the 17-year average”]
RECORDS SHOW THAT SEA ICE IS DECREASING
According to the National Aeronautics and Space Administration (NASA), a US agency responsible for aeronautics and space research, the volume of ice has significantly reduced. [Note the switch to the volume metric which is model estimated with considerable uncertainty]
The US agency has also reported that the average age of sea ice is becoming shorter.
Citing far back as the late 1970s, when satellite recording commenced, NASA says most of the ice covering the arctic ocean at that time was greater than 4 years old.
Presently, most of the ice covering the ocean is first-year ice, formed during winter, and very unlikely to withstand a single melt season during summer. [Really, how about this:
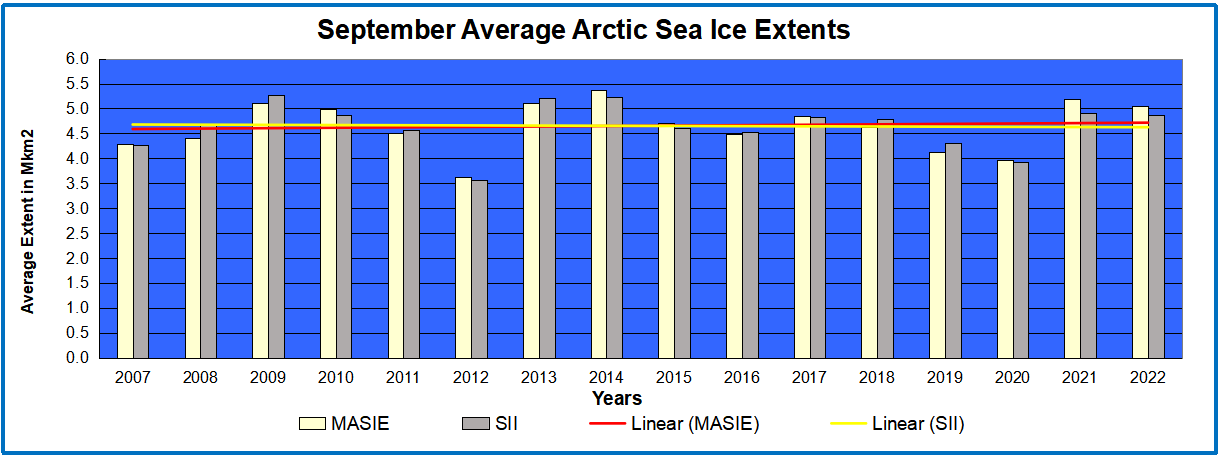
Also, data released by the National Snow and Ice Data Centre, explains that the size of the arctic sea has declined since the 1970s. [size of the sea itself?]
Although the 2023 sea ice extents were slightly higher for the period under review – mid-April through mid-May than in 2007, 2018 and 2021 – just like the Facebook post stated. However, the sea ice varies by year and season despite that it is experiencing an overall decline. [Varies, yes, but the decline stopped in 2007:
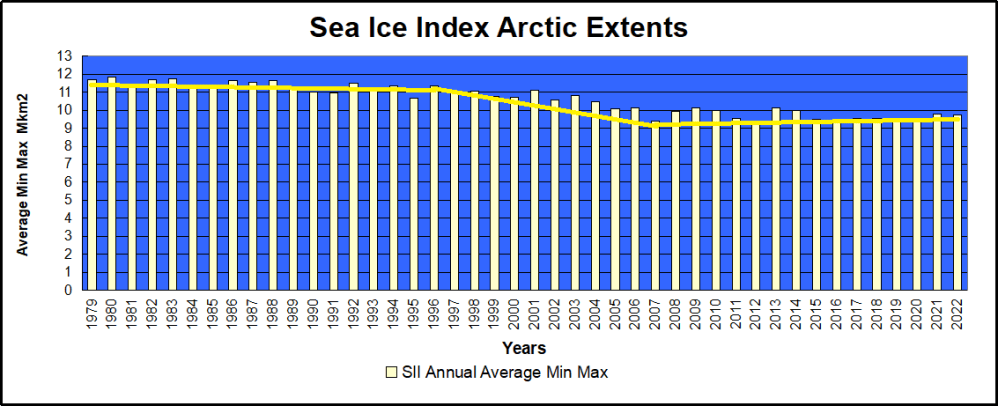
Sea ice extent is the area of ice that covers the arctic ocean at a given time.
Climate experts have also reported that compiling or analysing short-term data is inadequate for making accurate climatological inferences.
Olusola Ayantobo, a hydro-climatologist and research associate at China’s Tsinghua University, had told TheCable that “station data shouldn’t be used to predict climate change conditions over a particular region”.
The climate expert added that: “Short-term datasets can only be used for weather prediction while a long dataset is appropriate for climate change predictions.” [Note that both their preferred Sea Ice Index (SII) and MASIE the best current condition dataset, validated from 2006 forward, show the same lack of decline in sea ice extent]
Experts say that though two decades might look quite long, however, it is short when studying long-term climate trends. [True, but the same people predicted an ice-free arctic based on the decline from 1997 to 2007.]
MELTING SEA ICE AGGRAVATES GLOBAL WARMING
The albedo effect explains why the rapid melting of sea ice aggravates climate change. The theory says that the bright surface of the ice reflects solar energy, which has a cooling effect. Also, ocean water, which is darker, absorbs more solar energy, causing more warming.
The loss of sea ice warms the arctic, hence, contributing to a phenomenon referred to as arctic amplification, a process through which the arctic warms at a faster rate than lower latitudes.
VERDICT
The claim that the sea ice is neither melting nor disappearing is false.
Long-term studies dating back to 1970 show that arctic sea ice has declined significantly. Climate experts have also warned that only long-term data analysis can provide accurate inferences when studying climate trends. [Note: Does that mean ignoring the last 17 years of ice stability?]
This fact check was produced by TheCable with support from Code for Africa’s PesaCheck, International Fact-Checking Network, and African Fact Checking Alliance network. [Code For Africa is funded by 2 investors. Omidyar Network and Bill & Melinda Gates Foundation are the most recent investors.]
[Comment: As usual, they are checking a narrative, rather than facts. And then cherry-pick other facts or statements favoring their preferred narrative.]
Regarding Arctic “Amplification”
An artifact of using anomalies, which are highly variable at higher latitudes:

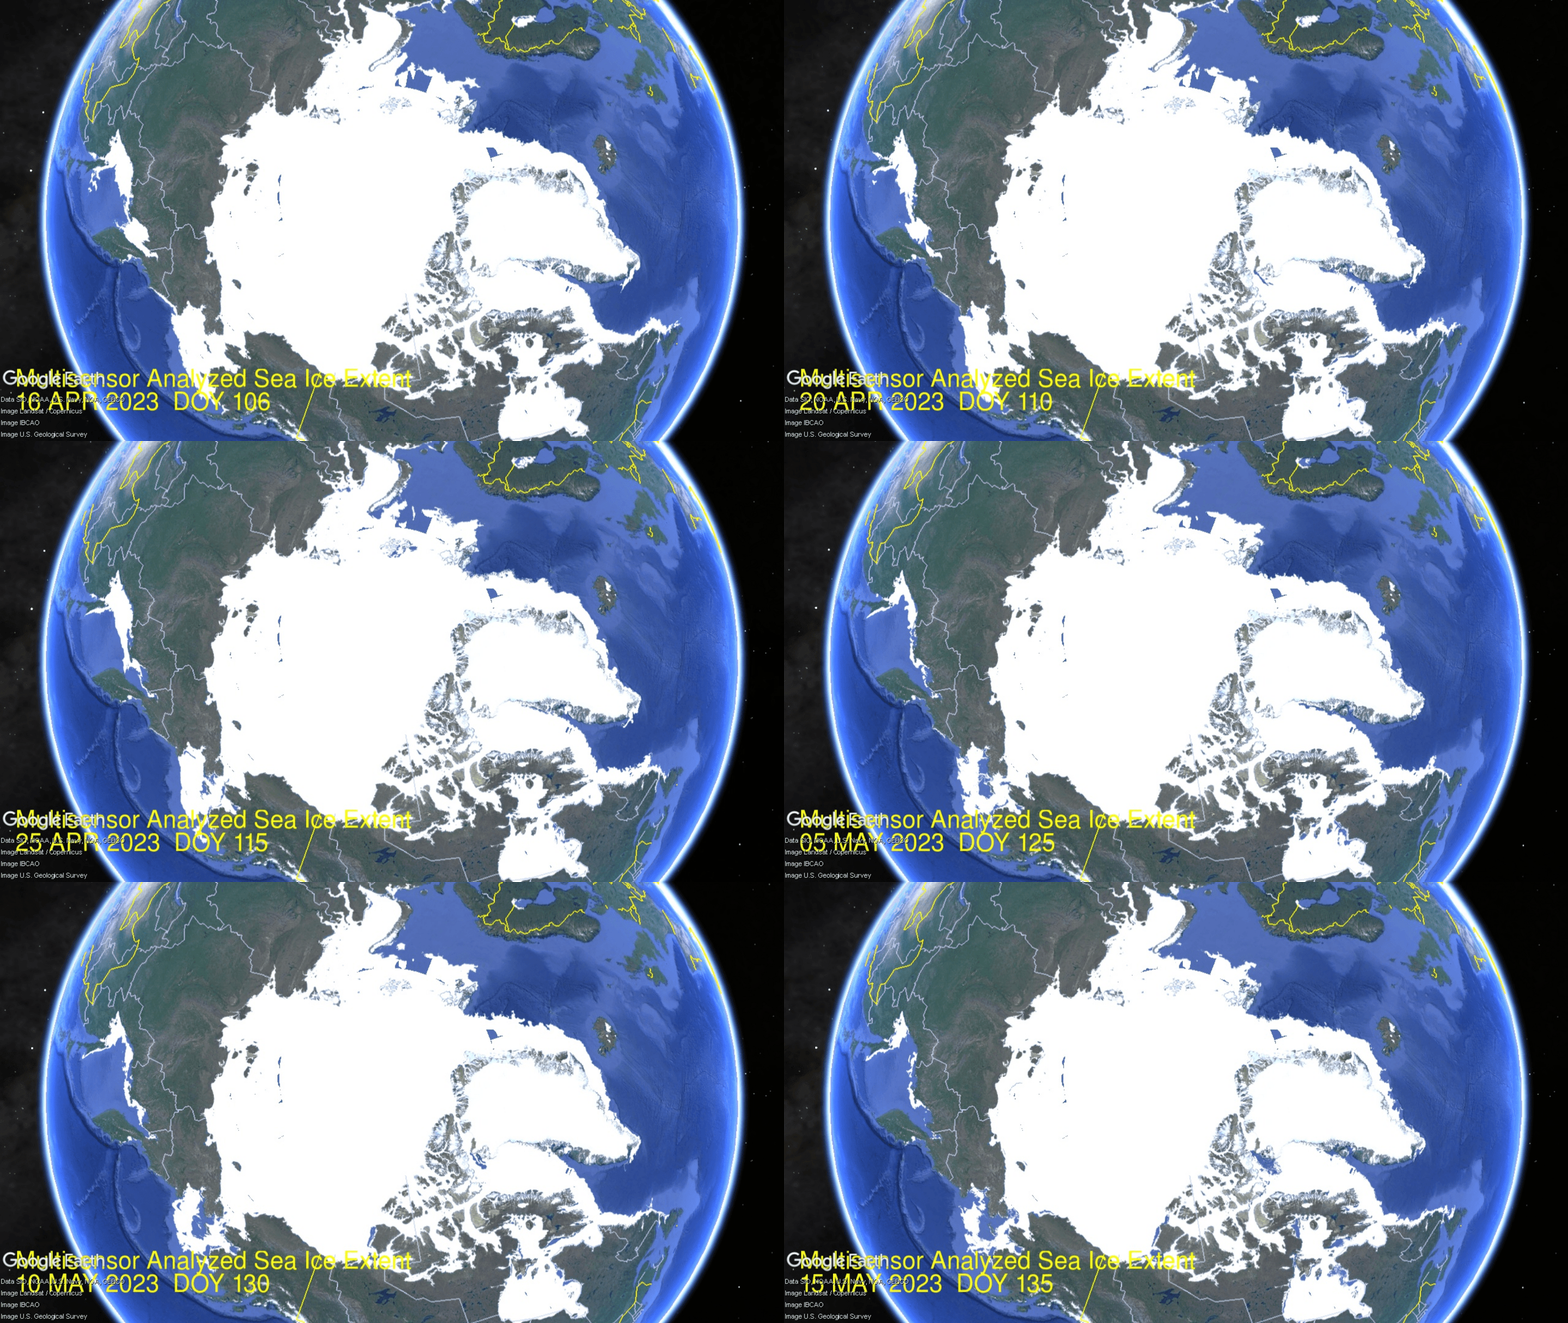
The image above shows 2023 Arctic ice extents from Mid April (day 106) to Mid May (day 135). As usual, the LIFO pattern is observed: ice that is Last In is the First Out. The Pacific basins of Okhotsk (top left) and Bering (bottom left) rapidly turn to open water. Baffin Bay (lower right) melts more slowly. Barents Sea (top center loses ice extent steadily. Note Hudson Bay (bottom) keeps its ice, and Canadian Archipelago (lower center) retains most of its ice. On the left center, the Eurasian coastline remains frozen.
The graph below shows 2023 compared to 17 year average and some recent years for this time period.
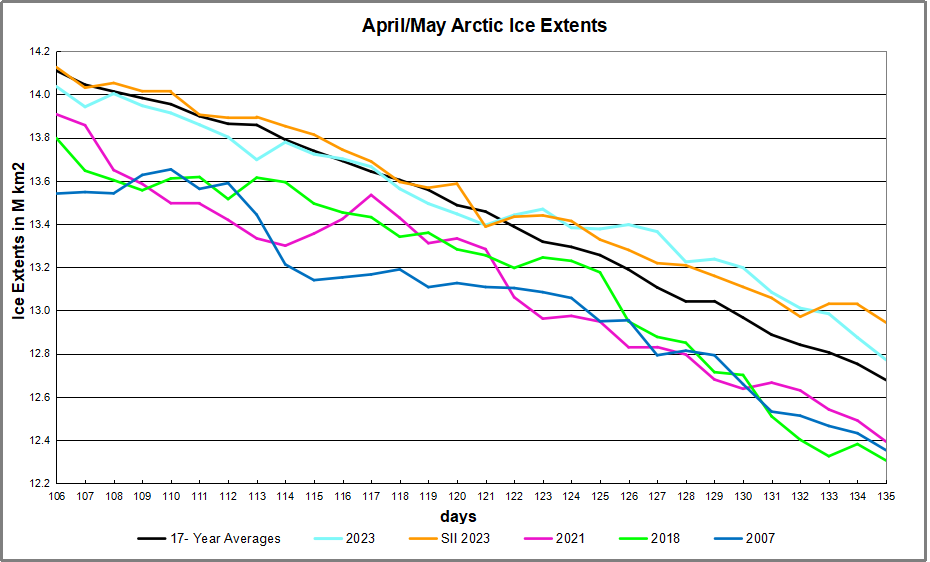
Firstly, on average this period shows ice declining 1.44 M km2 down to 12.68M km2, Note that 2023 matched the average in April, then retained more ice than usual during first two weeks of May. Sea Ice Index (SII) was close to MASIE throughout.. The other years, including 2007, were ~300k km2 lower than average.
| Region | 2023135 | Day 135 Average | 2023-Ave. | 2007135 | 2023-2007 |
| (0) Northern_Hemisphere | 12771477 | 12677903 | 93574 | 12431928 | 339549 |
| (1) Beaufort_Sea | 1050531 | 1046418 | 4113 | 1057649 | -7118 |
| (2) Chukchi_Sea | 943942 | 926464 | 17478 | 953491 | -9549 |
| (3) East_Siberian_Sea | 1085822 | 1081321 | 4501 | 1075314 | 10508 |
| (4) Laptev_Sea | 897060 | 881069 | 15991 | 828738 | 68322 |
| (5) Kara_Sea | 919027 | 879799 | 39228 | 876053 | 42974 |
| (6) Barents_Sea | 407569 | 418431 | -10862 | 351553 | 56016 |
| (7) Greenland_Sea | 730714 | 619664 | 111050 | 564865 | 165849 |
| (8) Baffin_Bay_Gulf_of_St._Lawrence | 979333 | 1076523 | -97190 | 1018780 | -39447 |
| (9) Canadian_Archipelago | 841610 | 839708 | 1902 | 830604 | 11006 |
| (10) Hudson_Bay | 1153016 | 1186552 | -33536 | 1167310 | -14294 |
| (11) Central_Arctic | 3247995 | 3223255 | 24740 | 3234305 | 13690 |
| (12) Bering_Sea | 296036 | 301878 | -5842 | 298268 | -2231 |
| (13) Baltic_Sea | 6134 | 7668 | -1534 | 6368 | -234 |
| (14) Sea_of_Okhotsk | 211027 | 186778 | 24249 | 164833 | 46194 |
The table shows the distribution of ice in the Arctic basins. The main deficits to average are Baffin and Hudson Bays, more than offset by surpluses in Kara and Greenland Seas. Most other regions are surplus with a few slightly negative.

Resources: Climate Compilation II Arctic Sea Ice

On June 14, 2023 Nicola Scafetta published at Science Direct Empirical assessment of the role of the Sun in climate change using balanced multi-proxy solar records. Excerpts in italics with my bolds with exhibits from the study.
By design, climate models exclude solar forcing of earth’s climate,
and perform poorly without it.
• The role of the Sun in climate change is hotly debated with diverse models.
• The Earth’s climate is likely influenced by the Sun through a variety of physical mechanisms.
• Balanced multi-proxy solar records were created and their climate effect assessed.
• Factors other than direct TSI forcing account for around 80% of the solar influence on the climate.
• Important solar-climate mechanisms must be investigated before developing reliable GCMs.
The role of the Sun in climate change is hotly debated. Some studies suggest its impact is significant, while others suggest it is minimal. The Intergovernmental Panel on Climate Change (IPCC) supports the latter view and suggests that nearly 100% of the observed surface warming from 1850–1900 to 2020 is due to anthropogenic emissions.
However, the IPCC’s conclusions are based solely on computer simulations made with global climate models (GCMs) forced with a total solar irradiance (TSI) record showing a low multi-decadal and secular variability. The same models also assume that the Sun affects the climate system only through radiative forcing – such as TSI – even though the climate could also be affected by other solar processes.
In this paper I propose three “balanced” multi-proxy models of total solar activity (TSA) that consider all main solar proxies proposed in scientific literature. Their optimal signature on global and sea surface temperature records is assessed together with those produced by the anthropogenic and volcanic radiative forcing functions adopted by the CMIP6 GCMs. This is done by using a basic energy balance model calibrated with a differential multi-linear regression methodology, which allows the climate system to respond to the solar input differently than to radiative forcings alone, and to evaluate the climate’s characteristic time-response as well.
The proposed methodology reproduces the results of the CMIP6 GCMs when their original forcing functions are applied under similar physical conditions, indicating that, in such a scenario, the likely range of the equilibrium climate sensitivity (ECS) could be 1.4 °C to 2.8 °C, with a mean of 2.1 °C (using the HadCRUT5 temperature record), which is compatible with the low-ECS CMIP6 GCM group.
However, if the proposed solar records are used as TSA proxies and the climatic sensitivity to them is allowed to differ from the climatic sensitivity to radiative forcings, a much greater solar impact on climate change is found, along with a significantly reduced radiative effect. In this case, the ECS is found to be 0.9-1.8 °C, with a mean of around 1.3 °C. Lower ECS ranges (up to 20%) are found using HadSST4, HadCRUT4, and HadSST3.
The result also suggests that about 80% of the solar influence on the climate may not be induced by TSI forcing alone, but rather by other Sun-climate processes (e.g., by a solar magnetic modulation of cosmic ray and other particle fluxes, and/or others), which must be thoroughly investigated and physically understood before trustworthy GCMs can be created. This result explains why empirical studies often found that the solar contribution to climate changes throughout the Holocene has been significant, whereas GCM-based studies, which only adopt radiative forcings, suggest that the Sun plays a relatively modest role. The appendix includes the proposed TSA records.
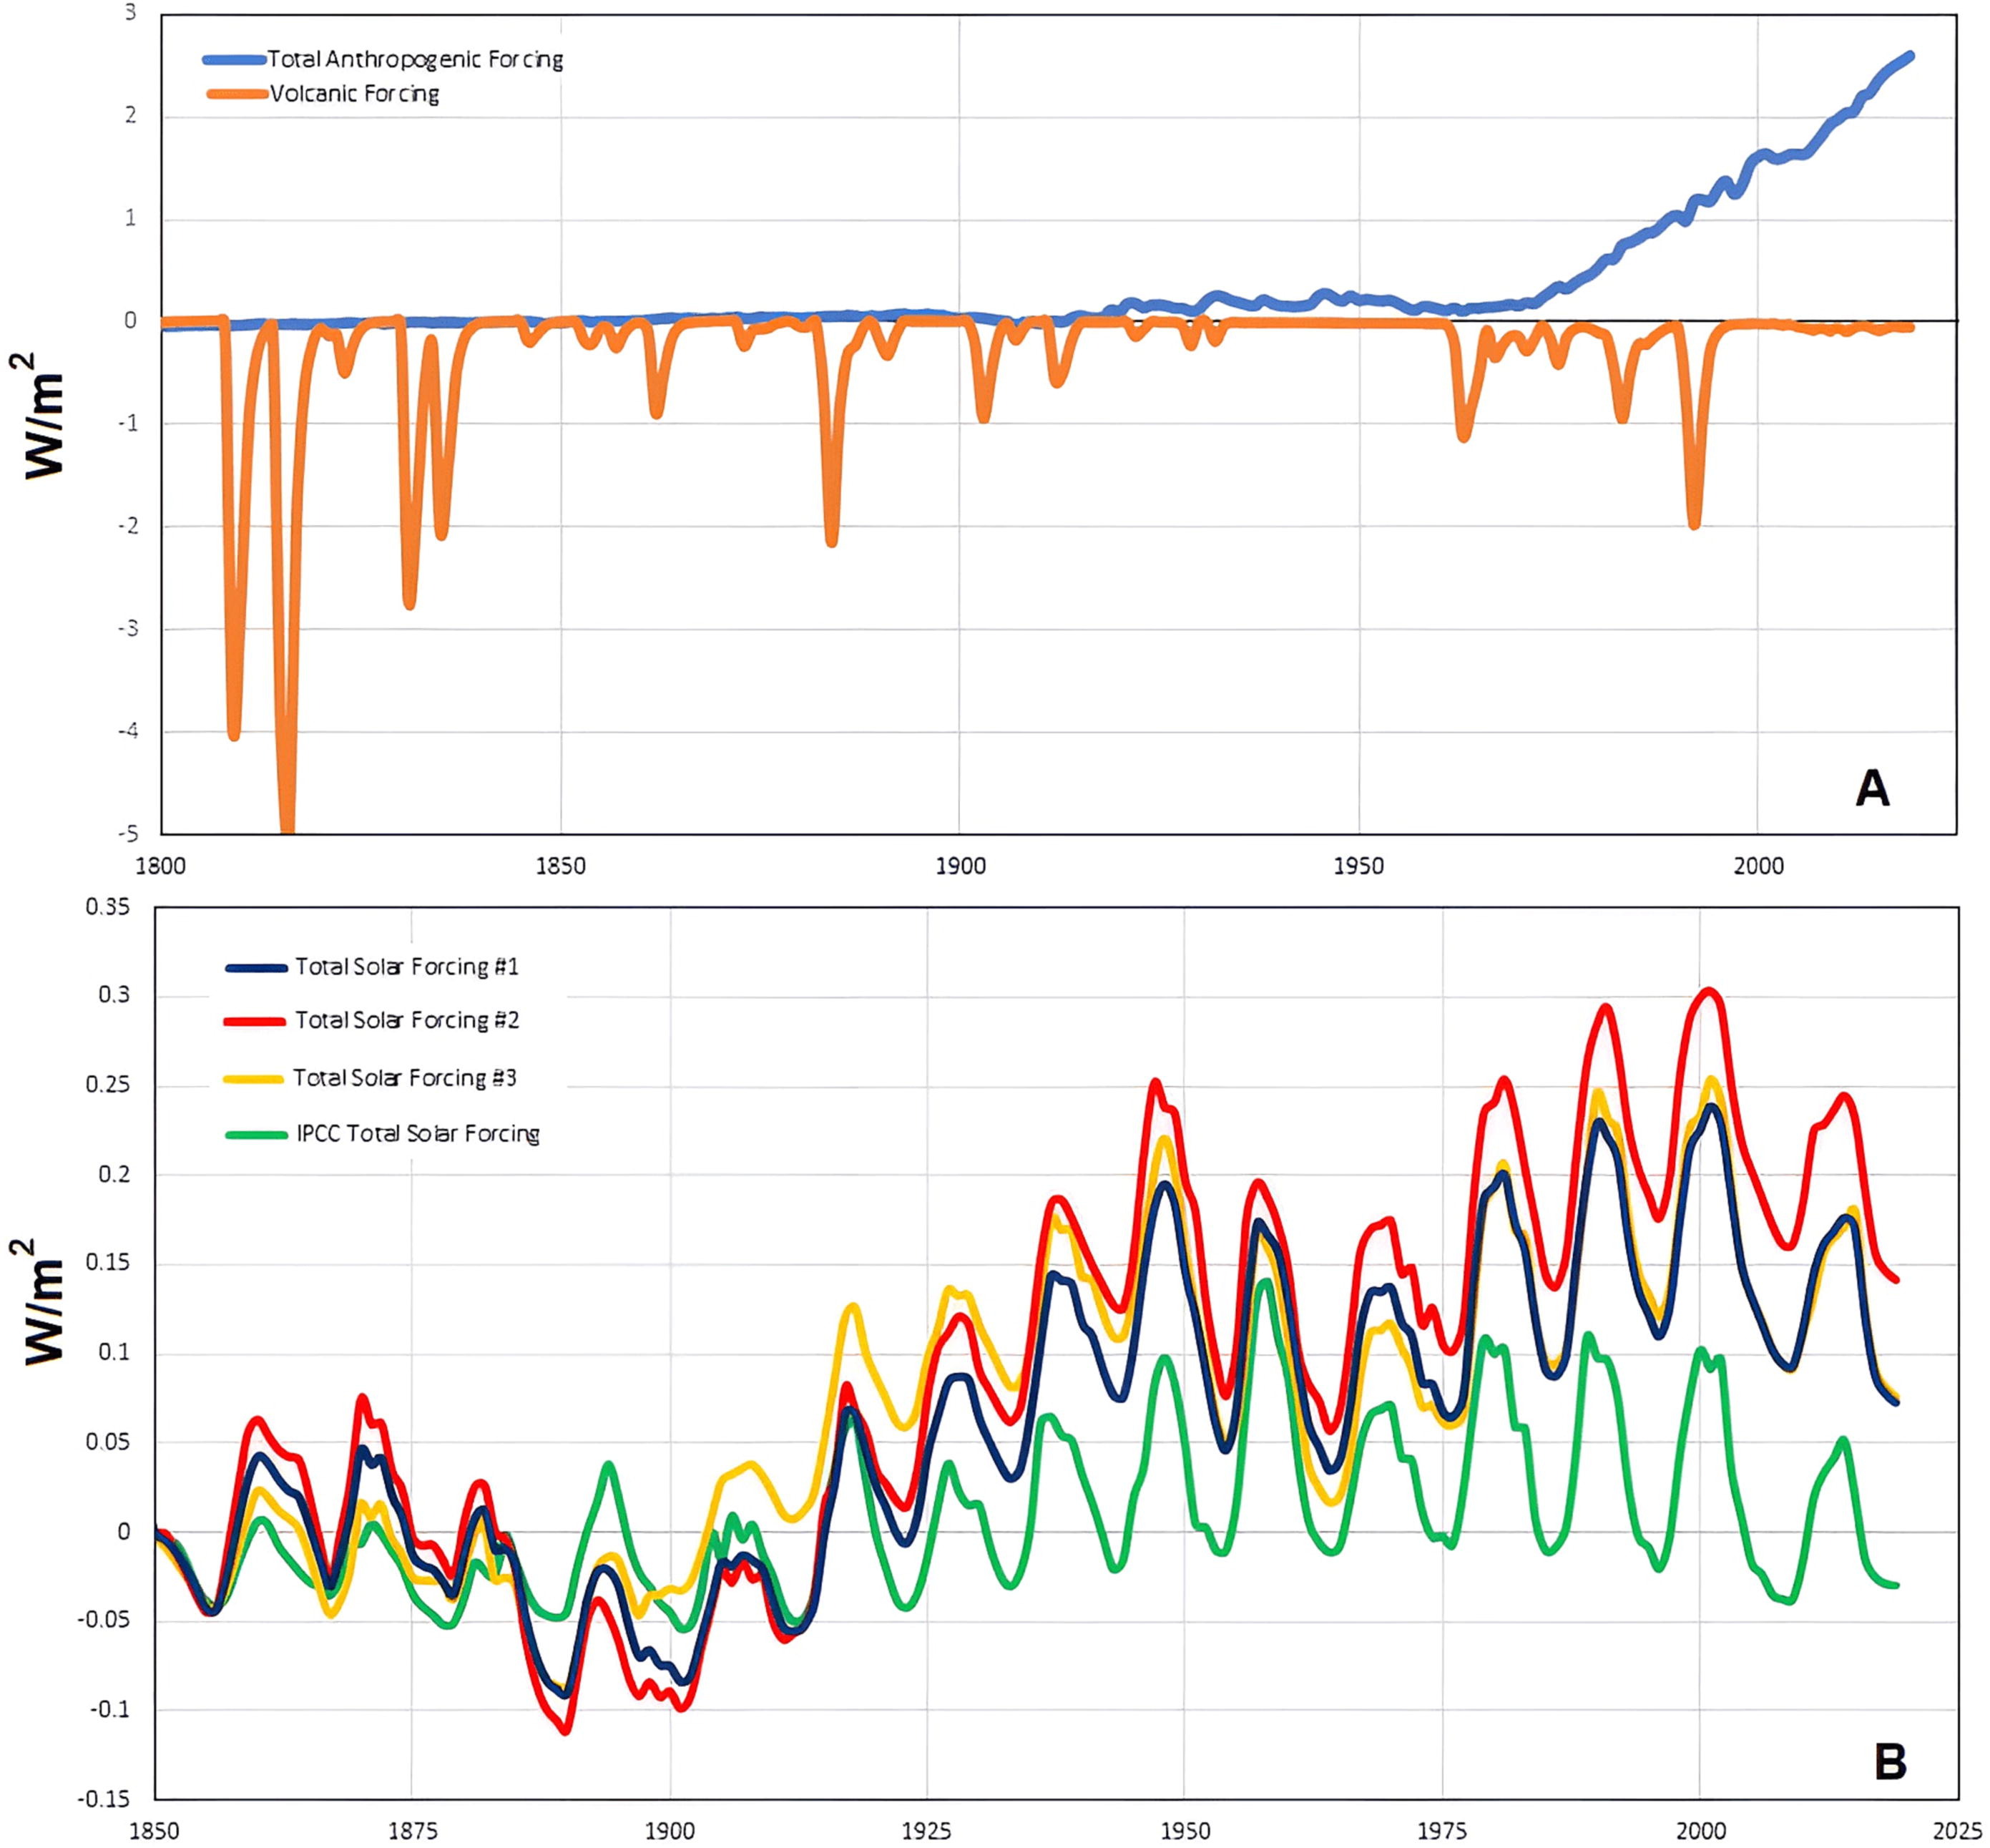
Figure 5. (A) Anthropogenic (blue) and volcanic (orange) effective radiative forcing functions adopted by the CMIP6 GCMs (Masson-Delmotte et al., 2021). (B) Comparison between the solar effective radiative forcing function from Table Annex III of the IPCC-AR6 (green) (after Masson-Delmotte et al., 2021) and the three TSI forcing functions deduced from the TSI records shown in Fig. 4. All records are anomalies relative to their values in 1850.
The solar forcing functions depicted in Fig. 5B differ in several respects. Just a very modest secular trend can be seen for the solar forcing function used by the CMIP6 GCMs, which has remained nearly constant for about 200 years. Although not depicted in Fig. 5B, the TSI forcing adopted by the CMIP6 GCMs is so flat that even the 1790–1830 Dalton grand solar minimum almost coincides with the 1890–1910 solar minimum and the 2019 solar cycle minimum (Supplementary Data Table S5). Furthermore, because this record is also based on SATIRE and the PMOD TSI satellite composite, its solar effective forcing function decreased progressively from 1970 to 2020. Thus, by using this TSI record, the CMIP6 GCMs could only conclude that solar forcing did not account for almost any of the warming observed after the pre-industrial period (1850–1900), and, particularly, from 1980 to 2020. (Masson-Delmotte et al., 2021).
On the contrary, the other three TSI records reveal a multidecadal oscillation as well as a clear increasing secular trend from the Dalton solar minimum to 2000. More specifically, the TSI forcing significantly increased from the Dalton minimum (1810–1815) to around 1870–1876, then declined until around 1890–1905; it increased rapidly between 1910 and the 1940s, and declined again between 1950 and 1975. The TSI forcing then increased again until 2000, when it began to gradually fall until 2022. This oscillating pattern is especially noteworthy because, as demonstrated below, it is closely correlated with the changes observed in total surface temperature records, which show a very similar increasing trend and multi-decadal modulation (cf.: Scafetta et al., 2004, Scafetta and West, 2006, Scafetta and West, 2008, Scafetta, 2009, Scafetta, 2010, Scafetta, 2012b, Scafetta, 2013a, Scafetta, 2021b).
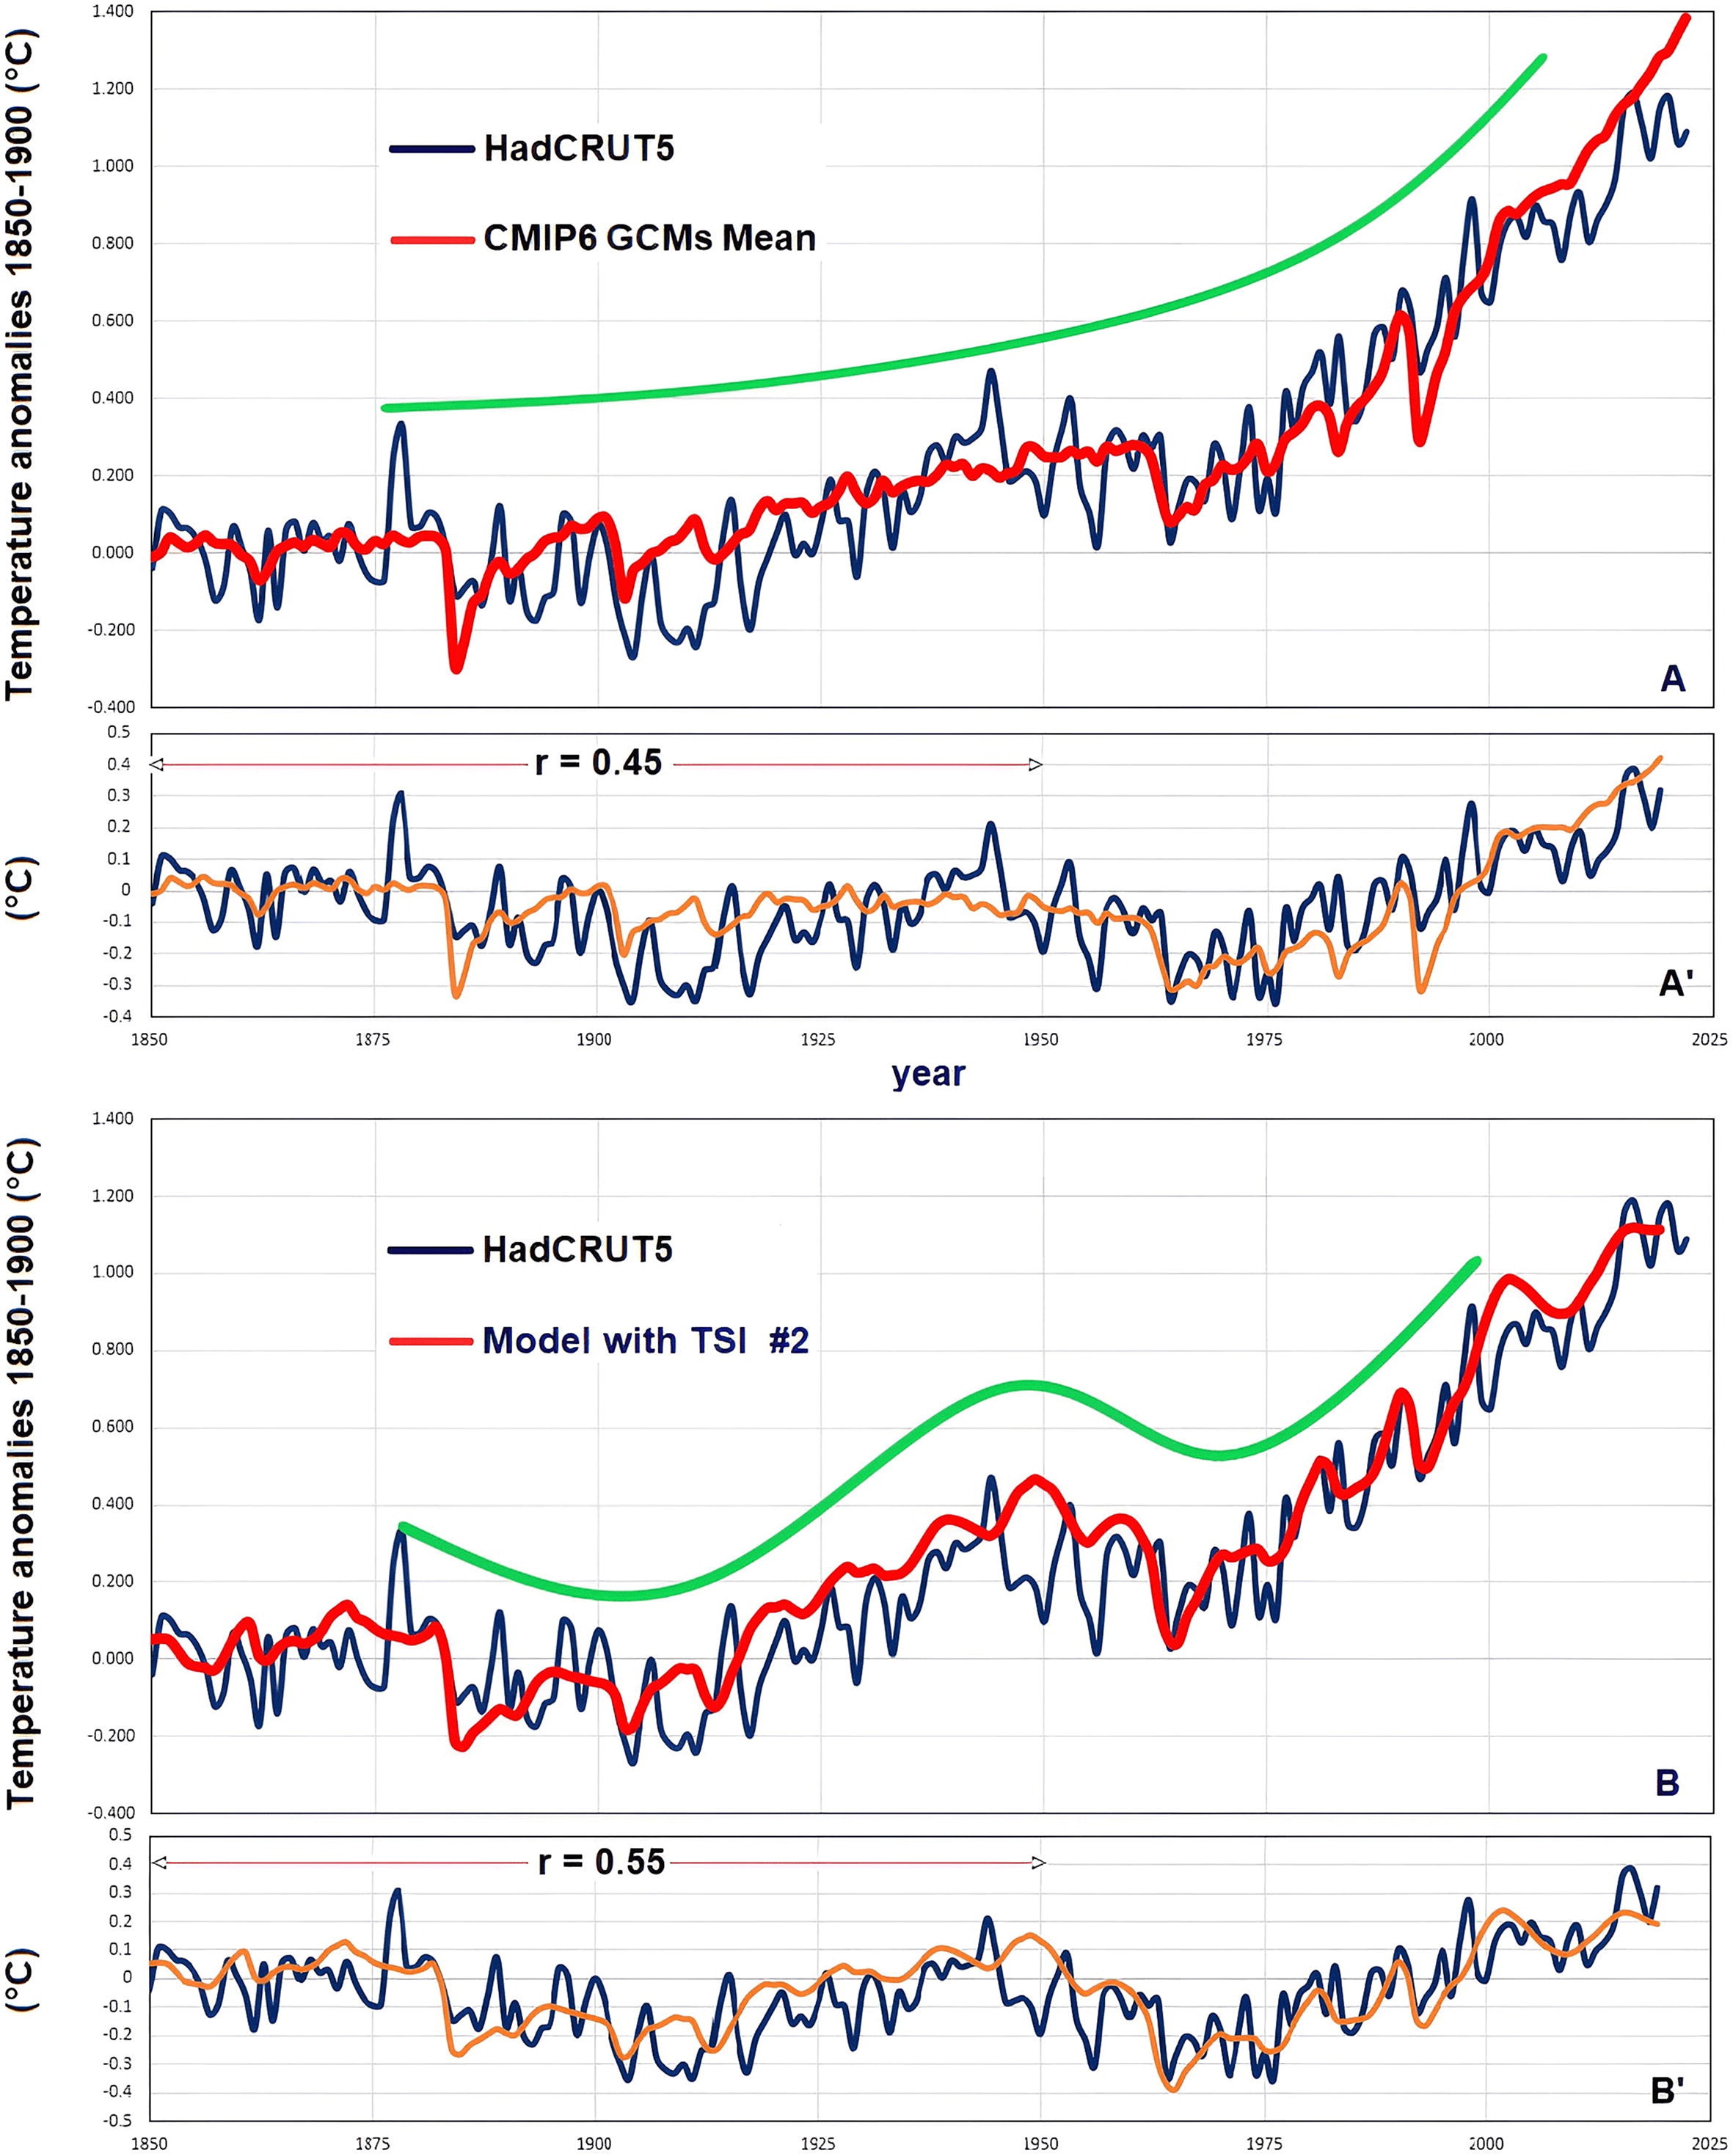
Figure 8. (A) HadCRUT5 global surface temperature versus the CMIP6 GCM ensemble average; (A’) the two records are detrended with the function f(t) = a (x-1850)2. (B) HadCRUT5 global surface temperature versus the energy balance model (Eq. (16)) using the TSI proxy model #2; (B’) the same as above. The green curves in Fig. 8A and B are sketches that highlight the different multi-decadal modulation of the red curves in Fig. 8A (monotonically increasing, like the anthropogenic forcing function) and in Fig. 8B (oscillating, like the temperature records).
Fig. 8 compares the HadCRUT5 global surface temperature record to (A) the CMIP6 GCM ensemble mean record and (B) the energy balance model (Eq. (16)) using the proposed TSI proxy model #2, which does not use the GCMs’ low secular-variability TSI record. The GCM simulation depicted in Fig.8A monotonically warms up, although occasional volcanic eruptions momentarily cause cold spikes; the monotonic warming trend produced by the model is simulated by the green curve. On the contrary, the model provided in Fig. 8B indicates an oscillating pattern developing around a warming trend. The global surface temperature record shows a similar growing trend, regulated by an approximately 60-year oscillation: the period 1880–1910 experienced a global cooling; the period 1910–1940 was characterized by considerable warming; and the period 1940–1970 experienced another global cooling. From 1880 to 1970, the model in Fig. 8B reproduces this oscillating pattern more precisely (corr. coeff. r = 0.79) than the CMIP6 GCM ensemble average simulation depicted in Fig. 8A (corr. coeff. r = 0.74). Thus, Fig. 8 illustrates that the suggested model (red curve, Fig. 8B) exhibits a multidecadal modulation that correlates significantly better with the temperature record (blue curve) than the GCM ensemble average simulation (red curve, Fig. 8A).
The different performance of the CMIP6 GCM ensemble average simulation and of the proposed regression model in reproducing the temperature pattern from 1850 to 1950 becomes more evident if a quadratic upward trend is detrended from the records. The correlation coefficient is r = 0.45 using the GCM ensemble average simulation (Fig. 8A’), and r = 0.55 using the proposed regression model (Fig. 8B’).
This result suggests that the observed multi-decadal modulation of the
temperature records could have been mostly determined by solar forcings,
and not by chaotic internal oscillations of the climate system.
The IPCC (Solomon and et al., 2007; Stocker and et al., 2014; Masson-Delmotte et al., 2021) conclusion that the Sun’s role in climate change has been negligible since the pre-industrial period (1850–1900) derives from the fact that this organization only consider the solar climatic signature produced by the present-day GCMs. These models, however, are computer programs that can only employ equations describing physical mechanisms that are already well known. Anything unknown or ambiguous cannot be included in the GCM software. If the climatic influence of neglected physical processes is significant, the reductionist approach employed in the GCMs for assessing climate change attributions may be completely inappropriate for the task.
The CMIP6 GCMs appear to greatly underestimate the Sun’s role in climate change because of two major limitations:
(i) erroneous solar forcings have likely been integrated into the models; and
(ii) TSI alone appears to likely be not the most important solar forcing.
Additional solar-magnetism related forcings and associated mechanisms are not included in the GCMs because they are currently poorly understood, despite the fact that there are several empirical indications that they might sufficiently modulate the cloud cover system (by 5% or less) to explain a significant component of the observed climatic changes (Svensmark and Friis-Christensen, 1997, Shaviv, 2002, Svensmark et al., 2016, Easterbrook, 2019, Svensmark, 2022; ). In fact, Table 1 shows that the actual climate sensitivity to TSA variations, which is expressed by kS, can be 4-7 times greater than the climate sensitivity to radiative forcing alone, which was denoted by kA.
Thus, about 80% of the solar influence on the climate could be generated
by processes other than direct TSI forcing. If this result is correct,
several solar-climate mechanisms must be thoroughly investigated
and fully understood before reliable GCMs can be developed.
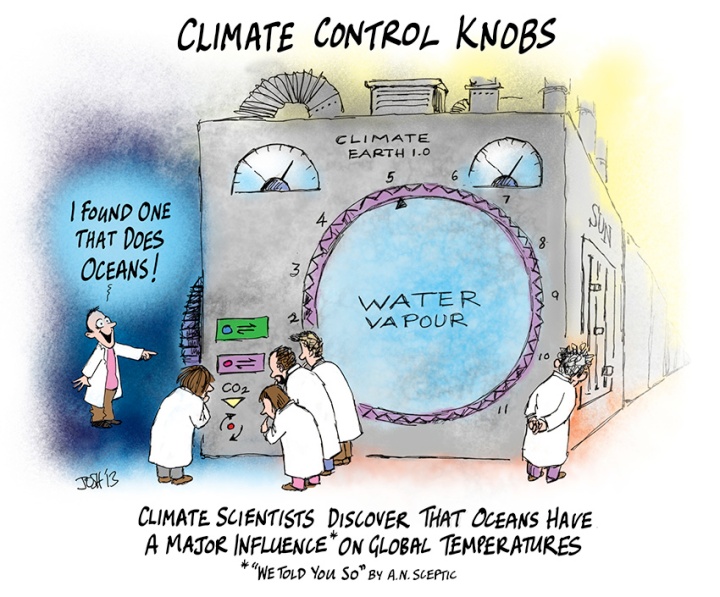
A complement to Scafetta’s study is a Quadrant article by Mark Imisides explaining the geophysical realities ruling out global warming from CO2. DIY ocean heating (Hint: It’s the water, isn’t it?) Excerpts in italics with my bolds.
Scarcely a day goes by without us being warned of coastal inundation by rising seas due to global warming.
Carbon dioxide, we are told, traps heat that has been irradiated by the oceans,
and this warms the oceans and melts the polar ice caps.
While this seems a plausible proposition at first glance, when one actually examines it closely a major flaw emerges. In a nutshell, water takes a lot of energy to heat up, and air doesn’t contain much. In fact, on a volume/volume basis, the ratio of heat capacities is about 3300 to 1.
This means that to heat 1 litre of water by 1˚C it would take 3300 litres of air
that was 2˚C hotter, or 1 litre of air that was about 3300˚C hotter!
This shouldn’t surprise anyone. If you ran a cold bath and then tried to heat it by putting a dozen heaters in the room, does anyone believe that the water would ever get hot?
The problem gets even stickier when you consider the size of the ocean.
Basically, there is too much water and not enough air.
The ocean contains a colossal 1,500,000,000,000,000,000,000 litres of water! To heat it, even by a small amount, takes a staggering amount of energy. To heat it by a mere 1˚C, for example, an astonishing 6,000,000,000,000,000,000,000,000 joules of energy are required.
Let’s put this amount of energy in perspective. If we all turned off all our appliances and went and lived in caves, and then devoted every coal, nuclear, gas, hydro, wind and solar power plant to just heating the ocean, it would take a breathtaking 32,000 years to heat the ocean by just this 1˚C!
In short, our influence on our climate, even if we really tried, is miniscule!
So it makes sense to ask the question – if the ocean were to be heated by greenhouse warming of the atmosphere, how hot would the air have to get? If the entire ocean is heated by 1˚C, how much would the air have to be heated by to contain enough heat to do the job?
Well, unfortunately for every ton of water there is only a kilogram of air. Taking into account the relative heat capacities and absolute masses, we arrive at the astonishing figure of 4,000˚C.
That is, if we wanted to heat the entire ocean by 1˚C,
and wanted to do it by heating the air above it,
we’d have to heat the air to about 4,000˚C hotter than the water.
And another problem is that air sits on top of water – how would hot air heat deep into the ocean? Even if the surface warmed, the warm water would just sit on top of the cold water.
Thus, if the ocean were being heated by greenhouse heating of the air, we would see a system with enormous thermal lag – for the ocean to be only slightly warmer, the land would have to be substantially warmer, and the air much, much warmer (to create the temperature gradient that would facilitate the transfer of heat from the air to the water).
Therefore any measurable warmth in the ocean would be accompanied by a huge and obvious anomaly in the air temperatures, and we would not have to bother looking at ocean temperatures at all.
So if the air doesn’t contain enough energy to heat
the oceans or melt the ice caps, what does?
The earth is tilted on its axis, and this gives us our seasons. When the southern hemisphere is tilted towards the sun, we have more direct sunlight and more of it (longer days). When it is tilted away from the sun, we have less direct sunlight and less of it (shorter days).
The direct result of this is that in summer it is hot and in winter it is cold. In winter we run the heaters in our cars, and in summer the air conditioners. In winter the polar caps freeze over and in summer 60-70% of them melt (about ten million square kilometres). In summer the water is warmer and winter it is cooler (ask any surfer).
All of these changes are directly determined
by the amount of sunlight that we get.
When the clouds clear and bathe us in sunlight, we don’t take off our jumper because of greenhouse heating of the atmosphere, but because of the direct heat caused by the sunlight on our body. The sun’s influence is direct, obvious, and instantaneous.
If the enormous influence of the sun on our climate is so obvious, then, by what act of madness do we look at a variation of a fraction of a percent in any of these variables, and not look to the sun as the cause?
Why on earth (pun intended) do we attribute any heating of the oceans to carbon dioxide, when there is a far more obvious culprit, and when such a straightforward examination of the thermodynamics render it impossible.

Scott Yenor provides a framework to understand the present and real battle for the soul of America, not to mention other western democracies. His American Greatness article is Conservatives and Our Queer Constitution, an excerpt from his book on the subject. Article excerpts in italics with my bolds and added images.
Every country has a sexual constitution: a set of laws and opinions, which use shame and honor to shape and guide sexuality. The old marital constitution was, shall we say, the Straight Constitution, which honored enduring, monogamous, man-woman, and hence procreative marriage. It also stigmatized alternatives. This Straight Constitution upheld a vision of marriage that, among other things, limited divorce and proscribed fornication, contraception, sodomy, and adultery, promoted a family wage (under some circumstances), and imagined marriage for the purposes of procreation and educating offspring. We lived under the Straight Constitution until roughly the 1970s.

That constitution no longer exists, or perhaps just barely.
We currently live under the Queer Constitution, which claims
to—and in fact does—reject the Straight Constitution.
The Queer Constitution was developed by winning legal battles in the service of broader cultural recognition of what once were called alternative lifestyles. It moved from gay rights in the 1970s, to proclaiming “Gay Pride” a virtue in the 1990s, to a legal recognition of the constitutional right to sodomy in the early 2000s, to making the Boy Scouts and the U.S. military accept homosexuals, to constitutionalizing same-sex marriage in the 2010s, to protecting gender identity under the civil rights laws in the 2020s, to practically banning intellectual and legal opposition to the Queer Constitution on speech platforms.

Some conservatives fought these changes. Nonetheless, nearly all acquiesced to them serially—fighting against new extensions while accepting their previous defeats. Rarely have conservatives acted as if the future of practices encouraged under the Straight Constitution—with its manner of directing passions and ordering loves—depended on reversing efforts to queer our sexual constitution.
At the Queer Constitution’s core are two ideas:
First, that all sexual behaviors, if consensual, are equal and dignified.
Second, that society’s binary, heteronormative gender identity is an iron cage, hampering individual expression and happiness.

The Queer Constitution honors all manner of sex. Laws restricting contraception, sodomy, and fornication are, by its lights, unconstitutional. These changes in law are but the first part of an effort to normalize and then celebrate premarital sex, recreational sex, men who have sex with men, childhood immodesty, masturbation, lesbianism, and all conceptions of transgenderism.
The live-and-let-live attitude, hoped for by conservatives and
promised by revolutionaries, cannot in principle hold.
Indeed, the move from legal tolerance to public celebration is perfectly logical. Human beings are social and political animals. Many parts of their lives take place in private, but society nevertheless recognizes and applauds public manifestations of private acts. Under the Straight Constitution, no one watches a husband and wife having sex, but the public celebrates their weddings and their births, and the public recognizes their common property. Weddings themselves are a recognition of the importance of the marriage for the couple and for society as such.
Advocates of the Queer Constitution wanted and needed
such public affirmation for their private acts.
From the private protection or tolerance of “gay rights,” advocates moved on to taking pride in “coming out of the closet.” Failure to show a similar pride is a public insult, punishable through social opprobrium, as violations of hate speech codes, or worse. Advocates sought and won legal recognition for same-sex marriage, visitation rights for same-sex partners, and the right to adopt children, but they did not stop at such a legal infrastructure. That is because the Queer Constitution demands public celebration of queerness. School curricula must be queered, the better to educate children before“homophobia” sets in. Men dressed as sexualized women must read children’s books to children in public libraries, lest they grow up to think transgenderism is abnormal. “Love makes the family”—rather than a mother and a father—must become the morality of every generation. Christian bakers must be made to bake the wedding cake for gay couples, lest failure to bake the cake insult the gay couple.

As to the next frontiers: strictures against adult sex with children are being “problematized” and are now eroding. Calls to lower the age of consent and to embrace pedophilia chic are beginning, including among politicians. Incest taboos are already being subjected to critical questions. “Live and let live” turns into “comply or else.”

Many pro-family activists pretend dishes of the Queer Constitution
can be accepted à la carte without ordering the whole Queer menu.
Beyond the law and public morality, the Queer Constitution rules in the scientific professions, our major corporations, our education system, the Boy Scouts, the American military, and countless other commanding heights in our culture and within our families. Even churches openly support it. What had been considered bad under the Straight Constitution must now be considered good under the Queer Constitution, and vice versa. Many conservatives refused to see the Queer Constitution as the Left’s imperial project, one aimed at subverting and dishonoring the Straight Constitution. Now this imperial project has gone international.
Conservatives can no longer indulge in libertarian fantasies.
Peaceful coexistence between a queer and a straight constitution is not sustainable.

At its deepest level, the Queer Constitution elevates sexual pleasure and sexual self-expression as the goods of adults that have a dominant hold on the human heart, instead of procreation, familial duties, and parental responsibility. One’s sexual identity becomes who one is. Expressing sex in whatever way becomes a crucial right. All eros becomes sexual eros. Dealing with the consequences of sex—including, most crucially, children—becomes someone else’s problem or not a problem at all, since there are fewer kids.

In contrast, under the Straight Constitution, sex is something one does, not who one is. Life under this constitution encourages individuals to make sex serve something higher, like the duties of parenthood or finding its place within a marital regime. When people are taught that sex is who they are, they are less likely to see beyond sex to higher duties.
The duties associated with marriage and parenthood necessarily
wither as the Straight Constitution shapes fewer and fewer lives.

This social contagion has profound effects on individual happiness and social health. Indeed, sexual constitutions do not create human desires, but they play a large part in shaping them. Like a command-and-control economy, our reengineered ways work poorly, damaging men and women. Suicide rates and rates of drug abuse have spiked. People are more and more medicated. Health crises proliferate, depending on the lifestyle. Life expectancy sinks. A sense of personal mission, centered on family life, fades, and with it fades human ambition and purpose. Children mutilate themselves, at parental, medical, or teacher suggestion. Damage to transgender children is irreversible. Society as a whole is less happy, less trusting, less confident.

A rejuvenated conservatism would recognize, as did leftist activists a generation ago, that easygoing coexistence between a decent Straight Constitution and the Queer Constitution is not possible. As a result, the family must be self-consciously repoliticized. Given the centrality of politics, as the New Right appreciates, the Queer Constitution must be rejected root and branch and replaced with a new Straight Constitution, duly changed for our circumstances, supporting man-woman marriage, enduring marriage, procreative sex, and parental responsibility. From the perspective of the New Right, the Old Right may have hoped to achieve the goal of a decent family life, but the Old Right did not will the means to achieve it.
The Old Right is correct in seeing that nature provides materials from which decent family life might arise, but the manner of guiding nature is crucial. The queer revolutionaries long ago recognized that sexual passions and priorities could be bent away from enduring marriage—and they built a queering ethic to accomplish it. The New Right must work with the building blocks of nature, but it must also show that our Queer Constitution is a source of misery and social decline, and that a new Straight Constitution is more humane, fosters happiness, and creates an enduring social fabric with lasting man-woman marriage at its heart.

What are these natural building blocks? Differences between men and women are natural. It is a natural fact that only man-woman sex can produce children. Sexual impulses are natural in the sense that they are spontaneous; and they are mostly, absent a countervailing cultural tendency, toward man-woman relations. Men and women in the main have crucially different psychologies, fitting them for life together and raising kids and reflecting something like checks and balances. Childhood is naturally a state of helplessness for human beings. The family, like the sex integrated into it, is based in nature but it is always mediated by laws. A decent sexual constitution would take all these facts into account, while pointing to better, sturdier relations to make them serve human happiness, personal excellence, and the social good.
The Old Right could not conserve a decent society, though many knew the stakes. Eventually conservatives compromised, hoping for the best, which resulted in the step-by-step adoption of the Queer Constitution. Perhaps they could do no different, given the class arrangements of our new managerial elite. Becoming elite meant acquiescing in the Sexual Revolution. Resisting that revolution meant irrelevance. But this bargain is up: conservatives are now outside the ruling classes and inconsequential. For society, embracing the Queer Constitution combines the costs of having weak, adult-focused marriage customs with all the costs associated directly with this constitution. The result has been individual misery, social decline, and a barren future. The perversities will keep mounting, as advocates for the Queer Constitution are clearly coming for the children, a fact they themselves now openly admit.
All civilizational founders recognized the importance of promoting a straight constitution and stigmatizing its alternatives. The New Right must follow the deep wisdom of such founders where it leads. Only a return to an uncompromising Straight Constitution can reverse our decline.

 Science Matters