Bering Ice is Back!

Remarkable growth of ice in Bering Sea has been observed over the last three weeks as shown above. The extent went from 57k km2 to 424k km2 during that period, and is presently 94% of the maximum Bering ice extent in March 2018. To put this event in context, note that Bering 2018 maximum was low and pulled down the overall Arctic extent in March. For example, 2017 Bering maximum was 725k km2 compared to 2018 max of 451k km2, or a difference of 48%. We will be watching to see how much will be added in the coming 3 months.
Note also that Chukchi north of Bering completed freezing over on day 352, December 18, 2018. We can also see that Okhotsk on the left was freezing at the same rate as Bering, but added no new ice in the last week.
The Bering ice recovery coincides with the demise of the North Pacific “Warm Blob” as reported by Cliff Mass on Dec. 24 Sad News: No More BLOB Excerpts in italics with my bolds.
Starting the autumn, the BLOB was relatively weak. To illustrate, here is the sea surface temperature anomaly (difference from normal) for the end of October–as much as 2-3C warmer than normal! This was associated with an area of persistent high pressure over the northeast Pacific.
But compare that situation to two days ago. The BLOB is essentially gone, with an area of cooler than normal water developing. Only immediately along the coast is the water temperature slightly above normal.
What killed the BLOB? Persistent storminess over the northeast Pacific, something that is no surprise to the storm-battered residents of the Pacific Northwest.
Outlook from Dr. Judah Cohen Dec. 24, 2018 at Arctic Oscillation and Polar Vortex Analysis and Forecasts
In conclusion there is still much uncertainty with the predicted PV disruption and the longer it takes for the PV disruption to unfold the longer it will take for any impacts to reach the surface. And I would argue it makes very important differences on the sensible weather whether the PV splits, and if it splits the duration and the location of the sister vortices. But a robust PV split increases the likelihood of severe winter weather in the near term and more so long term for both the Eastern US and Europe. Also expect ongoing model forecast volatility until the circulation anomalies associated with the PV disruption reaches the tropopause as we argue in my most recent paper Cohen et al. 2018.
One last thing that I feel may play an important role on the NH circulation are sea ice anomalies. For months I have been anticipating that the greatest sea ice anomalies this winter will be in the Barents-Kara Seas. That is quite apparent in today’s Figure 15. Typically blocking is focused across Greenland following a PV disruption. But abundant sea ice near Greenland and the lack of sea ice in the Barents-Kara Seas may help focus future high latitude blocking closer to Europe this winter. Strong Scandinavian/Barents-Kara Seas blocking may favor an eastward shift of the cold air across Europe. Cold air may drain into Eastern Europe but be blocked from Western Europe.
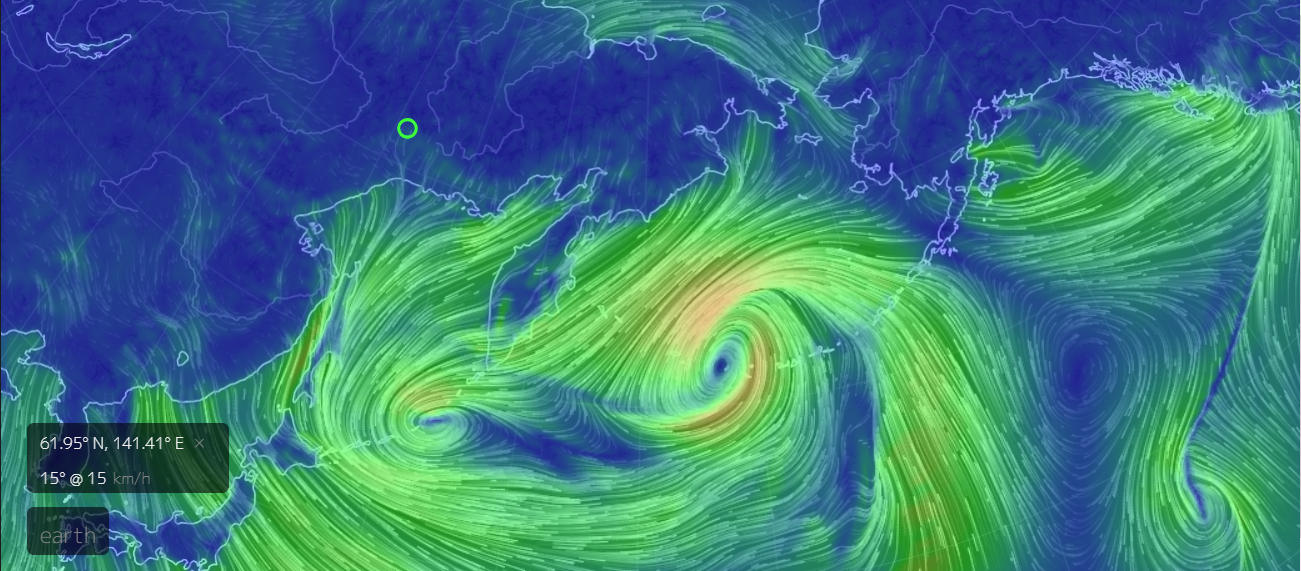
Finally, today from nullschool we can see the North Pacific twin gyres at work:
Summary
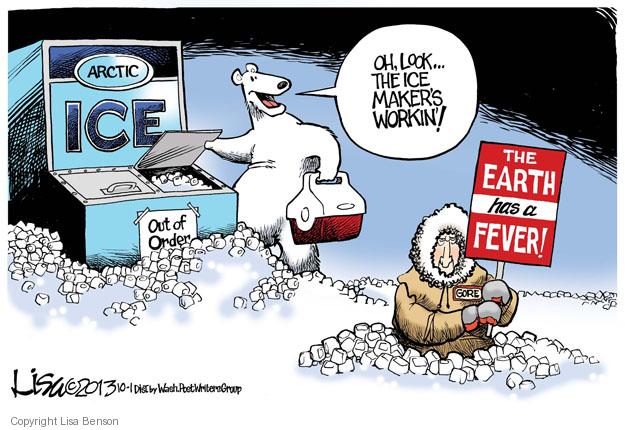
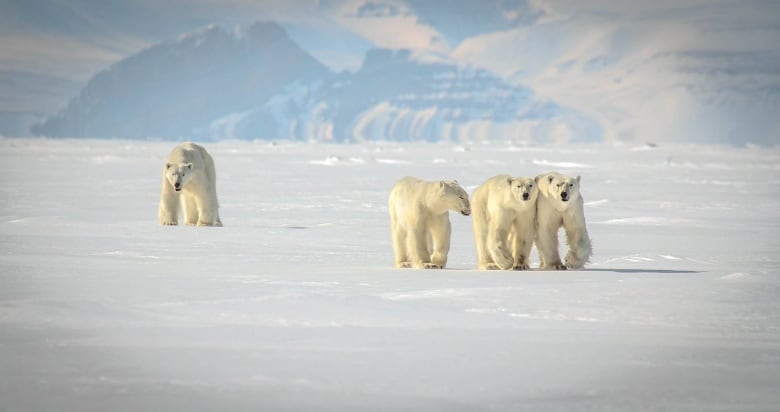
Several Alaskan kids are in the group suing the US government over fears of Arctic warming. It’s looking like they may get relief from nature before it can come from the courts.
 Eleven Days in Pacific Arctic are shown in the above animation. In the upper center, Chukchi finally froze completely, adding 260k km2 of ice to reach 99.8% of maximum. (Disregard the blue jagged arc as a sensor artifact.) Meanwhile, serious freezing began in the two Pacific basins. Bering to the south of Chukchi went from 57k km2 to 195k, now 43% of maximum. Okhotsk to the left went from 58k km2 to 223k, now 19% of maximum.
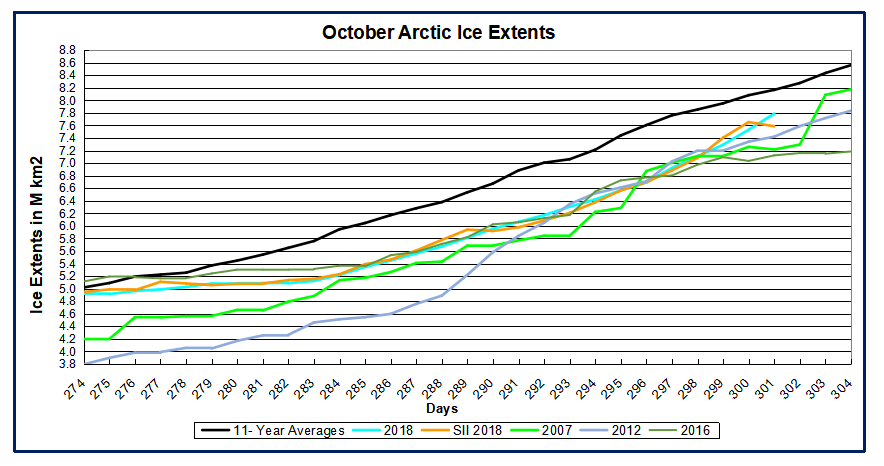
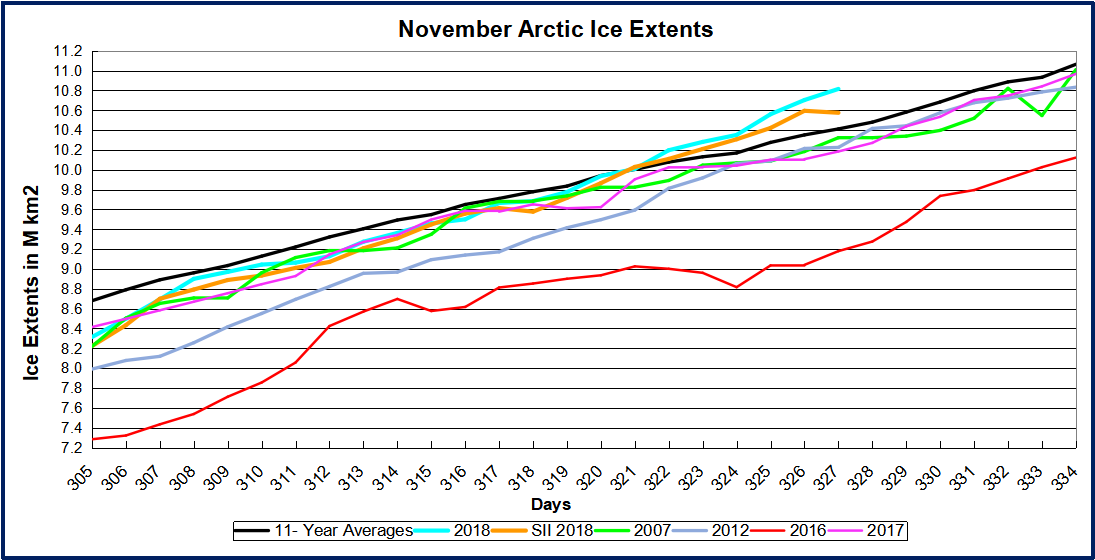
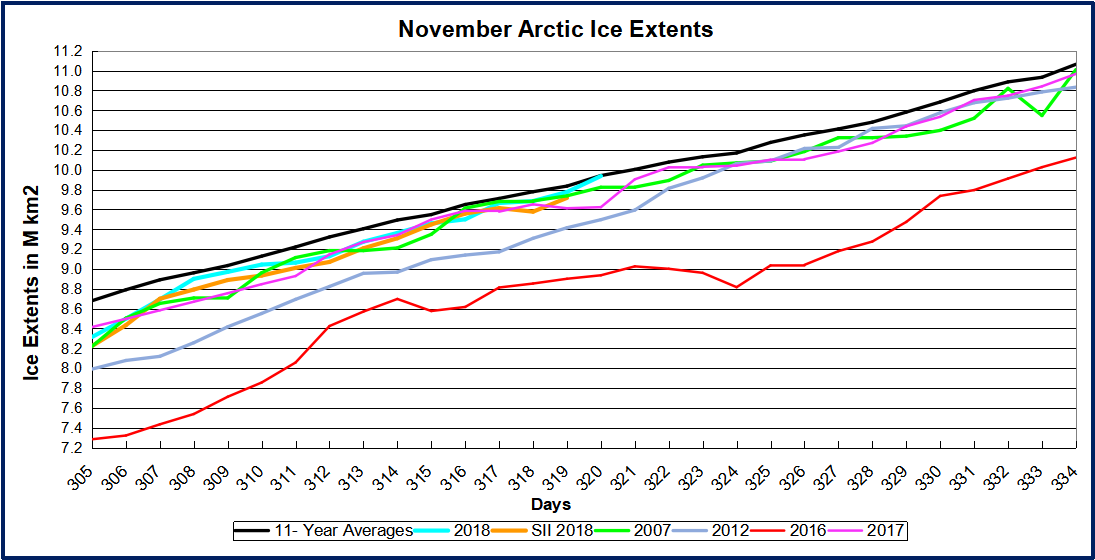
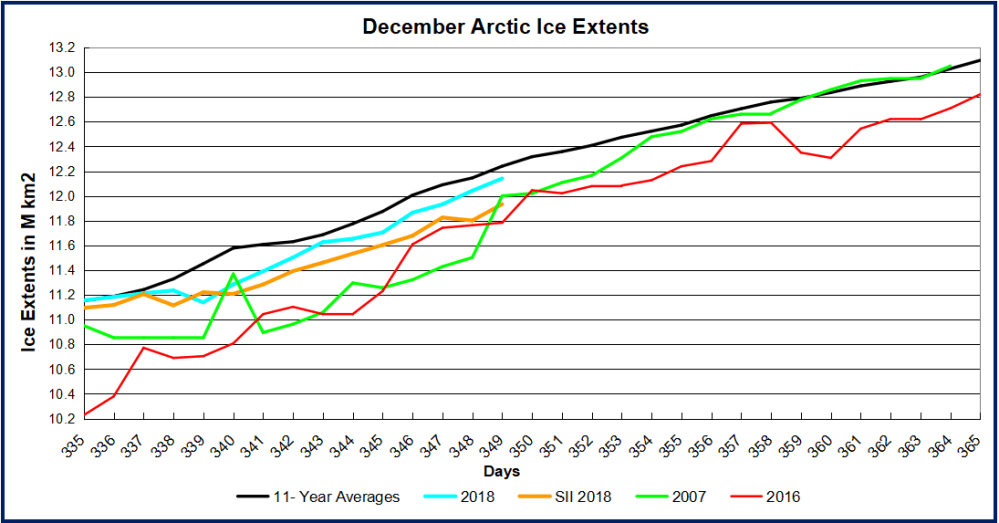 From days 335 to 339, 2018 extents were flat and went below average. Now freezing has resumed as shown in the animation above and tracking close to average again in the graph. At day 349 (Dec. 15) MASIE shows 2018 1 day behind average (100k km2), 200k km2 greater than SII 2018, 140k km2 greater than 2007 and 358k km2 more than 2016.
 Seventeen Days in Hudson Bay are shown in the above animation. In the lower center, Hudson Bay pushed its ice extent up to 1.24M km2, 98% of maximum. Just to the northeast, Hudson Strait and Ungava Bay are completely frozen over, with Baffin Bay reaching down. At the top left you can see Chukchi Sea growing ice toward Bering Strait.
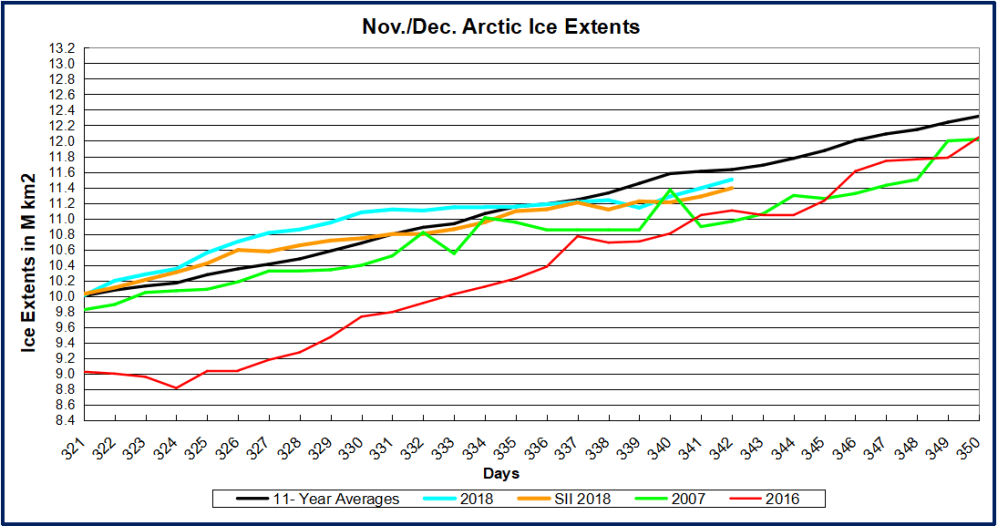 From days 330 to 339, 2018 extents were flat and went below average. Now freezing has resumed as shown in the animation above and nearing average again in the graph. At day 342 (Dec. 8) 2018 is 540k km2 greater than 2007 and 400k km2 more than 2016.
 Eighteen Days in Hudson Bay are shown in the above animation. In the lower center, Hudson Bay more than doubled its ice extent up to 1.07M km2, 85% of maximum. Just to the northeast, Hudson Strait and Ungava Bay are almost frozen over, with Baffin Bay reaching down. At the top right you can see Greenland Sea ice reaching out toward Iceland.

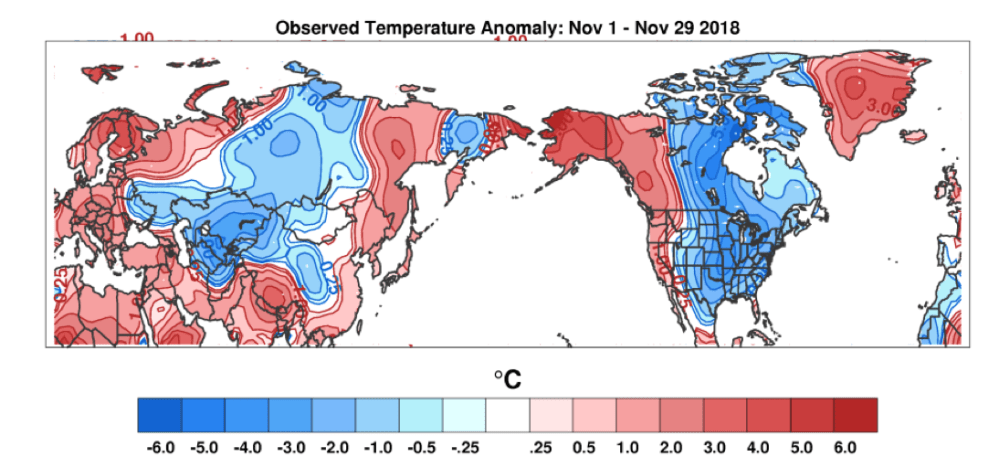


 Big Chill in last Two Weeks
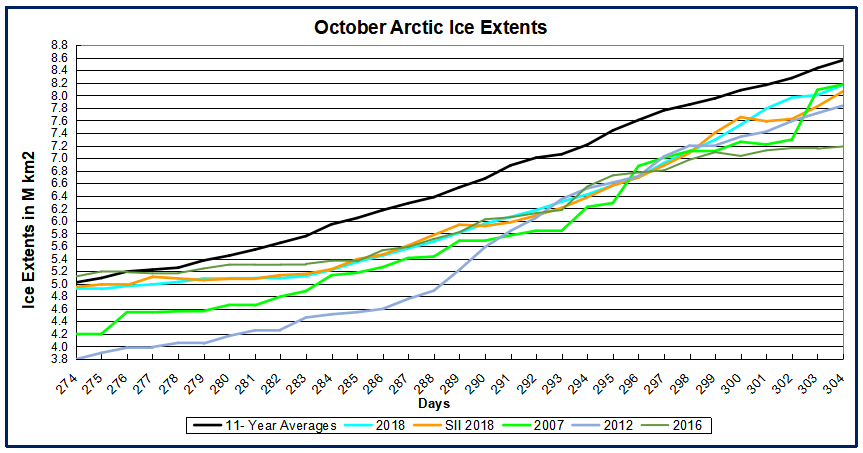

 Siberian Big Chill in last Ten days