Big Asian Chill Pushes Arctic Ice Over 15 Wadhams
For ice extent in the Arctic, the bar is set at 15M km2. The highest daily average in the last 18 years occurs on day 61 at 15.08M before descending. Most years are able to clear 15M, but in recent previous years, 2017, 2018, 2019 and 2021 ice extents failed to clear the bar at 15M km2. On February 11, 2024 (day 42) Arctic ice extent already leaped over that bar 20 days early. Then extent dropped for several days, but has again topped 15 Wadhams with ice in Asian basins contributing greatly.
The animation shows Pacific ice growth in the last week. Bering Sea on the right changed little, while Okhotsk in the center added ice down to N. Japan, and now well above 2023 March maximum. The ice patch in far left is the harbor close to Beijing where the Yellow Sea added 20K km2 ice extent in two days.
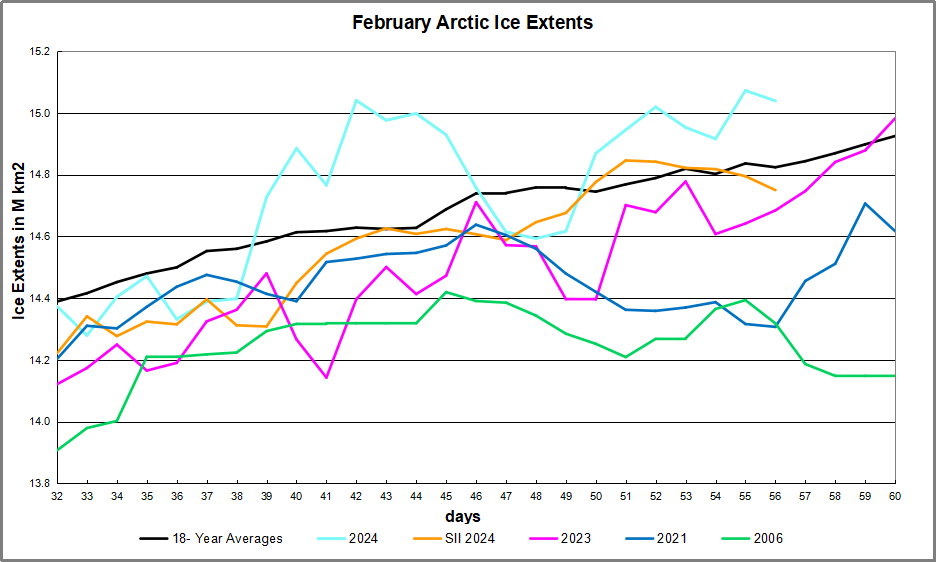
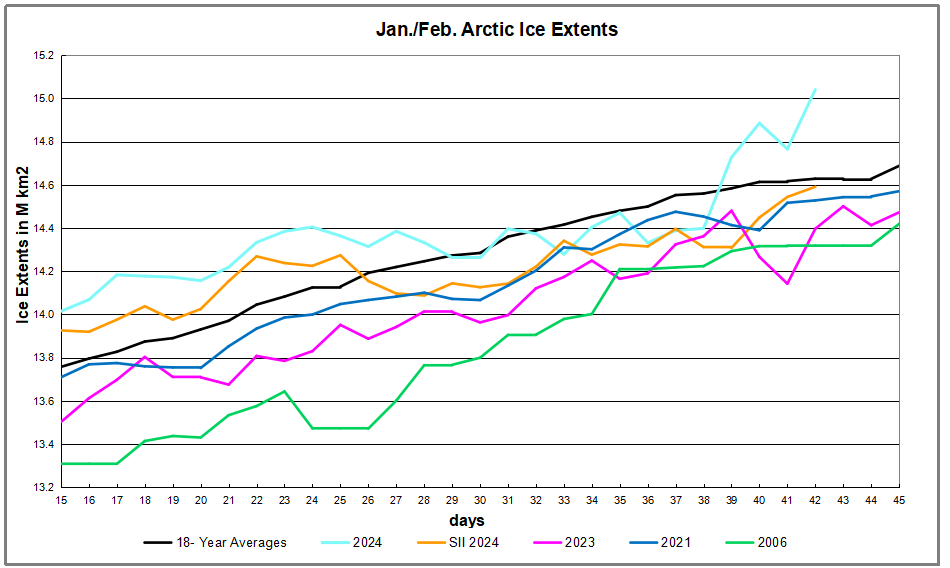
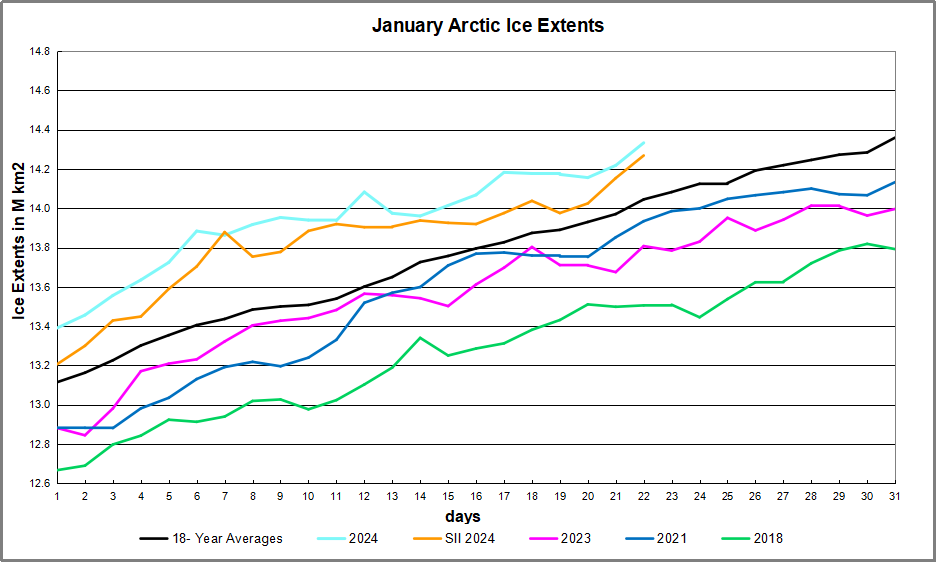
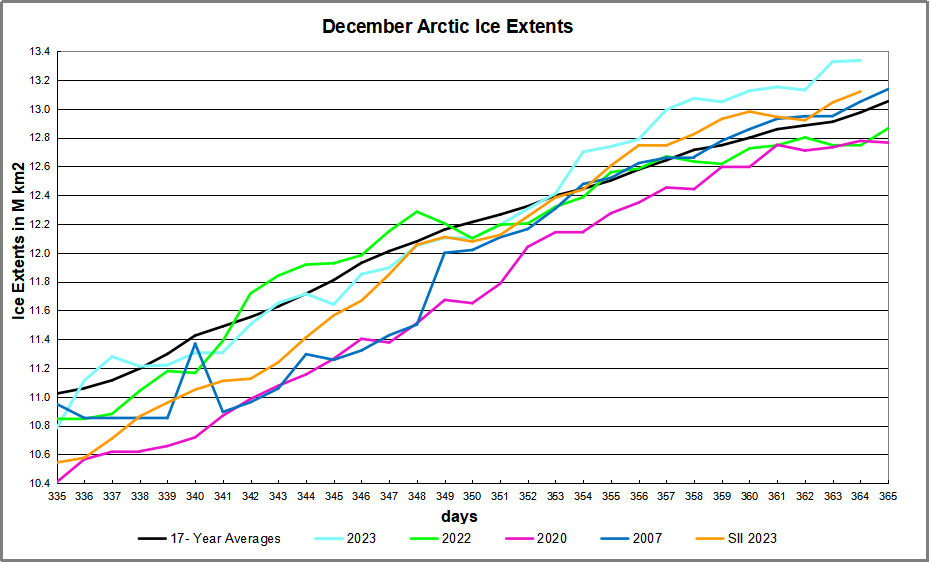
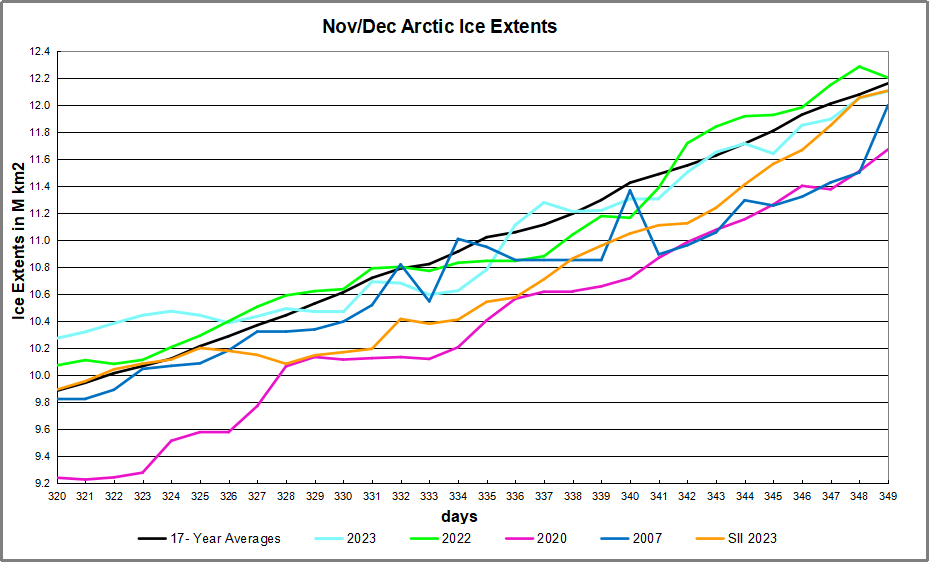
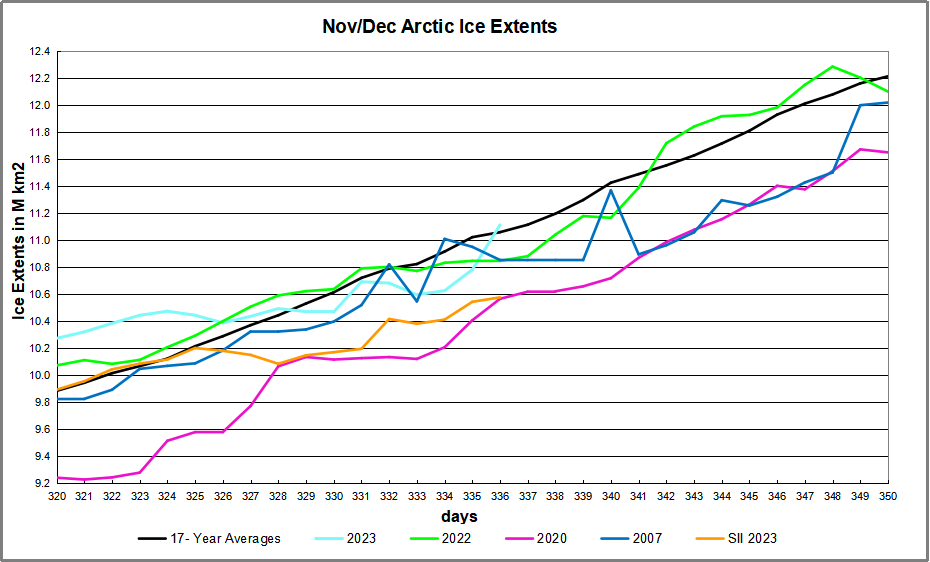
The graph shows the rapid rise in Arctic ice reaching 15 M km2 extent already on Feb. 11 (day 42) Then the extent dropped down to 14.6M before rising again to reach a new high of 15.07M. Yesterday Arctic ice was 215k km2 above average, with nearly all the surplus appearing in Okhotsk. SII showed neither the first peak or the current one in February.
The table shows the distribution of ice compared to day 56 averages and other years on that day.
| Region | 2024056 | Day 56 Ave | 2024-Ave. | 2006056 | 2024-2006 |
| (0) Northern_Hemisphere | 15039168 | 14823967 | 215201 | 14318117 | 721051 |
| (1) Beaufort_Sea | 1070983 | 1070317 | 667 | 1069711 | 1273 |
| (2) Chukchi_Sea | 966006 | 964499 | 1507 | 961796 | 4210 |
| (3) East_Siberian_Sea | 1087137 | 1087109 | 28 | 1086702 | 435 |
| (4) Laptev_Sea | 897845 | 897837 | 8 | 897773 | 71 |
| (5) Kara_Sea | 925734 | 916917 | 8818 | 899871 | 25864 |
| (6) Barents_Sea | 598915 | 606693 | -7778 | 484567 | 114348 |
| (7) Greenland_Sea | 742472 | 612727 | 129745 | 577357 | 165115 |
| (8) Baffin_Bay_Gulf_of_St._Lawrence | 1391601 | 1508331 | -116730 | 1365491 | 26110 |
| (9) Canadian_Archipelago | 854860 | 853163 | 1697 | 852715 | 2145 |
| (10) Hudson_Bay | 1260903 | 1260462 | 441 | 1257077 | 3827 |
| (11) Central_Arctic | 3220834 | 3210037 | 10797 | 3214577 | 6257 |
| (12) Bering_Sea | 619130 | 665856 | -46727 | 629210 | -10080 |
| (13) Baltic_Sea | 85666 | 98767 | -13101 | 101029 | -15363 |
| (14) Sea_of_Okhotsk | 1282477 | 1028678 | 253799 | 853467 | 429010 |
Note that moderate deficits in Bering Sea and Baffin Bay are more than offset by a large 254k km2 surplus in Okhotsk along with 130k km2 in Greenland Sea.
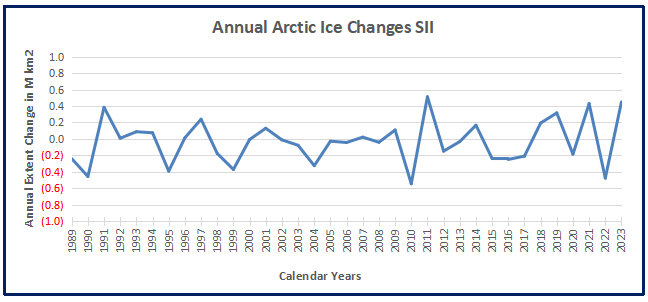
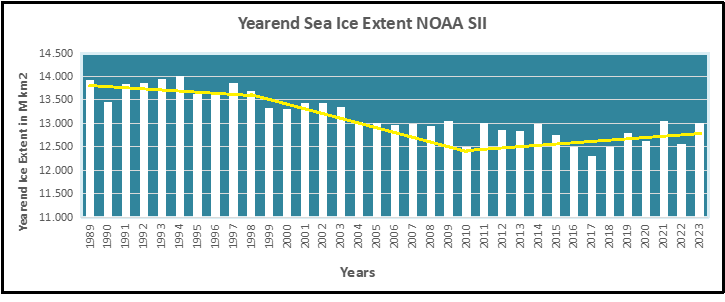
These results fly in the face of those claiming for years that Arctic ice is in a “death spiral.” More sober and clear-eyed observers have called out the alarmists for their exaggerations. A recent example comes from Allan Alsup Jensen at Nordic Institute of Product Sustainability, Environmental Chemistry and Toxicology, Denmark. His December 2023 paper is Time Trend of the Arctic Sea Ice Extent. Excerpts in italics with my bolds and added images.
Since 2007 no significant decline has been observed

Abstract
The NSIDC website, IPCC’s reports and some scientific papers have announced that the Arctic Sea ice extent, when it is lowest in September month, in recent years has declined dramatically, and in few decades the sea ice is supposed to disappear completely in the summer. In that way new and shorter ships routes will open up north of the continents.
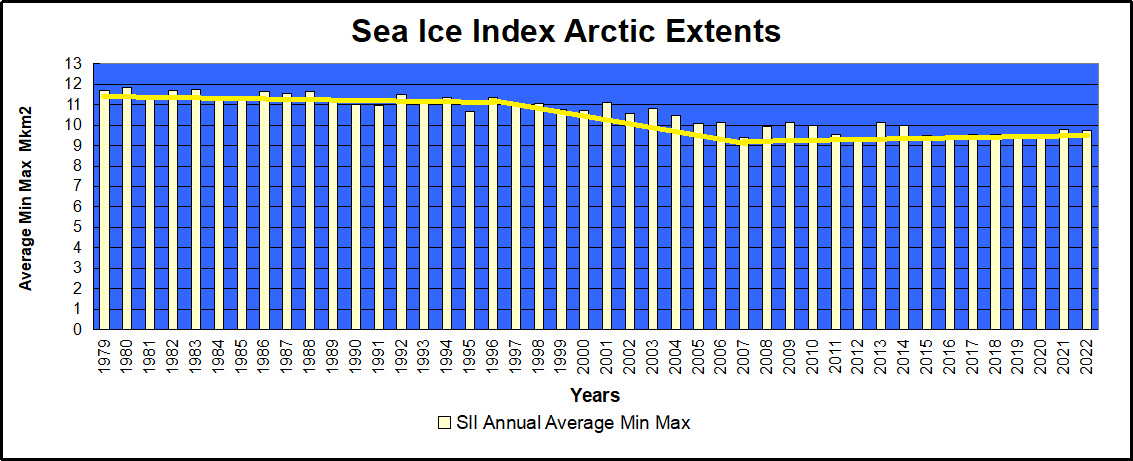
The facts are, that the Arctic Sea ice extent measured by satellites since 1978 expresses annual variations and it has declined considerably from 1997 to 2007. However, before that time period, from 1978 to 1996, the downward trend was minimal, and in the last 17 years from 2007 to 2023 the downward trend has also been about zero. Therefore, there is no indication that we should expect the Arctic Sea summer ice to disappear completely, as predicted, in one or two decades.
 Regarding the extent of the summer (February) sea ice at the Antarctic, the downward trend during the years 1979-2021 was very small but in 2022 and 2023 a considerable decline was observed, and a decline was also clearly observed for the whole period of 2007- 2023. That was in contradiction to what happened in the Arctic. The pattern of the annual levels was not the same for the Arctic and Antarctic, indicating different drivers in the North and the South.
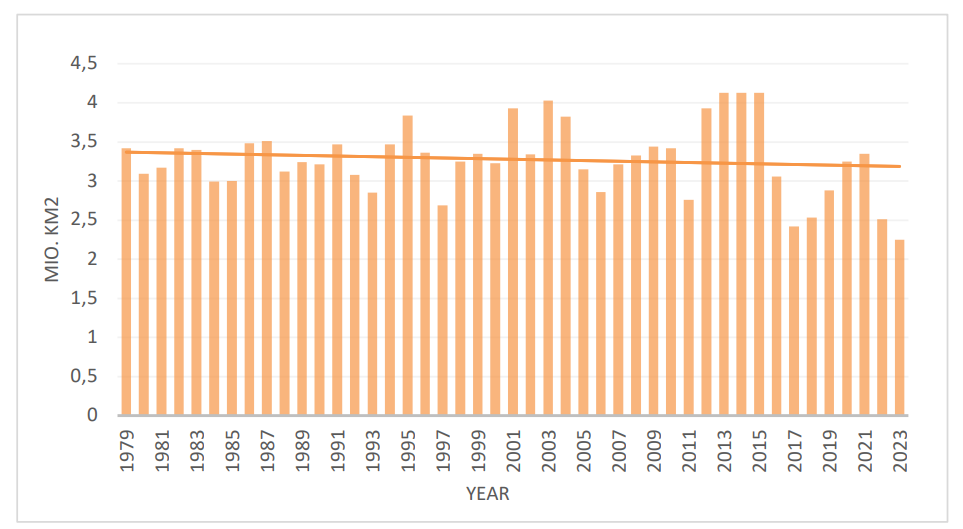
Figure 4: The minimum extent of the sea ice at Antarctic
in February month 1979-2023 (data from NSIDC.org)
These data show that there is no apparent correlation between the variable extent of the Arctic and the Antarctic Sea ice and the gradually increasing CO2-concentrations in the atmosphere as proposed by NSIDC, IPCC and others, also for these areas of cold climate.
Postscript Feb. 14
Some seek to deny the current plateau in Arctic Sea Ice by saying that extent measure is only surface, while volume would be a truer metric. That is true in theory, but in practice obtaining accurate and consistent data on sea ice thickness is a challenge yet to be reached. As you can imagine, detecting a depth dimension from satellites is fraught with errors, especially with drift ice not land anchored, moving around, sometimes piling up from winds. The scientific effort to measure volume has a short history and several uncertainties to ovecome before it can be trusted.
Unfortunately for those wanting an ice free Arctic (well, no more than 1 Wadham they say), the volume record so far shows the same plateau:
“Satellite derived sea ice thickness (CryoSat 2, AWI algorithm v2.6) shows an anomaly thickness pattern very similar to that from PIOMAS, but CS2 shows negative anomalies propagating north of the Canadian Archipelago into the central Arctic while PIOMAS has neutral conditions there. A positive thickness anomaly around Wrangle Island is spatially more extensive in CS2. January 2024 adds another month to the record of CS2 data which now spans 13 years. Neither CS2 nor PIOMAS show any discernible trend over that time period underlining the importance of internal variability at decadal timescales.” Source: Polar Science Center