
Updated below with comments and additional links September 17-19
Seeing a lot more of this lately, along with hearing the geese honking. And in the next month or so, we expect that trees around here will lose their leaves. It definitely is climate change of the seasonal variety.
Interestingly, the science on this is settled: It is all due to reduction of solar energy because of the shorter length of days (LOD). The trees drop their leaves and go dormant because of less sunlight, not because of lower temperatures. The latter is an effect, not the cause.
Of course, the farther north you go, the more remarkable the seasonal climate change. St. Petersburg, Russia has their balmy “White Nights” in June when twilight is as dark as it gets, followed by the cold, dark winter and a chance to see the Northern Lights.

And as we have been monitoring, the Arctic ice has been melting from sunlight in recent months, but will now begin to build again in the darkness to its maximum in March.
We can also expect in January and February for another migration of millions of Canadians (nicknamed “snowbirds”) to fly south in search of a summer-like climate to renew their memories and hopes. As was said to me by one man in Saskatchewan (part of the Canadian wheat breadbasket region): “Around here we have Triple-A farmers: April to August, and then Arizona.” Here’s what he was talking about: Quartzsite Arizona annually hosts 1.5M visitors, mostly between November and March.

Of course, this is just North America. Similar migrations occur in Europe, and in the Southern Hemisphere, the climates are changing in the opposite direction, Springtime currently. Since it is so obviously the sun causing this seasonal change, the question arises: Does the sunlight vary on longer than annual timescales?
The Solar-Climate Debate
And therein lies a great, enduring controversy between those (like the IPCC) who dismiss the sun as a driver of multi-Decadal climate change, and those who see a connection between solar cycles and Earth’s climate history. One side can be accused of ignoring the sun because of a prior commitment to CO2 as the climate “control knob”.
The other side is repeatedly denounced as “cyclomaniacs” in search of curve-fitting patterns to prove one or another thesis. It is also argued that a claim of 60-year cycles can not be validated with only 150 years or so of reliable data. That point has weight, but it is usually made by those on the CO2 bandwagon despite temperature and CO2 trends correlating for only 2 decades during the last century.
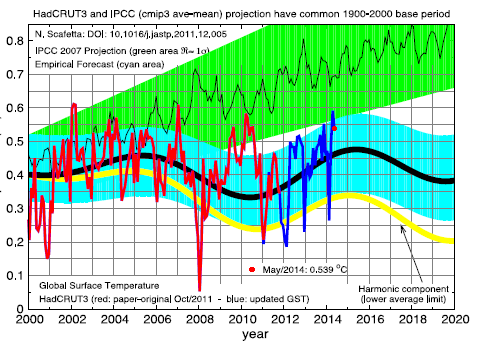
One scientist in this field is Nicola Scaffeta, who presents the basic concept this way:
“The theory is very simple in words. The solar system is characterized by a set of specific gravitational oscillations due to the fact that the planets are moving around the sun. Everything in the solar system tends to synchronize to these frequencies beginning with the sun itself. The oscillating sun then causes equivalent cycles in the climate system. Also the moon acts on the climate system with its own harmonics. In conclusion we have a climate system that is mostly made of a set of complex cycles that mirror astronomical cycles. Consequently it is possible to use these harmonics to both approximately hindcast and forecast the harmonic component of the climate, at least on a global scale. This theory is supported by strong empirical evidences using the available solar and climatic data.”
He goes on to say:
“The global surface temperature record appears to be made of natural specific oscillations with a likely solar/astronomical origin plus a noncyclical anthropogenic contribution during the last decades. Indeed, because the boundary condition of the climate system is regulated also by astronomical harmonic forcings, the astronomical frequencies need to be part of the climate signal in the same way the tidal oscillations are regulated by soli-lunar harmonics.”
He has concluded that “at least 60% of the warming of the Earth observed since 1970 appears to be induced by natural cycles which are present in the solar system.” For the near future he predicts a stabilization of global temperature until about 2016 and cooling until 2030-2040.
A Deeper, but Accessible Presentation of Solar-Climate Theory
I have found this presentation by Ian Wilson to be persuasive while honestly considering all of the complexities involved.
The author raises the question: What if there is a third factor that not only drives the variations in solar activity that we see on the Sun but also drives the changes that we see in climate here on the Earth?
The linked article is quite readable by a general audience, and comes to a similar conclusion as Scaffeta above: There is a connection, but it is not simple cause and effect. And yes, length of day (LOD) is a factor beyond the annual cycle.
Click to access IanwilsonForum2008.pdf
It is fair to say that we are still at the theorizing stage of understanding a solar connection to earth’s climate. And at this stage, investigators look for correlations in the data and propose theories (explanations) for what mechanisms are at work. Interestingly, despite the lack of interest from the IPCC, solar and climate variability is a very active research field these days.
A summary of current studies is provided at NoTricksZone:
Ian Wilson has much more to say at his blog: http://astroclimateconnection.blogspot.com.au/
Once again, it appears that the world is more complicated than a simple cause and effect model suggests.

For everything there is a season, a time for every purpose under heaven.
What has been will be again, what has been done will be done again; there is nothing new under the sun.
(Ecclesiastes 3:1 and 1:9)
Update Sept. 17: Commentary with Dr. Arnd Bernaerts
ArndB comments:
Fine writing, Ron, well done!
No doubt the sun is the by far the most important factor for not living on a globe with temperatures down to minus 200°C. That makes me hesitating to comment on „solar and climate variability” or “the sun drives climate” (currently at NTZ – link above), but today merely requesting humbly that the claimed correlation should be based at least on some evidence showing that the sun has ever caused a significant climatic shift during the last one million years, which was not only a bit air temperature variability due to solar cycles that necessarily occur in correlation with the intake and release of solar-radiation by the oceans and seas.
Interestingly the UK MetOffice just released a report (Sept.2015, pages 21) titled:
“Big Changes Underway in the Climate System?”
by attributing the most possible and likely changes to the current status of El Niño, PDO, and AMO, and – of course – carbon dioxide -, and a bit speculation on less sun-energy (see following excerpt at link)
Click to access Changes_In_The_Climate_System.pdf
From p. 13: “It is well established that trace gases such as carbon dioxide warm our planet through the “greenhouse effect”. These gases are relatively transparent to incoming sunlight, but trap some of the longer-wavelength radiation emitted by the Earth. However, other factors, both natural and man-made, can also change global temperatures. For example, a cooling could be caused by a downturn of the amount of energy received from the sun, or an increase in the sunlight reflected back to space by aerosol particles in the atmosphere. Aerosols increase temporarily after volcanic eruptions, but are also generated by pollution such as sulphur dioxide from factories.
These “external” factors are imposed on the climate system and may also affect the ENSO, PDO and AMO variations……
My Reply:
Thanks Arnd for engaging in this topic.
My view is that the ocean makes the climate by means of its huge storage of solar energy, and the fluctuations, oscillations in the processes of distributing that energy globally and to the poles. In addition, the ocean is the most affected by any variation in the incoming solar energy, both by the sun outputting more or less, and also by clouds and aerosols blocking incoming radiation more or less (albedo or brightness variability).
https://rclutz.wordpress.com/2015/04/21/the-climate-water-wheel/
The oscillations you mention, including the present El Nino (and Blob) phenomenon, show natural oceanic variability over years and decades. Other ocean cycles occur over multi-decadal and centennial scales, and are still being analyzed.

At the other end of the scale, I am persuaded that the earth switches between the “hot house” and the “ice house” mainly due to orbital cycles, which are an astronomical phenomenon. These are strong enough to overwhelm the moderating effect of the ocean thermal flywheel.
The debate centers on the extent to which solar activity has contributed to climate change over the last 3000 years of our current interglacial period, including current solar cycles.

Update September 19
Additional studies showing a solar-climate connection are here: https://translate.google.com/translate?hl=&sl=de&tl=en&u=http%3A%2F%2Fwww.kaltesonne.de%2Fsonne-macht-klima-neues-aus-europa%2F

Reblogged this on WeatherAction News.
LikeLike
In electronics the concept that there can be variability without precisely knowing the cause is well understood and accepted as the normal way of working. So, e.g. when sending a radio signal, one does not need to know what is causing the noise, only that noise does exist of a specific amplitude and frequency.
Unfortunately, climate is still at the stage of denying natural variability can exist – instead they falsely claim the possibility of 100% knowledge of everything happening in the climate and therefore work under the assumption that what the climate does is simply the sum of all they know.
But as many have said they know sh…
I would guess they can’t even correctly predict 10% of climate variation – which means they are not much better than not knowing at all. But just because natural variation is random, it doesn’t mean it is entirely unpredictable – because the scale and frequency content can be measured and this allows a level of prediction.
LikeLike
They would be better off knowing nothing. This would give them the opportunity to look at the picture with fresh eyes.
LikeLike
Fine writing, Ron, well done!
No doubt the sun is the by far the most important factor for not living on a globe with temperatures down to minus 200°C. That makes me hesitating to comment on „solar and climate variability” or “the sun drives climate” (currently at NTZ – link above), but today merely requesting humbly that the claimed correlation should be based at least on some evidence showing that the sun has ever caused a significant climatic shift during the last one million years, which was not only a bit air temperature variability due to solar cycles that necessarily occur in correlation with the intake and release of solar-radiation by the oceans and seas.
Interestingly the UK MetOffice just released a report (Sept.2015, pages 21) titled:
“Big Changes Underway in the Climate System?”
by attributing the most possible and likely changes to the current status of El Niño, PDO, and AMO, and – of course – carbon dioxide -, and a bit speculation on less sun-energy (see following excerpt at link)
Click to access Changes_In_The_Climate_System.pdf
From p. 13: “It is well established that trace gases such as carbon dioxide warm our planet through the “greenhouse effect”. These gases are relatively transparent to incoming sunlight, but trap some of the longer-wavelength radiation emitted by the Earth. However, other factors, both natural and man-made, can also change global temperatures. For example, a cooling could be caused by a downturn of the amount of energy received from the sun, or an increase in the sunlight reflected back to space by aerosol particles in the atmosphere. Aerosols increase temporarily after volcanic eruptions, but are also generated by pollution such as sulphur dioxide from factories.
These “external” factors are imposed on the climate system and may also affect the ENSO, PDO and AMO variations…… !”
LikeLike
A fine thoughtful and detailed reply, thanks Ron,
from which I would like to pick up the notion:
“….ocean makes the climate by means of its huge storage of solar energy,…..”
adding that in my view it may be better to see the oceans – from mankind perspective interested in understanding climatic changes – as a very, very cold and highly influential factor with regard to climate changes associated with – for example: El Niño, PDO, and AMO.
Actually only the most upper 200 meters of the sea surface can be regarded as “huge storage of solar energy” concerning our average daily to annual weather system. The water masses below the 200m surface layer (in average 3,500m or about 94,5%) are so cold that human life would hardly survive a few days, well demonstrated in graphics, in links given below, showing Atlantic and Pacific water temperature structures.
On one hand it is amazing how stable the most upper ocean sea-level is, but even minor disturbances, changes, internal or external impacts (e.g. submarine- or land-volcanoes, eddies or meanders) may quickly have an influence on sea surface heat capacity and salinity. Even minor changes can quickly affect our common weather pattern; we meanwhile are used to call them “climate change”.
Unfortunately we are so far away from sufficient information on ocean changes below the sea surface – and to my greatest regret, it seems there is by far too little understanding and interest to change the situation. In my view, in this respect a sea change is urgently needed.
Fine weekend and best regards Arnd
Atlantic T°C Profile: http://www.seaclimate.com/g/g1/images/rand/big/3_.jpg
Pacific T°C Profile : http://www.seaclimate.com/h/images/rand/b/gb_26_.jpg
From chapter G1 & H at: http://www.seaclimate.com/h/h.html
LikeLike
Thanks Arnd for your reply, and for your point well taken about the ocean depths. Which is also interesting because the earth’s crust is heated from below by the core, so this is also a moderating ocean effect.
LikeLike
Ron, you may find my comments at WUWT cogent to this. http://wattsupwiththat.com/2015/09/22/23-new-papers/#comment-2033059
I tried but for some reason failed to post a third comment regarding a second way in which not all watts are equal…
“Heat is a curious thing. In general it is described as an average of the kinetic energy of a given mass, such as one square meter. But this average, does not define the energy intensity of individual molecules or photons which composed said mass. A thought experiment if you will. Take a very large pot filled with water, say 100 square feet in area base, and ten feet deep, so 1000 square feet. and super insolated with a concave bottom, thinner in the center.
Now apply two different heat sources to this pot, both of which are say 100 watts per 1 square feet. The first source, example A, is a 100 square foot heating element, 10, 000 watts total, with the conducted heat perfectly distributed throughout. From this source, no matter how perfect the insolation of the pot of water, it can only get to the T of the heating element, at which point the net flow between the element and the pot will be equal.
Now consider a very different 100 watts per square foot AVERAGE source; example B. Apply a very small, say 1/4 inch square super heated but still 10,000 watts total, and so still 100 watts per square foot of the pot base. Given time, this greater energy intensity source of equal watts per square foot input to example A, can yet heat the pot of water to far higher Temperature. Under theoretical perfect insolation, the entire pot can reach the T of the source.
Comparing a flux in GHG LWIR to the energy intense SW flux striking a SW selective surface like the oceans, is like the example A verses B above. The watts per square meter flux is almost meaningless compared to the greater energy intensity of the SW flux and the thousands of times greater residence time of said SW flux striking the SW selective surface of the oceans, verses the very short residence time change in atmospheric energy due to increased GHG which also are far less energy intensive then the SW radiation penetrating the oceans. (Some of Konrad’s experiments may be useful here)
Due to the very long residence time of SW ocean insolation, and to the relatively higher energy intensity of SW insolation verses LWIR, then a 100 year long flux in SW insolation, can accumulate for every one of those 100 years, whereas the direct affects of a change in GHG LWIR, is balanced tomorrow. Indeed, not all watts are equal.
LikeLike
I actually do not know the correct scientific term to describe different energy intensity as outlined in my above post.
LikeLike
David, thanks for commenting. I don’t know the technical term either. I suspect the issue has to do with the averaging. Thermal interactions AFAIK are local and particular. The rate of heat exchange between two objects of differing temperatures is affected greatly by the size of the differential. Thus your laser-like extremely hot source will rapidly raise the temperature of the pot in contact with it, far faster and therefore much higher (closer to the source) than the water can convect the heat away to other water molecules. When the differential in temperature is small, the exchange is slow and averages are more descriptive of what is happening.
LikeLike
But is not the SW energy somewhat similar, of higher energy when compared to LWIR? Does a SW photon have greater potential kinetic energy then a LWIR photon?
LikeLike
That is true according to this source:
http://www.pveducation.org/pvcdrom/properties-of-sunlight/photon-flux
Another page there shows the energy is more than 10 times as much.
LikeLike
I was struck by this:

That is a logarithmic scale on the left.
LikeLike
Note that the mercury lamp can match solar energy at very SW (~250) but at longer wavelengths, sunlight is much more energetic than other sources. It must be due to the sun’s temperature of 5778K.
Correction: I see now the right hand scale pertains to solar, and left hand axis to artificial light sources. The comparison is not as I thought.
Your point is well taken: SW photons have more energy than LW ones.
LikeLike