
Three weeks ago I reported that after 2007 Arctic ice extent was no longer declining, and that 2015 will add another year to that stabilization. With only half a month until year end, the recent MASIE measurements are showing the expected surplus of ice.
MASIE measurements show that 2007 ice extent was lower than any year since. It is now confirmed that 2015 average annual extent will exceed 2007 by at least 300,000 km2. That difference arises from comparing 2007 annual average of 10.414 M km2 with 2015 running average through day 349 of 10.717. In the 16 days remaining in 2015, we can expect the annual average to rise to about 10.774, or 360,000 km2 higher than 2007.
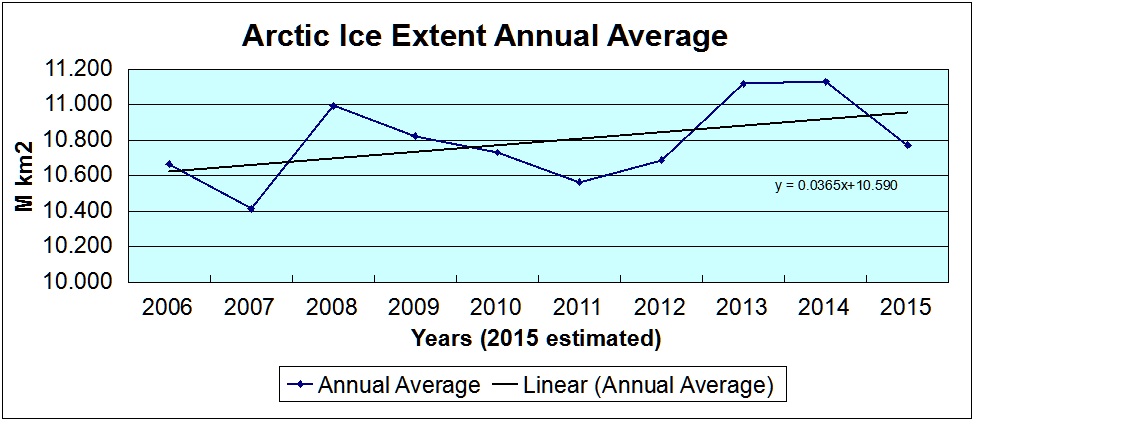
At this point in the annual cycle, it is possible to project the annual average for the calendar year. The daily average presently is well above the running average for the year, so the year-end average will be increasing each day to the end of December. In the last decade, a typical year added about 60k km2 to the annual average in the last 16 days.
Disclaimer: Alarmists chafe at the words “growing” and “recovery”, and I use them poetically to counter “death spiral” terminology. What we have seen in the last decade is a plateau in Arctic ice extent, analogous to the plateau in surface temperatures. The rise since 2007 is slight and not statistically important, just as the loss of ice from 1979 to 1994 in the NOAA dataset was too slight to count as a decline.
Summary:
Arctic ice declined in the decade prior to 2007, but has not declined since.
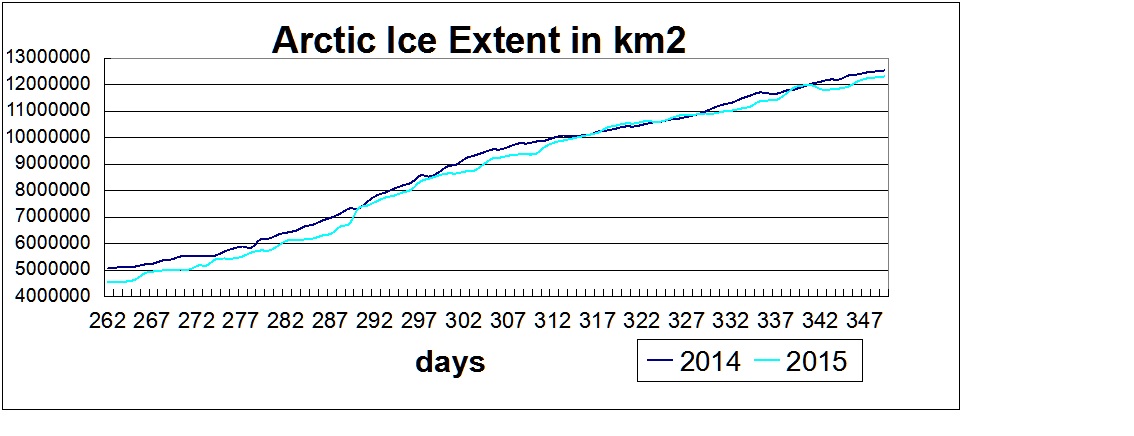
MASIE Comparison 2014 and 2015 Day 349
| Ice Extents | Ice Extent | ||
| Region | 2014349 | 2015349 | km2 Diff. |
| (0) Northern_Hemisphere | 12548113 | 12289626 | -258486 |
| (1) Beaufort_Sea | 1070445 | 1070445 | 0 |
| (2) Chukchi_Sea | 966006 | 965989 | -17 |
| (3) East_Siberian_Sea | 1087137 | 1087120 | -17 |
| (4) Laptev_Sea | 897845 | 897809 | -36 |
| (5) Kara_Sea | 933096 | 874256 | -58839 |
| (6) Barents_Sea | 433080 | 286703 | -146377 |
| (7) Greenland_Sea | 511903 | 600822 | 88919 |
| (8) Baffin_Bay_Gulf_of_St._Lawrence | 887832 | 989563 | 101731 |
| (9) Canadian_Archipelago | 853214 | 853178 | -36 |
| (10) Hudson_Bay | 1253770 | 1013217 | -240553 |
| (11) Central_Arctic | 3235340 | 3206905 | -28435 |
| (12) Bering_Sea | 176250 | 292268 | 116018 |
| (13) Baltic_Sea | 4594 | 2028 | -2566 |
| (14) Sea_of_Okhotsk | 228906 | 145623 | -83283 |
| (15) Yellow_Sea | 940 | 151 | -789 |
| (16) Cook_Inlet | 130 | 2407 | 2277 |
There is little difference between 2014 and 2015 at this point. The major basins have recovered: Central Arctic, BCE (Beaufort, Chuchi, East Siberian), Canadian Archipelago. Bering Sea is freezing ahead of last year. Barents, Kara and Okhotsk are behind while Greenland and Baffin are ahead. The major difference is Hudson Bay.


Reblogged this on Climatism and commented:
Arctic sea ice stabilising over the past decade – Should be headline news and mass celebrations from climate alarmists who proclaimed the Arctic “Death Spiral”, but no, you won’t hear any cheers or any mention from catastrophists and the complicit alarmist media about the Arctics recovery and healthy state.
Funny that. I would have thought they’d be ecstatic. But alas, they prefer disaster scenarios to prove their anthropogenic CO2 causes catastrophic warning theory, thus maintaining their misanthropic bent.
LikeLike