Arctic Ice Crunch Time

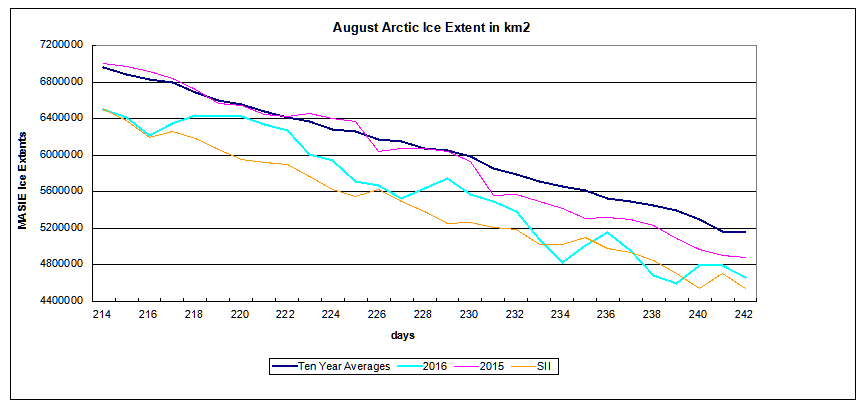
The MASIE image of Arctic ice extent from yesterday shows 4.5M km2, which has persisted for the last 3 days. Day 247 is just 13 days short of the most frequent day of annual minimum. So this is the crunch time in the annual battle between the ocean water and ice. The decline of ice extent is shown below since August 15 (August being the month of greatest loss of ice).

It shows that 2016 extent dipped below 4.4M, but has been steady at 4.5 M for the first 3 days of Sept. and is close to 2015 at this point. SII is showing ~300k km2 less ice than MASIE in Sept. The table below shows ice extents in the regions:
| Region | 2016247 | 2015247 | Difference |
| (0) Northern_Hemisphere | 4517221 | 4594179 | -76958 |
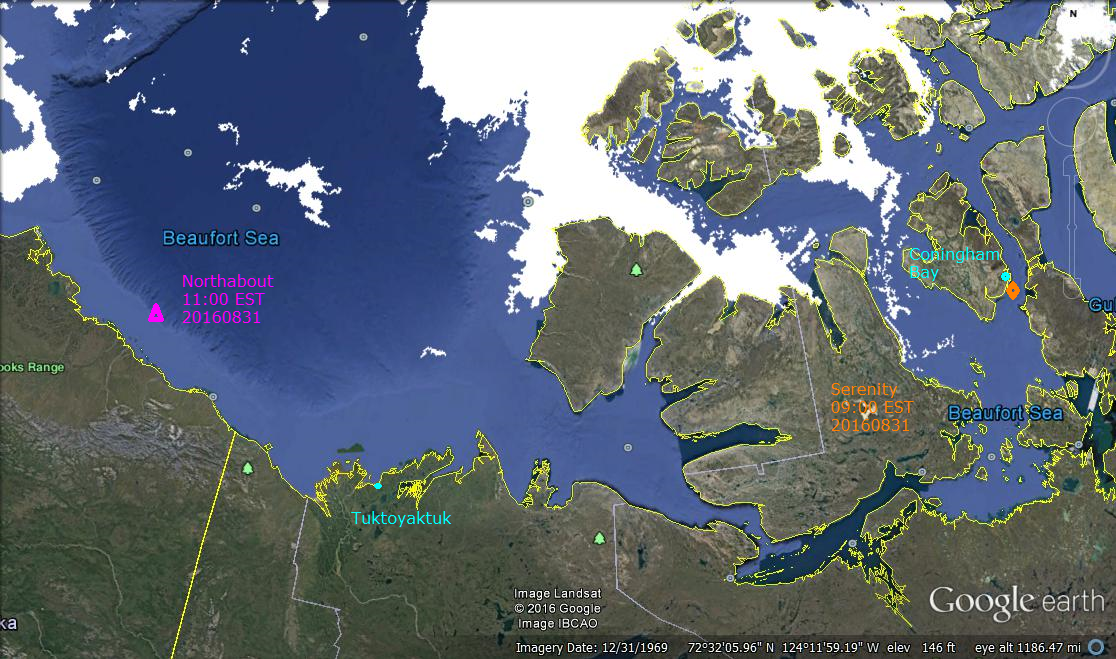
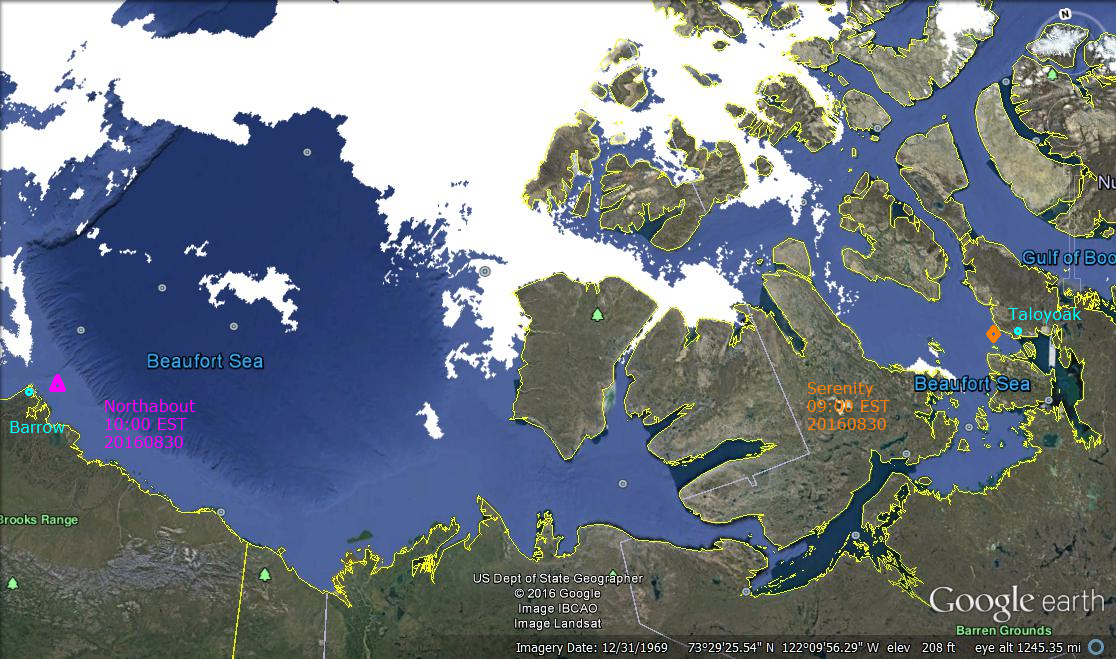
| (1) Beaufort_Sea | 283557 | 493132 | -209575 |
| (2) Chukchi_Sea | 392413 | 236968 | 155445 |
| (3) East_Siberian_Sea | 175341 | 331333 | -155992 |
| (4) Laptev_Sea | 383872 | 59062 | 324810 |
| (5) Kara_Sea | 8023 | 8196 | -174 |
| (6) Barents_Sea | 217 | 126 | 90 |
| (7) Greenland_Sea | 158466 | 151300 | 7166 |
| (8) Baffin_Bay_Gulf_of_St._Lawrence | 13984 | 73188 | -59205 |
| (9) Canadian_Archipelago | 242154 | 247177 | -5023 |
| (10) Hudson_Bay | 239 | 51561 | -51322 |
| (11) Central_Arctic | 2858376 | 2941319 | -82944 |
Note that Baffin and Hudson Bays are much lower this year, but they have little left to lose compared to 2016. The rest of the seas have offsetting surpluses and deficits in different places. The most significant issue is Central Arctic being lower than last year, which may foretell a lower September monthly minimum. Time will tell.
Summary of Year To Date
Someone asked how the annual average ice extent was coming along this year, so I crunched the numbers.
The graph summarizes the changing extents of Arctic ice as measured by two primary datasets: MASIE (Multi-sensor Analyzed Sea Ice Extent) and SII (Sea Ice Index -solely from satellite passive microwave sensors).
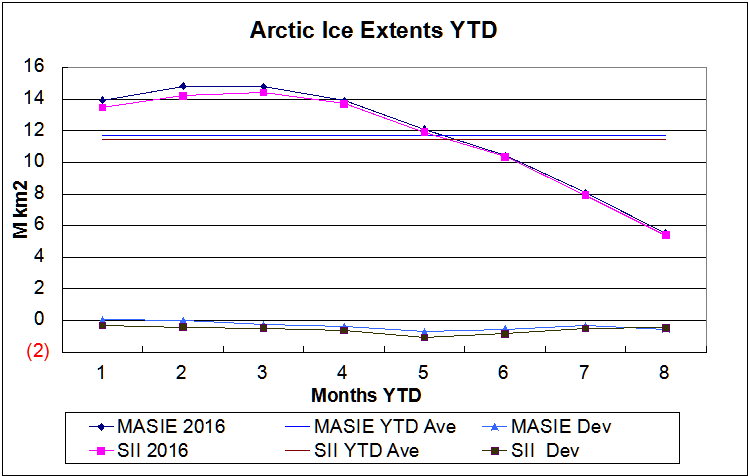
Measured in M km2, the two highest lines are the monthly average extents reported for the first 8 months of 2016. The two horizontal lines show the YTD average from the 8 months. At the bottom are the deviations from 10 yr. Averages for each month (from each dataset).
It is clear that MASIE was reporting slightly more ice early on, and then the two estimates have been close together since. The deviation below average grew up through May, with SII reporting 1M km2 deficit. As of August, both MASIE and SII are showing ice extent down about 0.5M km2.
The 10 yr. Averages of extents for the YTD (8 months) are exactly 12M km2 in both datasets. So Masie YTD is ~3% below average and SII YTD is ~5% down.
Summary
There will be much to do about Arctic ice death spirals in the weeks ahead as 2016 continues to show lower extents. Most likely the September average will be lower than last year, an event lasting perhaps 2-3 weeks before refreezing brings it back over last year’s minimum. Only someone pushing an agenda would claim such a short phenomenon contained within a single month of the year shows the climate is changing.
For more on making sense of Arctic Ice graphs see Ice House of Mirrors
For those who want to see numbers, the table is below.
| Monthly | 2006-2015 | 2016 | 2006-2015 | 2016 | 2016 | 2016-10yr Ave | 2016-10yr Ave |
| Averages | MASIE | MASIE | SII | SII | SII Deficit | MASIE | SII |
| Jan | 13.872 | 13.922 | 13.780 | 13.472 | -0.450 | 0.049 | -0.308 |
| Feb | 14.785 | 14.804 | 14.632 | 14.210 | -0.593 | 0.019 | -0.422 |
| Mar | 15.008 | 14.769 | 14.886 | 14.405 | -0.364 | -0.239 | -0.481 |
| Apr | 14.308 | 13.917 | 14.307 | 13.694 | -0.223 | -0.391 | -0.613 |
| May | 12.767 | 12.086 | 12.960 | 11.900 | -0.186 | -0.681 | -1.060 |
| June | 10.952 | 10.419 | 11.192 | 10.353 | -0.066 | -0.533 | -0.839 |
| July | 8.401 | 8.067 | 8.421 | 7.920 | -0.147 | -0.334 | -0.501 |
| Aug | 6.066 | 5.531 | 5.838 | 5.390 | -0.141 | -0.535 | -0.448 |
| YTD Ave. | 12.020 | 11.689 | 12.002 | 11.418 | -0.271 | -0.331 | -0.584 |

September Minimum Outlook
Historically, where will ice be remaining when Arctic melting stops? Over the last 10 years, on average MASIE shows the annual minimum occurring about day 260. Of course in a given year, the daily minimum varies slightly a few days +/- from that.
For comparison, here are sea ice extents reported from 2007, 2012, 2014 and 2015 for day 260:
| Arctic Regions | 2007 | 2012 | 2014 | 2015 |
| Central Arctic Sea | 2.67 | 2.64 | 2.98 | 2.93 |
| BCE | 0.50 | 0.31 | 1.38 | 0.89 |
| Greenland & CAA | 0.56 | 0.41 | 0.55 | 0.46 |
| Bits & Pieces | 0.32 | 0.04 | 0.22 | 0.15 |
| NH Total | 4.05 | 3.40 | 5.13 | 4.44 |
Notes: Extents are in M km2. BCE region includes Beaufort, Chukchi and Eastern Siberian seas. Greenland Sea (not the ice sheet). Canadian Arctic Archipelago (CAA). Locations of the Bits and Pieces vary.
As the table shows, low NH minimums come mainly from ice losses in Central Arctic and BCE. The great 2012 cyclone hit both in order to set the recent record. The recovery since 2012 shows in 2014, with some dropoff last year, mostly in BCE.
Summary
We are nearing the end of the melt season, and the resulting minimum will depend upon the vagaries of weather between now and September 16 or so. Early on, 2016 was slightly higher than 2015 in March, lower in May and narrowing the gap late June and late July. Note: 2016 melt season is starting without the Blob, with El Nino over, and a cold blob in the North Atlantic. The AO has been hovering around neutral, now possibly indicating cloud cover reducing the pace of melting.
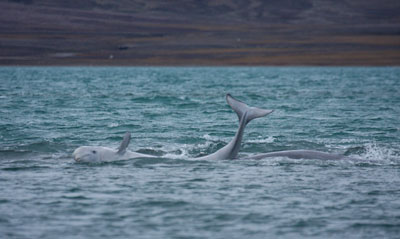
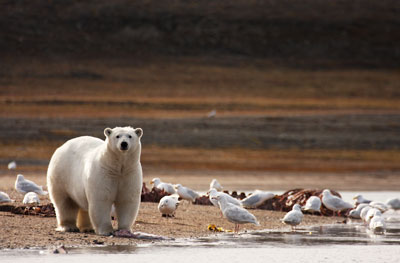
Meanwhile we can watch and appreciate the beauty of the changing ice conditions.

Arctic sea ice in summer 2015. This photo was made during an expedition of the German research icebreaker Polarstern into the central Arctic Ocean. Credit: Stefan Hendricks
Footnote: Regarding the colder than normal water in the North Atlantic
A 2016 article for EOS is entitled Atlantic Sea Ice Could Grow in the Next Decade
Changing ocean circulation in the North Atlantic could lead to winter sea ice coverage remaining steady and even growing in select regions.
The researchers analyzed simulations from the Community Earth System Model, modeling both atmosphere and ocean circulation. They found that decadal-scale trends in Arctic winter sea ice extent are largely explained by changes in ocean circulation rather than by large-scale external factors like anthropogenic warming.
From the Abstract of Yeager et al.
We present evidence that the extreme negative trends in Arctic winter sea-ice extent in the late 1990s were a predictable consequence of the preceding decade of persistent positive winter North Atlantic Oscillation (NAO) conditions and associated spin-up of the thermohaline circulation (THC). Initialized forecasts made with the Community Earth System Model decadal prediction system indicate that relatively low rates of North Atlantic Deep Water formation in recent years will result in a continuation of a THC spin-down that began more than a decade ago. Consequently, projected 10-year trends in winter Arctic winter sea-ice extent seem likely to be much more positive than has recently been observed, with the possibility of actual decadal growth in Atlantic sea-ice in the near future.