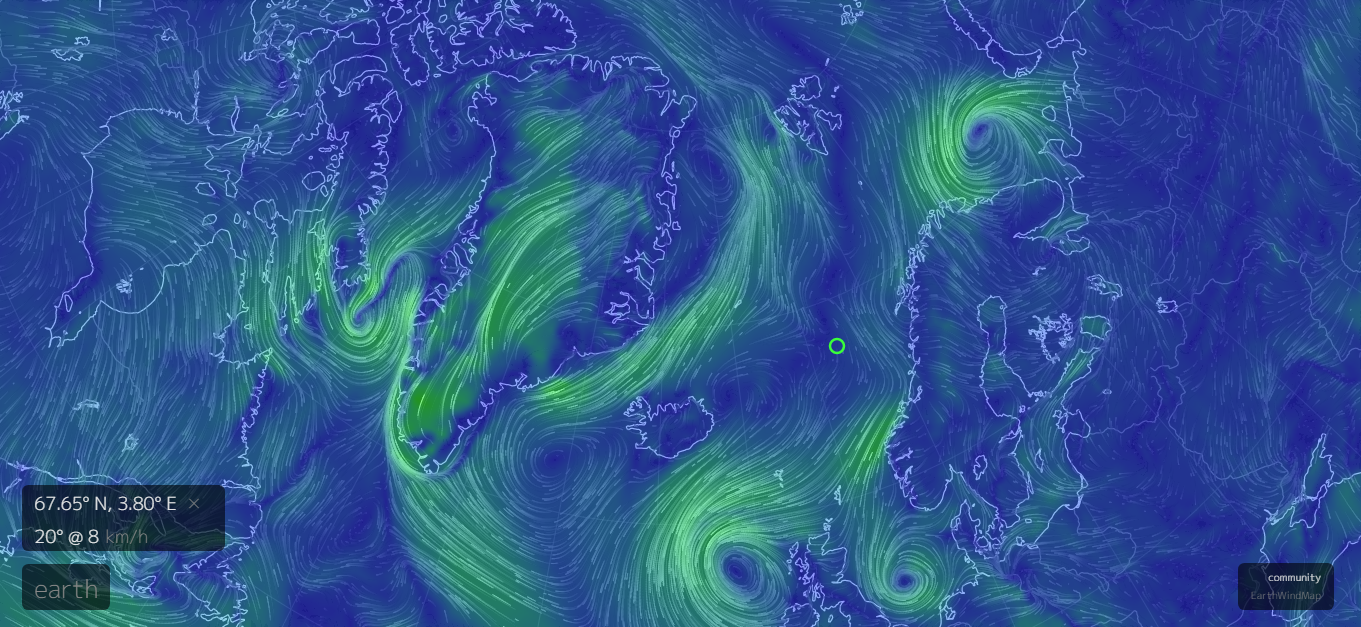
Image from earth:nullschool showing arctic wind patterns. This is the link to the animated display:
https://earth.nullschool.net/#current/wind/surface/level/orthographic=-17.87,70.69,1132/loc=3.799,67.645
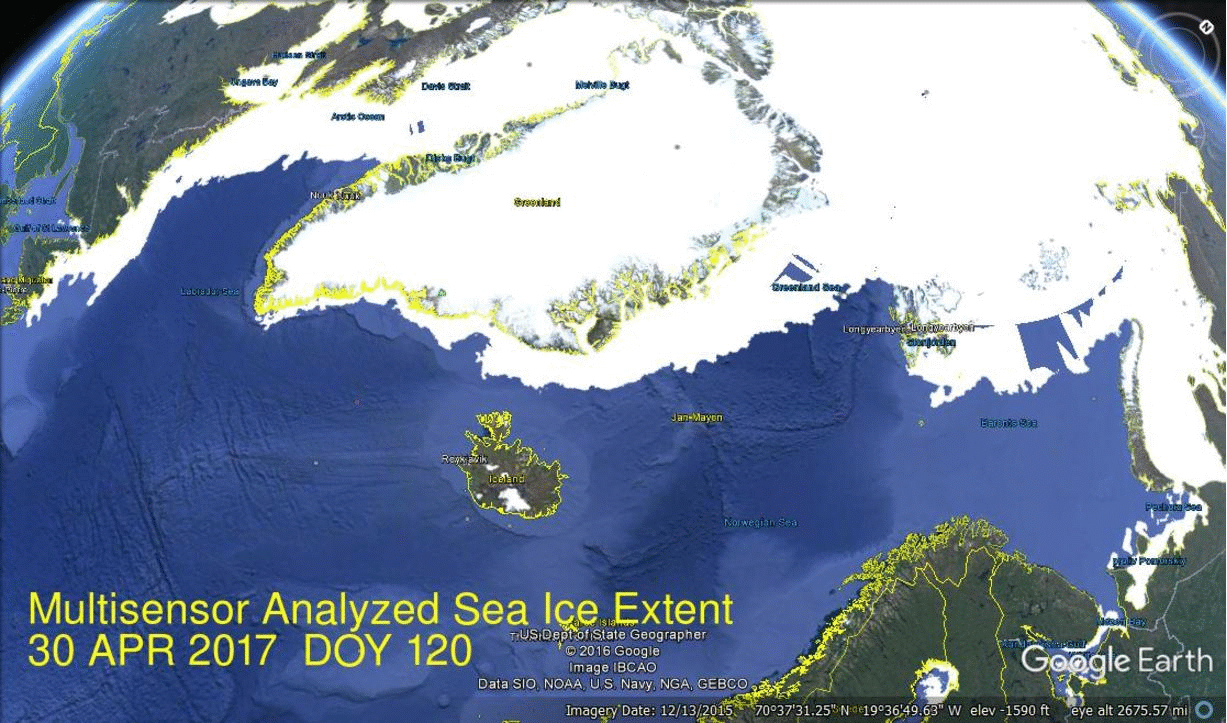
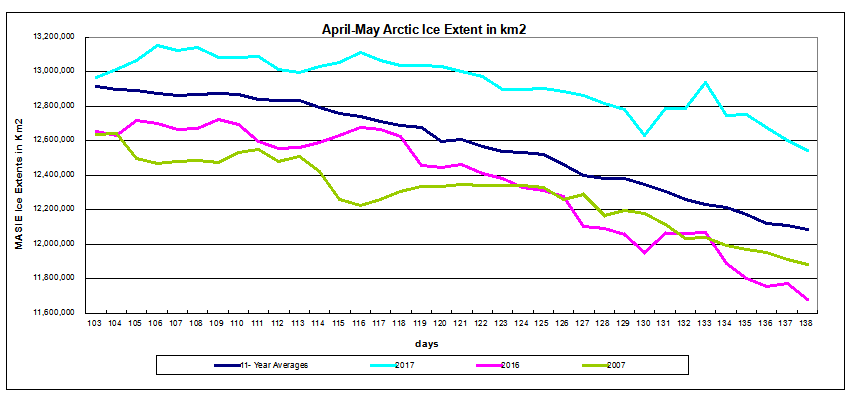
In May Arctic ice continues to be more extensive than recently. As previously reported, central and Atlantic sea ice is above decadal averages. The image below shows surprising growth since day 120 (April 30), with a pause the last few days.
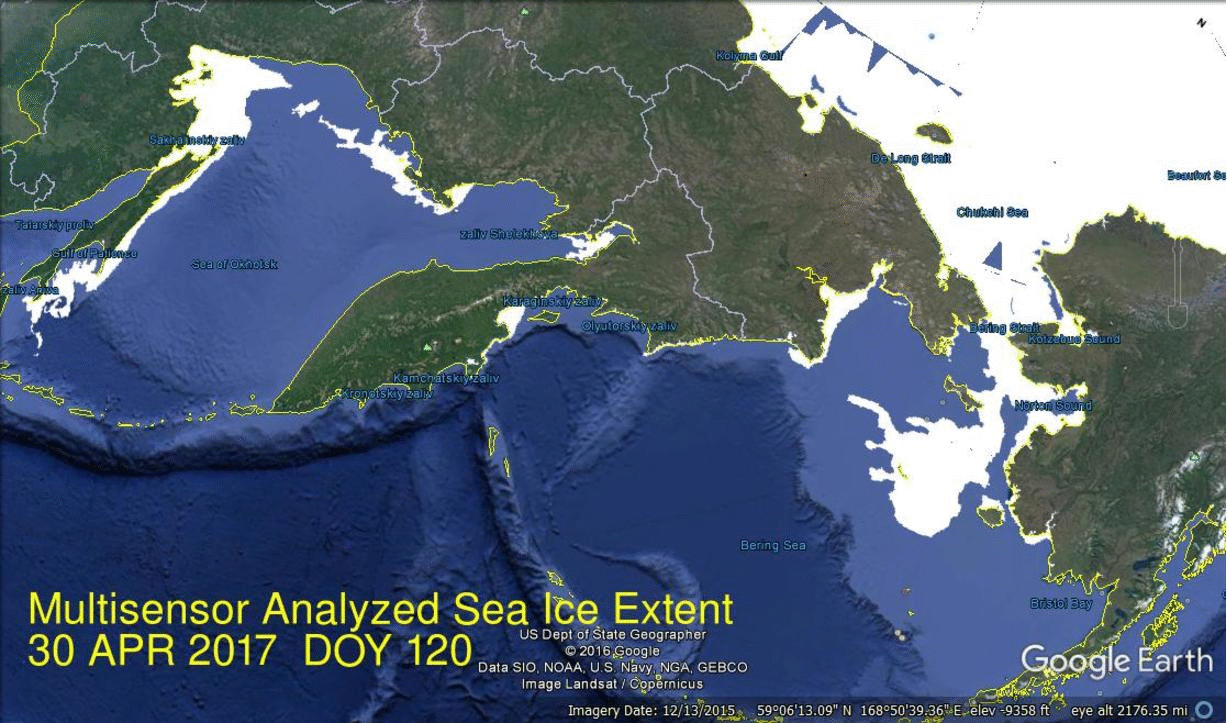
Things are different on the Pacific side where Bering in particular has melted ahead of schedule, and now extending in Chukchi sea, inside the actual Arctic basin.
The graph below shows how in recent days 2017 NH ice extents have grown above average, even including the exceptionally low amounts of ice in the Pacific, Bering in particular.
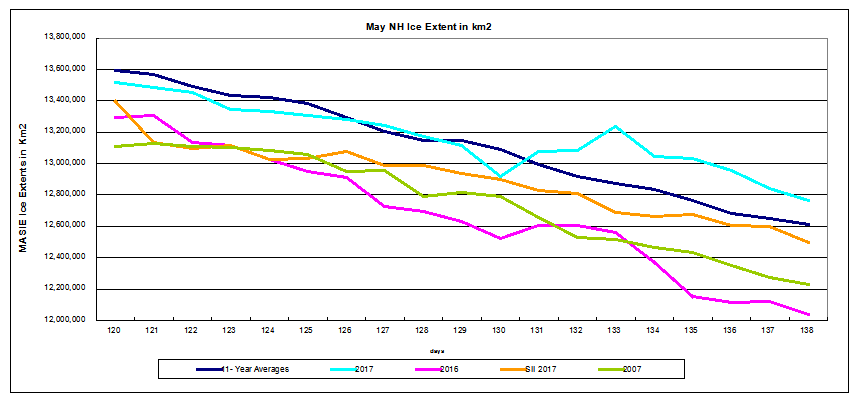
Note that as of day 138, yesterday, 2017 NH ice was 150k km2 above average, 300k above SII estimates, 550k above 2007 and nearly 800k km2 more than last year.
The graph below shows Arctic ice excluding the Pacific seas of Bering and Okhotsk. This provides an even more dramatic view of this years ice extents. Mid April Arctic ice was average, and look what has happened since May began on day 121. There was a drop and a rise, with a current surplus of 450k km2.
The table for day 138 shows the regional extents for 2017 compared to averages and 2007.
| Region | 2017138 | Day 138 Average |
2017-Ave. | 2007138 | 2017-2007 |
| (0) Northern_Hemisphere | 12765934 | 12609649 | 156285 | 12228251 | 537683 |
| (1) Beaufort_Sea | 1037364 | 1035052 | 2313 | 1063324 | -25960 |
| (2) Chukchi_Sea | 855121 | 935117 | -79997 | 940430 | -85309 |
| (3) East_Siberian_Sea | 1068289 | 1082898 | -14609 | 1069398 | -1109 |
| (4) Laptev_Sea | 897845 | 871037 | 26807 | 789644 | 108201 |
| (5) Kara_Sea | 931636 | 883725 | 47911 | 892687 | 38949 |
| (6) Barents_Sea | 526079 | 378812 | 147267 | 335179 | 190899 |
| (7) Greenland_Sea | 629810 | 612779 | 17031 | 578928 | 50883 |
| (8) Baffin_Bay_Gulf_of_St._Lawrence | 1286982 | 1059735 | 227247 | 1002295 | 284687 |
| (9) Canadian_Archipelago | 851190 | 834484 | 16706 | 840548 | 10642 |
| (10) Hudson_Bay | 1203259 | 1157573 | 45687 | 1132632 | 70627 |
| (11) Central_Arctic | 3247685 | 3225767 | 21917 | 3231808 | 15877 |
| (12) Bering_Sea | 86844 | 339072 | -252228 | 227132 | -140288 |
| (13) Baltic_Sea | 7716 | 4442 | 3274 | 4398 | 3318 |
| (14) Sea_of_Okhotsk | 134303 | 186523 | -52219 | 117127 | 17177 |
The 300k km2 deficit in Bering and Okhotsk is evident. Also Chukchi is starting to show the effects from early Bering melting. Other seas are above average, with large surpluses in Baffin and Barents sea.

Some insight into the unusual Arctic ice growth comes from AER Arctic Report and Forecast May 8, 2017
Currently positive pressure/geopotential height anomalies are mostly focused on the North Atlantic side of the Arctic with mostly negative pressure/geopotential height anomalies across the mid-latitudes of the Northern Hemisphere (NH). This is resulting in a near record low Arctic Oscillation (AO) and North Atlantic Oscillation (NAO) for May.
It might be the second week of May but an unusually strong block/high pressure exists in the northern North Atlantic including Iceland and Greenland and is more commonly associated with winter. The unusually strong block is contributing to not only below normal temperatures to both sides of the North Atlantic, including Europe and the Eastern US but late season snowfall to Southeastern Canada, the Northeastern US and Russia. The negative geopotential height anomalies that have developed both downstream across western Eurasia including Europe and upstream across the Eastern US are predicted to persist for much of the month of May helping to ensure a relatively cool month of May for both Europe and the Eastern US.
Summary
Do not be mislead by reports of declining sea ice in the Arctic; it is a distraction based on early melting in the Pacific, especially Bering sea.
Meanwhile, on the Atlantic side of the Arctic, we have sightings and reports of ice surges along the coast of Newfoundland, such amounts not seen since the 1980s. Below is a NASA satellite photo of Newfoundland Sea Ice, May 5, 2017 Source: Newsfoundsander


One comment