
The background for the compilation series is provided in the first post along with my starting point analyzing temperature records. See Climate Compilation Part I Temperatures
Compilation II Arctic Sea Ice (link to category)
Another preoccupation has been the fluctuating Arctic Sea Ice extents. I noticed that warmists were quite focused on this issue, especially the annual minimums in September. And despite the long record of ice charts prepared by naval authorities, all the ice watchers referred almost exclusively to the satellite estimates, especially the NASA team results published as the Sea Ice Index (SII) on NSIDC.
In the past some researchers had preferred the ice charts from the NIC (US Naval Ice Center, now National Ice Center) and noted differences between operational observations from NIC and the satellite estimates that rely on passive microwave sensors. The NIC index is called MASIE (Multisensor Analyzed Sea Ice Extent), has a higher resolution, higher threshold for declaring a grid cell ice-filled, and generally shows more ice extent than SII.

MASIE: “high-resolution, accurate charts of ice conditions”
Walt Meier, NSIDC, October 2015 article in Annals of Glaciology.
My concern is to raise awareness of a high quality sea ice record that has been largely ignored by a myopic focus on satellite estimates. Periodic ice reports can be found on this blog on a bi-monthly basis.
https://i1.wp.com/siberiantimes.com/PICTURES/OTHERS/Icebreakers-stuck-Chukotka/inside%204.jpg
Sometimes there are storms or other surprising events to report, such as the late additional freezing in January that trapped Russian ships shown in the image above and posted as Arctic Ice Takes Revenge.
Last year it was also interesting to follow the progress of the Polar Challenge sailing ship Northabout as well as the cruise ship Serenity passing through the Arctic seas and the Canadian Arctic Archipelago. For example see Arctic Ships Past Halfway from Aug. 29, 2016.

This category also includes several discussions of research into the Arctic climate system from lesser-known but highly regarded sources like the prestigious AARI: Arctic and Antarctic Research Institute St. Petersburg, Russia. See Arctic Sea Ice: Self-Oscillating System and The Great Arctic Ice Exchange
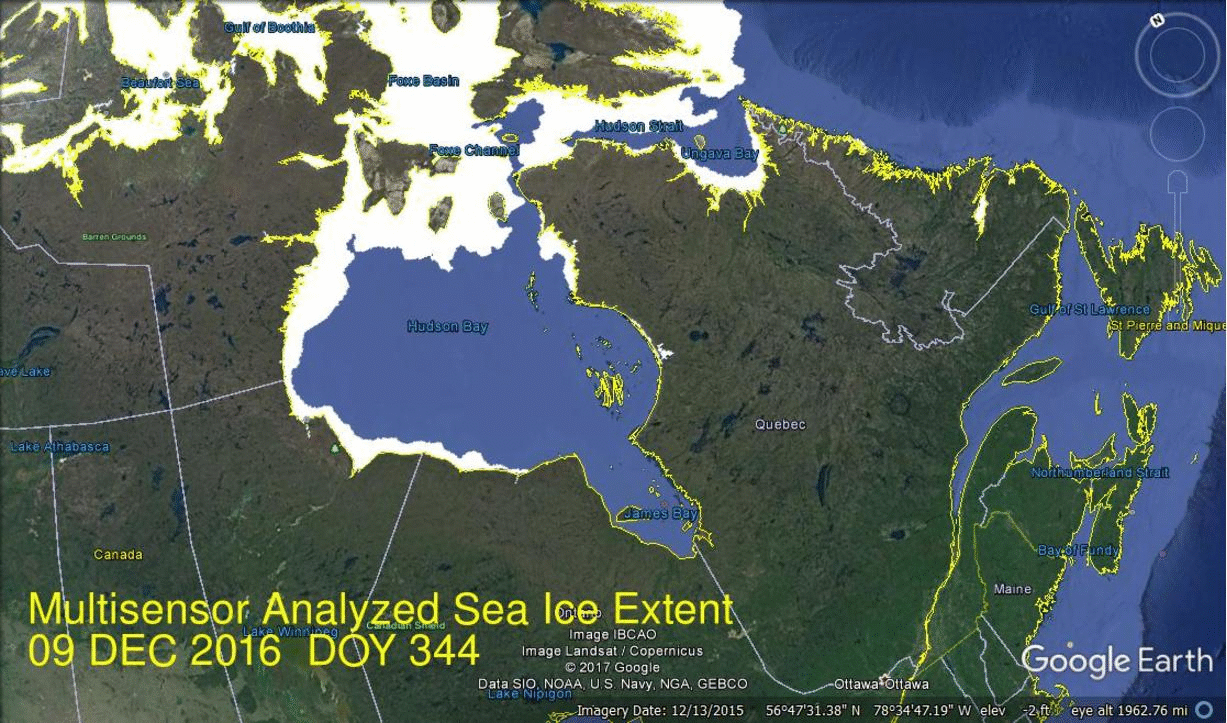
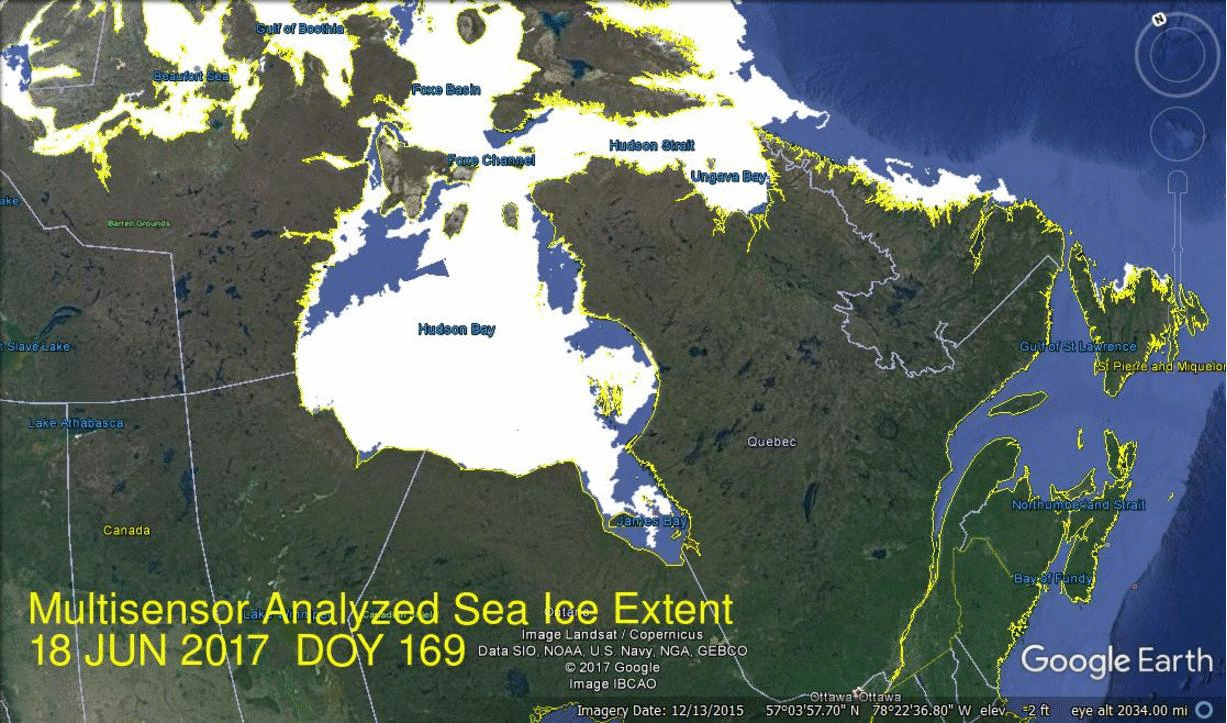
Over time I have learned how to use the visual files MASIE provides in Google Earth formats. For example, these images of sea ice waxing and waning in Hudson Bay.
Hudson Bay is providing a great example how ice extents can change dramatically in such a relatively shallow basin near the Arctic circle. Last December 2016 some concerns were expressed about the lack of ice in Hudson Bay, which were suddenly overcome in ten days starting December 9. Watch:
https://rclutz.com/wp-content/uploads/2017/06/webp-net-gifmaker-51.gif
Now fast-forward to this spring 2017 when ice was persisting strongly in both Baffin and Hudson Bays. Starting ten days ago on June 18 Summer is showing us how quickly goes the opposite effect, including a major meltdown the last two days. On the right side you can see Newfoundlanders are finally rid of their ice.
https://rclutz.com/wp-content/uploads/2017/06/webp-net-gifmaker-6.gif
For an overview of Arctic Ice Watching along with some amusement, see Ice House of Mirrors.
For a comparison of SII and MASIE see A Tale of Two Indices
https://rclutz.com/wp-content/uploads/2016/02/seal-of-approval-seal.jpg
Reblogged this on Climate Collections.