For much of February, NH has been overall slower than usual to add ice extent. But that does not mean nothing is happening. For we can observe ice dances on opposite sides of the Arctic from January up to now. The image above shows how Pacific ice extents have shuffled back and forth between Okhotsk (left) and Bering (right), alternating waxing and waning so that both basins combined are below average. Lately Okhotsk has added ice to reach normal, so now Bering makes most of the difference. Bering is now only 45% of last years maximum, while Okhotsk has reached 81% of last year’s max extent.

Drift ice in Okhotsk Sea at sunrise.
On the Atlantic side, the two players are Barents and Baffin Bay/Gulf of St. Lawrence. On the left side you can see Baffin Bay extending down to reach Newfoundland, and Gulf of St. Lawrence filling in. Meanwhile Barents has waffled up and down, first growing to reach Svalbard and then receding along with Greenland Sea opening to the left of Svalbard. Barents is presently at 75% of last years maximum, while BB/GSL extent is its highest this year and 96% of last year’s max.

Sea ice forming in Baffin Bay.
Overall 2018 Arctic ice has reached 14.1M km2, about 600k km2 or 5% below average.
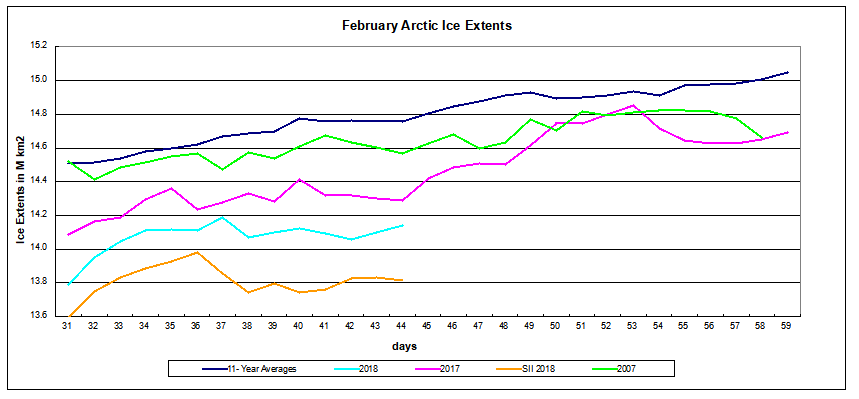
MASIE shows this year catching up to 2017 while SII 2018 lags ~300k km2 behind. The graph below shows 2018 NH ice extents since day 1, with and without the Pacific basins Bering and Okhotsk, compared to 11 year averages (2007 to 2017 inclusive).
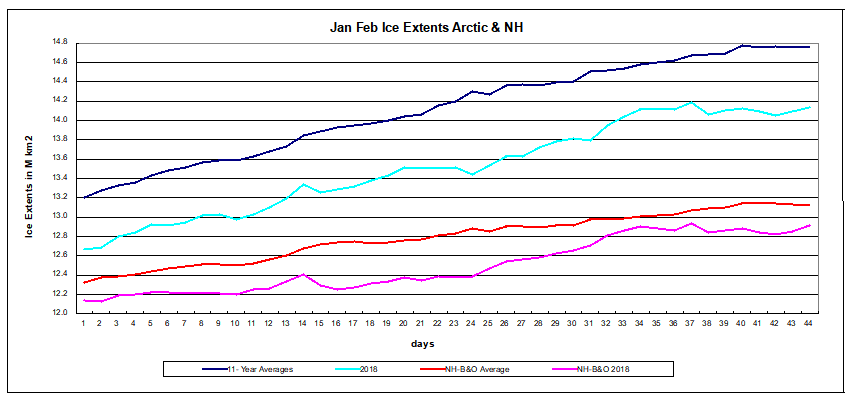 Clearly the deficit to average is mostly due to B&O, and as the table below shows, mostly Bering at this point.
| Region | 2018044 | Day 044 Average |
2018-Ave. | 2017044 | 2018-2017 |
| (0) Northern_Hemisphere | 14140166 | 14756619 | -616453 | 14287848 | -147682 |
| (1) Beaufort_Sea | 1070445 | 1070178 | 267 | 1070445 | 0 |
| (2) Chukchi_Sea | 965971 | 965614 | 357 | 966006 | -35 |
| (3) East_Siberian_Sea | 1087120 | 1087134 | -14 | 1087137 | -18 |
| (4) Laptev_Sea | 897845 | 897842 | 3 | 897845 | 0 |
| (5) Kara_Sea | 874714 | 906136 | -31422 | 908380 | -33666 |
| (6) Barents_Sea | 465024 | 567976 | -102952 | 363927 | 101097 |
| (7) Greenland_Sea | 529094 | 630790 | -101696 | 565090 | -35996 |
| (8) Baffin_Bay_Gulf_of_St._Lawrence | 1655681 | 1483847 | 171834 | 1564353 | 91328 |
| (9) Canadian_Archipelago | 853109 | 853029 | 80 | 853214 | -106 |
| (10) Hudson_Bay | 1260838 | 1260792 | 46 | 1260903 | -66 |
| (11) Central_Arctic | 3117143 | 3218063 | -100920 | 3209792 | -92649 |
| (12) Bering_Sea | 319927 | 730017 | -410090 | 564241 | -244314 |
| (13) Baltic_Sea | 76404 | 105038 | -28634 | 59994 | 16410 |
| (14) Sea_of_Okhotsk | 911105 | 906055 | 5050 | 834828 | 76277 |
The large deficit comes from Bering Sea, while Okhotsk is matching average, and Barents has grown recently. Greenland Sea and Central Arctic are down to a lesser extent, nearly offset by Baffin surpluses. A month remains to reach annual maximum with the standard this decade being about 15M km2. For perspective, 2018 has to gain about 6% by mid March to reach 15M and gain 4% to reach 14.78, last year’s maximum. It should also be remembered that all of these dancing basins will likely melt out by September as usual.

