
Note: This Analysis was updated with 2019 statistics in the post 2020 Update: Fossil Fuels ≠ Global Warming
Previous posts addressed the claim that fossil fuels are driving global warming. This post updates that analysis with the latest (2016) numbers from BP Statistics and compares World Fossil Fuel Consumption (WFFC) with three estimates of Global Mean Temperature (GMT). More on both these variables below.
WFFC
2016 statistics are now available from BP for international consumption of Primary Energy sources. Statistical Review of World Energy. 2017 numbers should be available this summer.
The reporting categories are:
Oil
Natural Gas
Coal
Nuclear
Hydro
Renewables (other than hydro)
This analysis combines the first three, Oil, Gas, and Coal for total fossil fuel consumption world wide. The chart below shows the patterns for WFFC compared to world consumption of Primary Energy from 1965 through 2016.
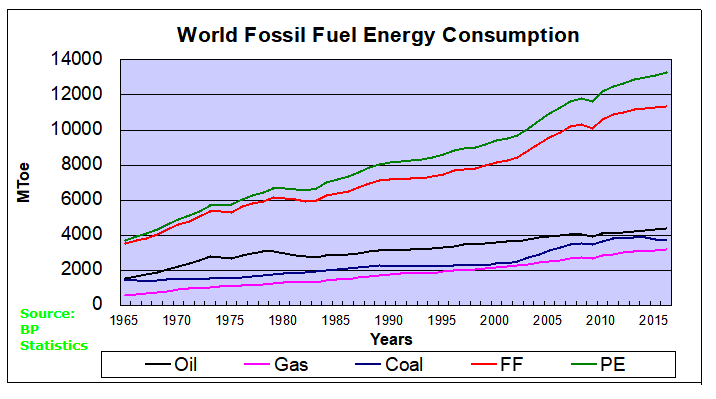
The graph shows that Primary Energy consumption has grown continuously for 5 decades. Over that period oil, gas and coal (sometimes termed “Thermal”) averaged 90% of PE consumed, ranging from 94% in 1965 to 86% in 2016. MToe is millions of tons of oil equivalents.
Global Mean Temperatures
Everyone acknowledges that GMT is a fiction since temperature is an intrinsic property of objects, and varies dramatically over time and over the surface of the earth. No place on earth determines “average” temperature for the globe. Yet for the purpose of detecting change in temperature, major climate data sets estimate GMT and report anomalies from it.
UAH record consists of satellite era global temperature estimates for the lower troposphere, a layer of air from 0 to 4km above the surface. HadSST estimates sea surface temperatures from oceans covering 71% of the planet. HADCRUT combines HadSST estimates with records from land stations whose elevations range up to 6km above sea level.
Both GISS LOTI (land and ocean) and HADCRUT4 (land and ocean) use 14.0 Celsius as the climate normal, so I will add that number back into the anomalies. This is done not claiming any validity other than to achieve a reasonable measure of magnitude regarding the observed fluctuations.
No doubt global sea surface temperatures are typically higher than 14C, more like 17 or 18C, and of course warmer in the tropics and colder at higher latitudes. Likewise, the lapse rate in the atmosphere means that air temperatures both from satellites and elevated land stations will range colder than 14C. Still, that climate normal is a generally accepted indicator of GMT.
Correlations of GMT and WFFC
The next graph compares WFFC to GMT estimates over the five decades from 1965 to 2016 from HADCRUT4, which includes HadSST3.

Over the last five decades the increase in fossil fuel consumption is dramatic and monotonic, steadily increasing by 223% from 3.5B to 11.4 B oil equivalent tons. Meanwhile the GMT record from Hadcrut shows multiple ups and downs with an accumulated rise of 0.9C over 51 years, 7% of the starting value.
The second graph compares to GMT estimates from UAH6, and HadSST3 for the satellite era from 1979 to 2016, a period of 37 years.

In the satellite era WFFC has increased at a compounded rate of nearly 2% per year, for a total increase of 84% since 1979. At the same time, SST warming amounted to 0.55C, or 3.9% of the starting value. UAH warming was 0.72, or 5.5% up from 1979. The temperature compounded rate of change is 0.1% per year, an order of magnitude less. Even more obvious is the 1998 El Nino peak and flat GMT since.
Summary
The climate alarmist/activist claim is straight forward: Burning fossil fuels makes measured temperatures warmer. The Paris Accord further asserts that by reducing human use of fossil fuels, further warming can be prevented. Those claims do not bear up under scrutiny.
It is enough for simple minds to see that two time series are both rising and to think that one must be causing the other. But both scientific and legal methods assert causation only when the two variables are both strongly and consistently aligned. The above shows a weak and inconsistent linkage between WFFC and GMT.
Going further back in history shows even weaker correlation between fossil fuels consumption and global temperature estimates:

Figure 5.1. Comparative dynamics of the World Fuel Consumption (WFC) and Global Surface Air Temperature Anomaly (ΔT), 1861-2000. The thin dashed line represents annual ΔT, the bold line—its 13-year smoothing, and the line constructed from rectangles—WFC (in millions of tons of nominal fuel) (Klyashtorin and Lyubushin, 2003). Source: Frolov et al. 2009
In legal terms, as long as there is another equally or more likely explanation for the set of facts, the claimed causation is unproven. The more likely explanation is that global temperatures vary due to oceanic and solar cycles. The proof is clearly and thoroughly set forward in the post Quantifying Natural Climate Change.
Background context for today’s post is at Claim: Fossil Fuels Cause Global Warming.


Reblogged this on Climate Collections.
LikeLike
I like this comparison. My first thought though, was how much CO2 comes from each source when consumed? This may be impossible to determine, e.g. for Oil, I assume that includes all the uses for the distillates produced. I do not think that CO2 has much if any real effect, but it is the bogeyman for the alarmists, they need CO2.
LikeLike
Thanks i2choose (nice handle) for commenting. There are many uncertainties with emissions accounting. First is the consumption of the fuel estimated by logging changes in inventories. Then as you point out, different processing methods produce differing amounts of CO2 and other gases. And the warming potential is also a guesstimate.
Everything about the uncertainty in measuring emissions from fuel consumption.
Click to access ghg-uncertainty.pdf
Buried in the notes of the above document:
“Note that the uncertainty of the global warming potential (GWP) for the six GHG Protocol gasses is
assumed to be ± 35% for the 90% confidence interval (see Section 7.2).”
LikeLiked by 1 person