Click on image to enlarge.
The most obvious Arctic ice feature this year has been the shrinkage in the Pacific basins, especially Bering Sea (on the right). The image shows extents on day 104 from the decadal high in 2012 to 2018 (yesterday). Bering has only 200k km2 mid April 2018 compared to 1100k km2 six years ago. On the left, Okhotsk has gone through ups and downs, but 2018 is comparable to 2012. It appears Bering is dominated by Northeast Pacific warming, whose effects are moderated in Okhotsk by Siberian conditions.
This is evident in the current nullschool simulation of wind patterns in the region (link to animation):
https://earth.nullschool.net/#current/wind/surface/level/orthographic=-182.77,53.61,1130/loc=-167.641,51.083

On the European side, Barents continues to show more ice than in recent years. Ice in Barents Sea has retreated lately, but extent there is still above average and slightly larger than 2014,the iciest year. As the graph shows 2017 came on late in Spring to surpass 2014 for awhile.
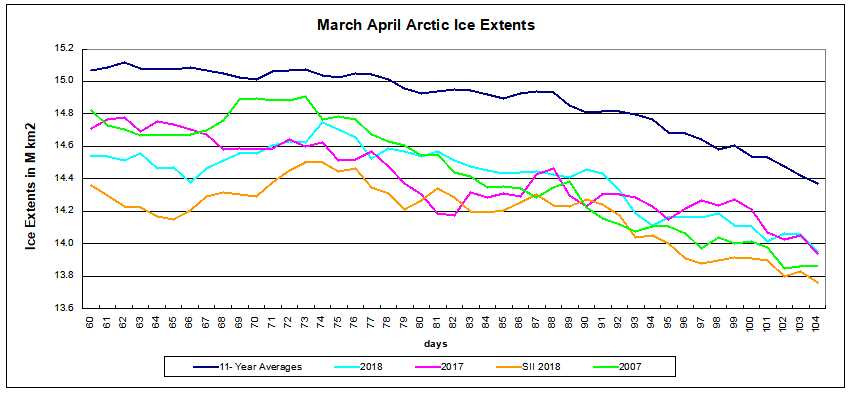
The graph below shows how Arctic extent over the last six weeks compared to the 11 year average and to some years of interest.

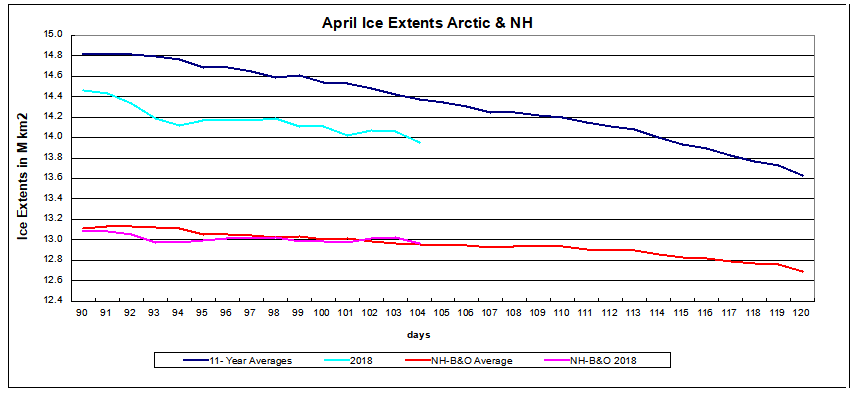
Note the average max on day 62 and 2018 max on day 74. In recent weeks 2018 is matching 2017 and slightly higher than 2007. SII (NOAA) continues to show ~200k km2 less extent. The graph below shows that the deficit to average is entirely due to Bering and Okhotsk Seas, since removing those two basins eliminates the shortfall.
The table below confirms that the core Arctic ice remains firmly in place.
| Region | 2018104 | Day 104 Average |
2018-Ave. | 2007104 | 2018-2017 |
| (0) Northern_Hemisphere | 13956065 | 14373298 | -417234 | 13862996 | 93068 |
| (1) Beaufort_Sea | 1070445 | 1068880 | 1565 | 1058157 | 12288 |
| (2) Chukchi_Sea | 962477 | 965131 | -2654 | 960944 | 1532 |
| (3) East_Siberian_Sea | 1087137 | 1085763 | 1374 | 1074001 | 13136 |
| (4) Laptev_Sea | 897845 | 894331 | 3514 | 866524 | 31321 |
| (5) Kara_Sea | 934919 | 925323 | 9596 | 912398 | 22521 |
| (6) Barents_Sea | 708699 | 609715 | 98984 | 521344 | 187355 |
| (7) Greenland_Sea | 575274 | 663379 | -88104 | 691751 | -116477 |
| (8) Baffin_Bay_Gulf_of_St._Lawrence | 1340040 | 1352819 | -12779 | 1222152 | 117888 |
| (9) Canadian_Archipelago | 853109 | 852426 | 683 | 846282 | 6827 |
| (10) Hudson_Bay | 1260022 | 1245760 | 14263 | 1212987 | 47035 |
| (11) Central_Arctic | 3200334 | 3238761 | -38426 | 3245148 | -44813 |
| (12) Bering_Sea | 189180 | 780469 | -591289 | 645687 | -456507 |
| (13) Baltic_Sea | 68363 | 44683 | 23681 | 20075 | 48289 |
| (14) Sea_of_Okhotsk | 805400 | 639794 | 165606 | 576913 | 228487 |
The overall deficit is~3%, entirely due to Bering Sea. Okhotsk and Barents are above average, but not enough to offset lack of ice in Bering.

Drift ice in Okhotsk Sea at sunrise.


Reblogged this on Climate Collections.
LikeLike
I’m puzzled by the persistent warmth of the N. Pacific, basically since the beginning of the 2nd maximum of the present solar cycle in 2014.
Why is it persisting for such a long period? Isn’t the N. Pacific supposed to be in a cool PDO phase since 2008?
LikeLike
Dmh, I rely on Dr. Judah Cohen’s explanations of the Arctic Oscillation cycles. That is a fluctuating wind regime which impacts the polar vortex to be either stable or wandering. A key feature of his analysis is the appearance of a high pressure ridge over Alaska. As the nullschool animation shows, there is a rather strong gyre sitting over Bering Sea pulling up warmer southern air and water, leading to melting conditions there.
LikeLike