In the last nine days, sea ice in Barents persists, remaining above 700k km2, well above the decadal average and the previously high 2014. The melting is confined mostly to Bering Sea on the Pacific side, and less so in Okhotsk next door.
The April pattern of ice extent decline is shown in graph below:
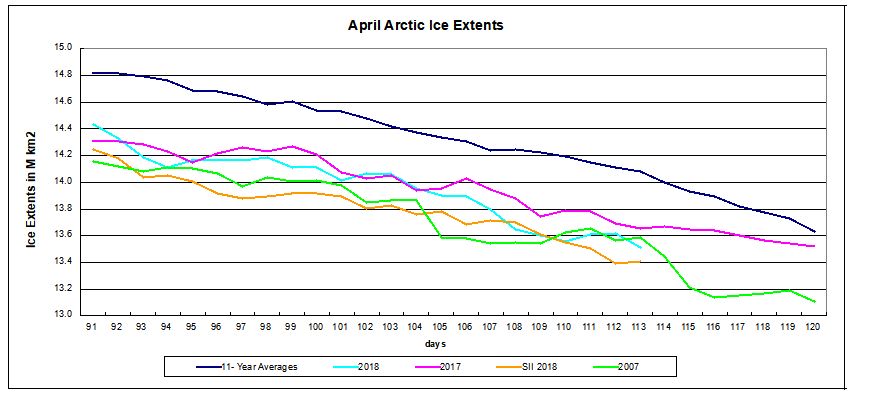
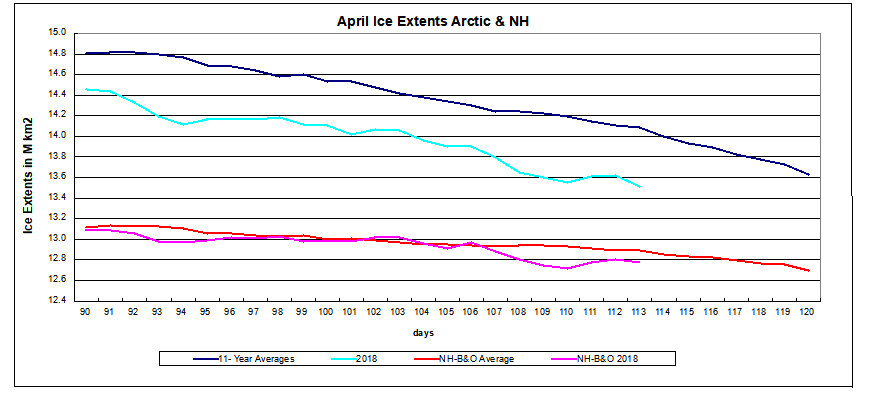
2018 is tracking close to 2007 and 2017, all more than 400k km2 below the 11 year average (2007 through 2017 inclusive). SII is showing ~200k km2 less ice throughout. The graph below shows 2018 ice extent is close to the decadal average, except for Bering and Okhotsk Seas, the two Pacific basins.
The table below shows regional ice extents on day 113 comparing to decadal averages and 2017.
| Region | 2018113 | Day 113 Average |
2018-Ave. | 2017113 | 2018-2017 |
| (0) Northern_Hemisphere | 13515699 | 14083321 | -567621 | 13651810 | -136111 |
| (1) Beaufort_Sea | 1070445 | 1069106 | 1339 | 1070445 | 0 |
| (2) Chukchi_Sea | 954262 | 965239 | -10977 | 961723 | -7461 |
| (3) East_Siberian_Sea | 1086737 | 1086195 | 542 | 1083967 | 2770 |
| (4) Laptev_Sea | 897845 | 894453 | 3392 | 897326 | 518 |
| (5) Kara_Sea | 934867 | 916778 | 18090 | 932153 | 2715 |
| (6) Barents_Sea | 724756 | 572825 | 151931 | 546422 | 178334 |
| (7) Greenland_Sea | 516420 | 670606 | -154186 | 673722 | -157302 |
| (8) Baffin_Bay_Gulf_of_St._Lawrence | 1239506 | 1338185 | -98679 | 1444616 | -205110 |
| (9) Canadian_Archipelago | 853109 | 850093 | 3015 | 853214 | -106 |
| (10) Hudson_Bay | 1244858 | 1252135 | -7277 | 1258453 | -13595 |
| (11) Central_Arctic | 3208617 | 3242368 | -33751 | 3245713 | -37096 |
| (12) Bering_Sea | 88256 | 689111 | -600856 | 374254 | -285998 |
| (13) Baltic_Sea | 44869 | 32599 | 12270 | 23289 | 21579 |
| (14) Sea_of_Okhotsk | 648464 | 499591 | 148873 | 283164 | 365300 |
Overall, the 2018 deficit to average is 4%, or 570 k km2. The difference is entirely due to open water in Bering Sea, now a deficit of 600k km2 (down by 90%). Barents and Okhotsk are both above average, by ~30% with Greenland Sea down about 20%. It remains to be seen how fast or slow will be the melting of the Arctic core regions, solidly frozen at this point in the year.
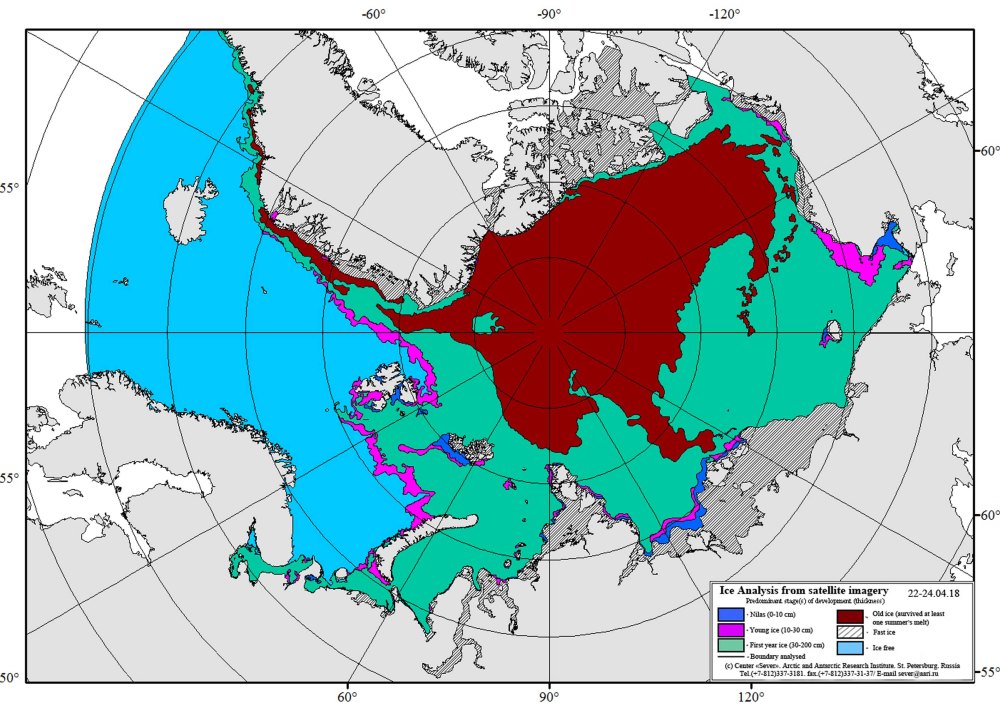
Current Arctic ice conditions according to AARI, St. Petersburg, Russia. Old ice shown in brown.
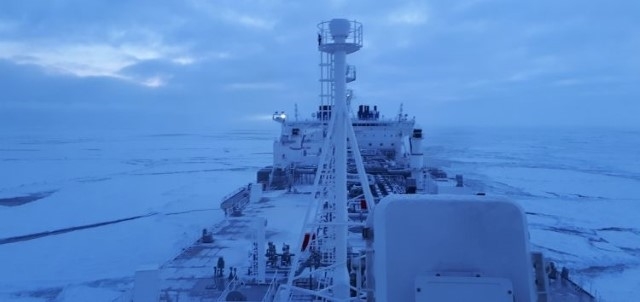
Boris Vilkitsky, the 172,000 m3 Arc7 ice-class LNG carrier, violated a number of safety rules on a ballast voyage to Yamal LNG terminal in the Russian High Arctic port of Sabetta earlier in April.
An Arc4 rating effectively prohibits the ship from operating independently or even with an icebreaker escort in the waters of the Kara Sea when ice conditions are medium to heavy. Roshydromet, Russia’s Federal Service for Hydrometeorology and Environmental Monitoring, has reported recently that first-year ice in the region is up to 2 metres thick.
Image from 4 days ago, source LNGworldshipping.

Ron,
On a completely different matter, I have read somewhere the total human/vehicle/industry output of CO2 is only a small percentage of natural output. Do you know where I could get this estimate from?
Regards,
Graeme Weber
LikeLike
Graeme, try these
https://rclutz.wordpress.com/2017/05/24/not-worried-about-co2/
https://rclutz.wordpress.com/2017/11/17/co2-fluxes-sources-and-sinks/
LikeLike