Sea Ice Thickness and Volume from DMI. H/T NoTricksZone
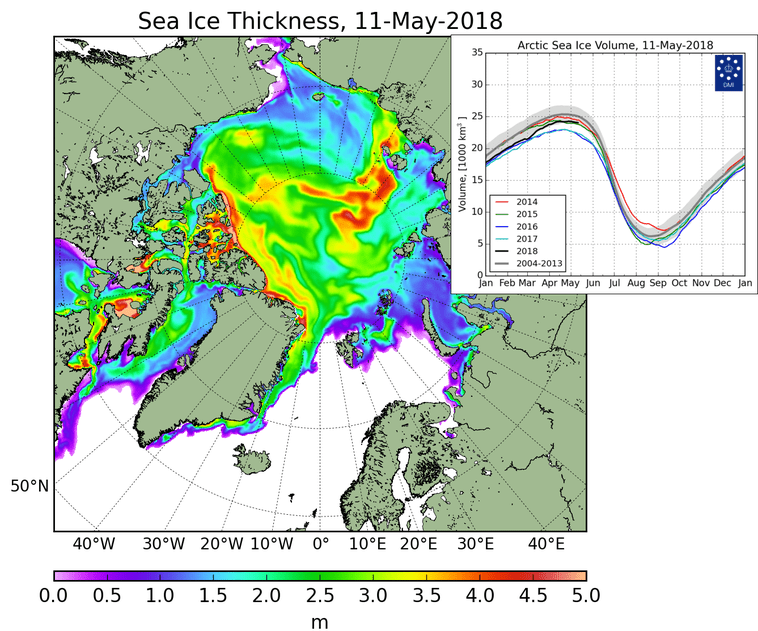
In May, ice extents are declining as usual, except for the early melting in Bering Sea. The image above from DMI shows widespread thick ice across the Arctic core, likely to melt more slowly. The graph above shows how much volume was added since March 2018, bringing it close to 2014, a particularly icy year.
The graph below shows how the Arctic extent from MASIE has faired the last 26 days up to yesterday, compared to the 11 year average and to some years of interest.
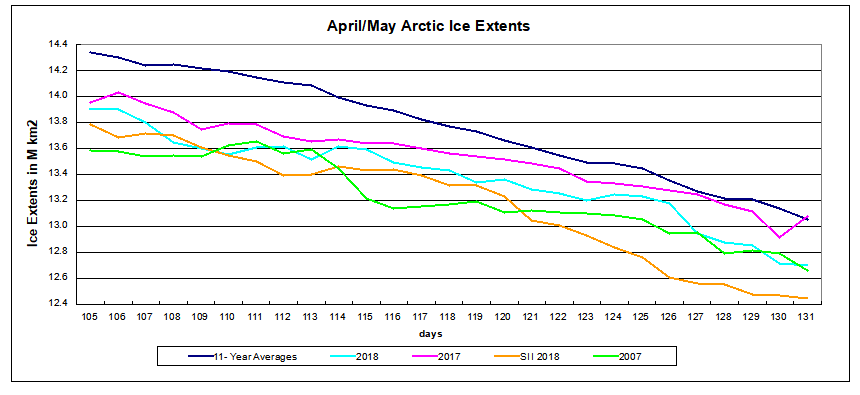
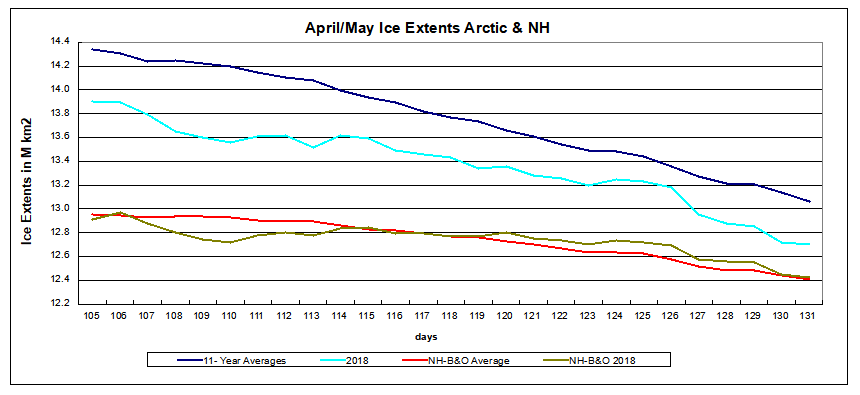
Note that 2017 is now matching the 11-year average, while 2018 and 2007 are tied ~360k km2 below average. SII 2018 is tracking ~250k km2 lower at this point. The graph below shows 2018 ice extents are matching the 11 year average once Bering and Okhotsk are excluded from the calculations.
The table shows regional ice extents compared to average and 2017.
| Region | 2018131 | Day 131 Average |
2018-Ave. | 2017131 | 2018-2017 |
| (0) Northern_Hemisphere | 12701360 | 13058129 | -356769 | 13075378 | -374017 |
| (1) Beaufort_Sea | 1070445 | 1047690 | 22755 | 1059451 | 10994 |
| (2) Chukchi_Sea | 890598 | 950844 | -60246 | 938716 | -48117 |
| (3) East_Siberian_Sea | 1087048 | 1083143 | 3906 | 1073762 | 13286 |
| (4) Laptev_Sea | 896588 | 889502 | 7087 | 897845 | -1256 |
| (5) Kara_Sea | 925975 | 903277 | 22698 | 929156 | -3182 |
| (6) Barents_Sea | 530424 | 452492 | 77931 | 505439 | 24984 |
| (7) Greenland_Sea | 460748 | 638101 | -177353 | 710167 | -249419 |
| (8) Baffin_Bay_Gulf_of_St._Lawrence | 1264692 | 1146815 | 117877 | 1312382 | -47690 |
| (9) Canadian_Archipelago | 853109 | 844456 | 8653 | 851119 | 1990 |
| (10) Hudson_Bay | 1255514 | 1207449 | 48065 | 1247480 | 8034 |
| (11) Central_Arctic | 3173427 | 3233754 | -60327 | 3248013 | -74586 |
| (12) Bering_Sea | 37974 | 412141 | -374167 | 136049 | -98075 |
| (13) Baltic_Sea | 16848 | 9483 | 7365 | 11830 | 5018 |
| (14) Sea_of_Okhotsk | 236246 | 236354 | -108 | 152156 | 84090 |
Note the Bering accounts for the 2018 deficit to average. Chukchi and Greenland Seas are down somewhat, but offset by surpluses in Baffin Bay, Barents and Hudson Bay. Compared to last year, the Bering deficit is much less, but Greenland Sea difference is much greater.
The Pacific basins of Bering and Okhotsk are the first to lose ice, and it will be interesting to see how the core Arctic Seas hold up this summer. Barents is still up, but less dramatically than in April. Chukchi is starting to open up, perhaps influenced by Bering.


Reblogged this on Climate Collections and commented:
Note Sea Ice Volume.
LikeLike