Answers Before Climate Action

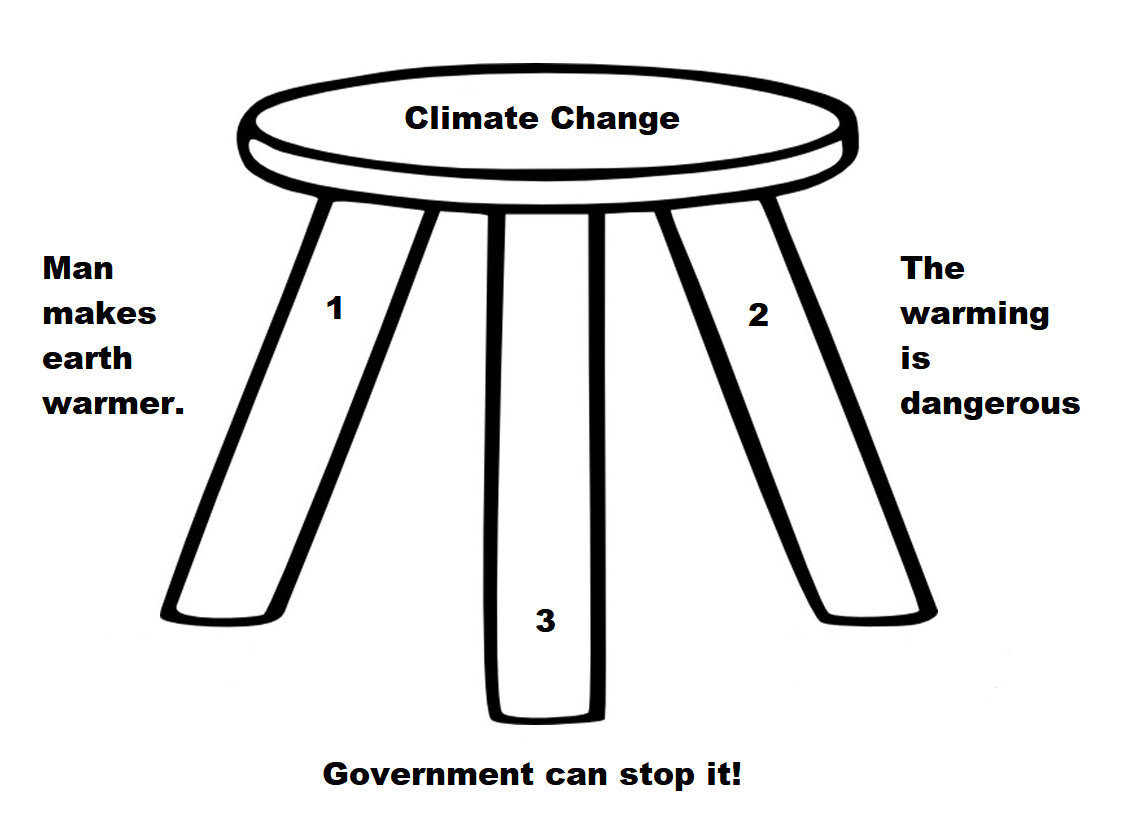
As the stool above shows, the climate change package sits on three premises. The first is the science bit, consisting of an unproven claim that observed warming is caused by humans burning fossil fuels. The second part rests on impact studies from billions of research dollars spent uncovering any and all possible negatives from warming. And the third leg is climate policies showing how governments can “fight climate change.”

The call for climate action depends on proponents providing convincing answers to questions regarding all three dimensions.  H/T to Master Resource for pointing to essays by William Niskonen and Steven Horwitz setting forth the issues to be resolved.  I will refer to excerpts from Global Warming Is about Social Science Too by Horowitz.

To help clarify what’s at stake, I offer a list of questions that are (or should be) at the center of the debate over anthropogenic (human-caused) global warming. I will provide some quick commentary on some to note their importance and then conclude with what I see as the importance of this list.

Matters of Science

1. Is the planet getting warmer?

2. If it’s getting warmer, is that warming caused by humans? Obviously this is a big question because if warming is not human-caused, then it’s not clear how much we can do to reduce it. What we might do about the consequences, however, remains an open question.

3. If it’s getting warmer, by what magnitude? If the magnitude is large, then there’s one set of implications. But if it’s small, then, as we’ll see, it might not be worth responding to. This is a good example of a scientific question with large implications for policy.

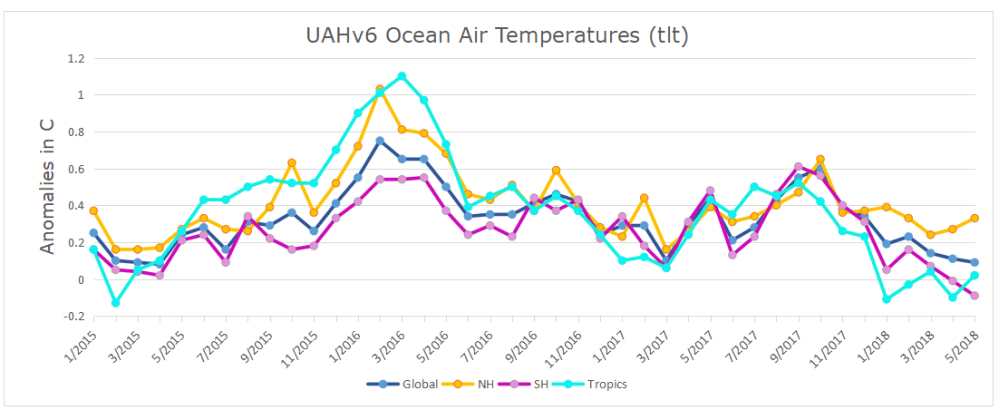
My Comment:  Most people studying climate science agree that it has warmed about a degree celsius since the end of the Little Ice Age (~1850).  But there have been multi-decadal periods of warming and cooling as well as the current plateau in temperatures.  As well, there are many places (e.g.almost 1/3 of US stations) showing cooling while other places have warming trends.  Skeptics note that no one has yet separated natural warming from man-made warming.  In the record, natural warming prior to the 1940s matches almost exactly the warming from 1970s to 2000, claimed to be man-made.

Horowitz continues: All these questions are presumably matters of science. In principle we ought to be able to answer them using the tools of science, even if they are complex issues that involve competing interpretations and methods. Let’s assume the planet is in fact warming and that humans are the reason.

Impacts of Warming

4. What are the costs of global warming? This question is frequently asked and answered.

5. What are the benefits of global warming? This question needs to be asked as well, as global warming might bring currently arctic areas into a more temperate climate that would enable them to become sources of food. Plus, a warmer planet might decrease the demand for fossil fuels for heating homes and businesses in those formerly colder places.

6. Do the benefits outweigh the costs or do the costs outweigh the benefits? This is also not frequently asked. Obviously, if the benefits outweigh the costs, then we shouldn’t be worrying about global warming. Two other points are worth considering. First, the benefits and costs are not questions of scientific fact because how we do the accounting depends on all kinds of value-laden questions. But that doesn’t mean the cost-benefit comparison isn’t important. Second, this question might depend greatly on the answers to the scientific questions above. In other words: All questions of public policy are ones that require both facts and values to answer. One cannot go directly from science to policy without asking the kinds of questions I’ve raised here.

Rotterdam Adaptation Policy–Ninety years thriving behind dikes and dams.

Climate Policies

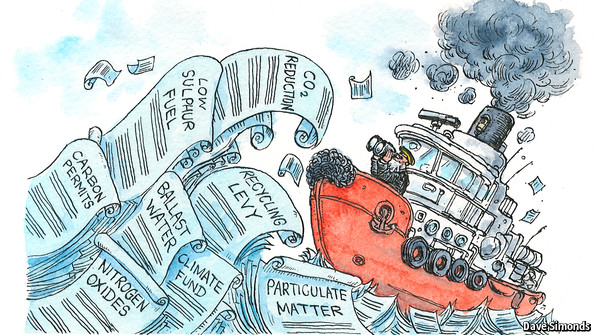
7. If the costs outweigh the benefits, what sorts of policies are appropriate? There are many too many questions here to deal with in detail, but it should be noted that disagreements over what sorts of policies would best deal with the net costs of global warming are, again, matters of both fact and value, or science and social science.

8. What are the costs of the policies designed to reduce the costs of global warming? This question is not asked nearly enough. Even if we design policies on the blackboard that seem to mitigate the effects of global warming, we have to consider, first, whether those policies are even likely to be passed by politicians as we know them, and second, whether the policies might have associated costs that outweigh their benefits with respect to global warming. So if in our attempt to reduce the effects of global warming we slow economic growth so far as to impoverish more people, or we give powers to governments that are likely to be used in ways having little to do with global warming, we have to consider those results in the total costs and benefits of using policy to combat global warming. This is a question of social science that is no less important than the scientific questions I began with.

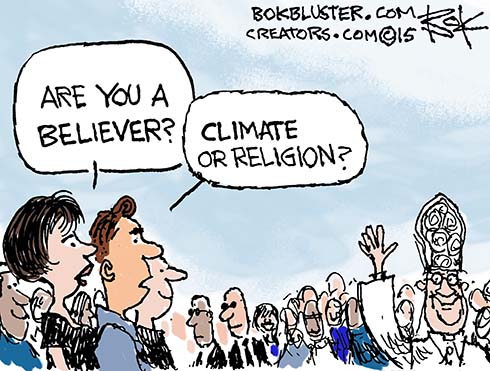
I could add more, but this is sufficient to make my key points. First, it is perfectly possible to accept the science of global warming but reject the policies most often put forward to combat it. One can think humans are causing the planet to warm but logically and humanely conclude that we should do nothing about it.

Second, people who take that position and back it up with good arguments should not be called “deniers.” They are not denying the science; they are questioning its implications. In fact, those who think they can go directly from science to policy are, as it turns out, engaged in denial – denial of the relevance of social science.

Steven Horwitz is the Schnatter Distinguished Professor of Free Enterprise in the Department of Economics at Ball State University, where he also is a Fellow at the John H. Schnatter Institute for Entrepreneurship and Free Enterprise. He is the author of Hayek’s Modern Family: Classical Liberalism and the Evolution of Social Institutions.

Climate science, impacts and policies also appear as a house of cards.

More about Climate Policy Failures

Speaking Climate Truth to Policymakers

Climate Policies Failure, the Movie

Climatists Wrong-Footed

May 2018 Ocean Cooling On Hold

globpop_countries
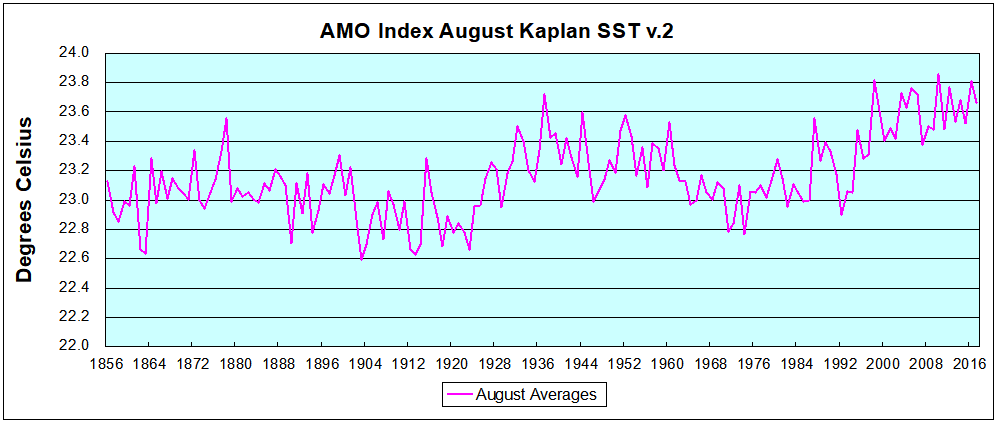
The best context for understanding decadal temperature changes comes from the world’s sea surface temperatures (SST), for several reasons:

  • The ocean covers 71% of the globe and drives average temperatures;
  • SSTs have a constant water content, (unlike air temperatures), so give a better reading of heat content variations;
  • A major El Nino was the dominant climate feature in recent years.

HadSST is generally regarded as the best of the global SST data sets, and so the temperature story here comes from that source, the latest version being HadSST3.  More on what distinguishes HadSST3 from other SST products at the end.

The Current Context

The chart below shows SST monthly anomalies as reported in HadSST3 starting in 2015 through May 2018.

Hadsst052018

Open image in new tab to enlarge.

A global cooling pattern has persisted, seen clearly in the Tropics since its peak in 2016, joined by NH and SH dropping since last August. Upward bumps occurred last October, in January and again in March and April 2018.  Five months of 2018 now show slight warming since the low point of December 2017, led by steadily rising NH. May 2018  temps in all regions are slightly lower than 5/2015, except for the Tropics being much lower. Since 4/2018 SH and Tropics cooled slightly while NH pulled the Global anomaly upwards.

Note that higher temps in 2015 and 2016 were first of all due to a sharp rise in Tropical SST, beginning in March 2015, peaking in January 2016, and steadily declining back below its beginning level. Secondly, the Northern Hemisphere added three bumps on the shoulders of Tropical warming, with peaks in August of each year. Also, note that the global release of heat was not dramatic, due to the Southern Hemisphere offsetting the Northern one.

With ocean temps positioned the same as three years ago, we can only wait and see whether the previous cycle will repeat or something different appears.  As the analysis belows shows, the North Atlantic has been the wild card bringing warming this decade, and cooling will depend upon a phase shift in that region.

A longer view of SSTs

The graph below  is noisy, but the density is needed to see the seasonal patterns in the oceanic fluctuations.  Previous posts focused on the rise and fall of the last El Nino starting in 2015.  This post adds a longer view, encompassing the significant 1998 El Nino and since.  The color schemes are retained for Global, Tropics, NH and SH anomalies.  Despite the longer time frame, I have kept the monthly data (rather than yearly averages) because of interesting shifts between January and July.

Hadsst1995to2018

Open image in new tab to enlarge.

1995 is a reasonable starting point prior to the first El Nino.  The sharp Tropical rise peaking in 1998 is dominant in the record, starting Jan. ’97 to pull up SSTs uniformly before returning to the same level Jan. ’99.  For the next 2 years, the Tropics stayed down, and the world’s oceans held steady around 0.2C above 1961 to 1990 average.

Then comes a steady rise over two years to a lesser peak Jan. 2003, but again uniformly pulling all oceans up around 0.4C.  Something changes at this point, with more hemispheric divergence than before. Over the 4 years until Jan 2007, the Tropics go through ups and downs, NH a series of ups and SH mostly downs.  As a result the Global average fluctuates around that same 0.4C, which also turns out to be the average for the entire record since 1995.

2007 stands out with a sharp drop in temperatures so that Jan.08 matches the low in Jan. ’99, but starting from a lower high. The oceans all decline as well, until temps build peaking in 2010.

Now again a different pattern appears.  The Tropics cool sharply to Jan 11, then rise steadily for 4 years to Jan 15, at which point the most recent major El Nino takes off.  But this time in contrast to ’97-’99, the Northern Hemisphere produces peaks every summer pulling up the Global average.  In fact, these NH peaks appear every July starting in 2003, growing stronger to produce 3 massive highs in 2014, 15 and 16, with July 2017 only slightly lower.  Note also that starting in 2014 SH plays a moderating role, offsetting the NH warming pulses. (Note: these are high anomalies on top of the highest absolute temps in the NH.)

What to make of all this? The patterns suggest that in addition to El Ninos in the Pacific driving the Tropic SSTs, something else is going on in the NH.  The obvious culprit is the North Atlantic, since I have seen this sort of pulsing before.  After reading some papers by David Dilley, I confirmed his observation of Atlantic pulses into the Arctic every 8 to 10 years as shown by this graph:

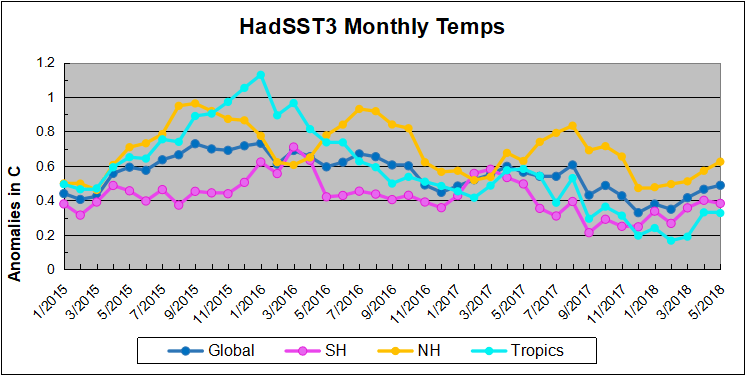
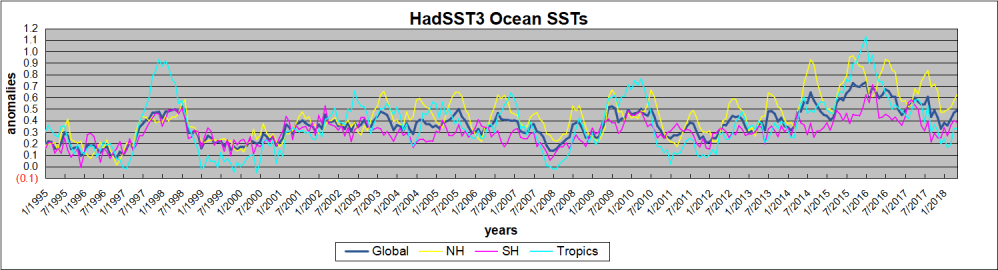
The data is annual averages of absolute SSTs measured in the North Atlantic.  The significance of the pulses for weather forecasting is discussed in AMO: Atlantic Climate Pulse

But the peaks coming nearly every July in HadSST require a different picture.  Let’s look at August, the hottest month in the North Atlantic from the Kaplan dataset.Now the regime shift appears clearly. Starting with 2003, seven times the August average has exceeded 23.6C, a level that prior to ’98 registered only once before, in 1937.  And other recent years were all greater than 23.4C.

Summary

The oceans are driving the warming this century.  SSTs took a step up with the 1998 El Nino and have stayed there with help from the North Atlantic, and more recently the Pacific northern “Blob.”  The ocean surfaces are releasing a lot of energy, warming the air, but eventually will have a cooling effect.  The decline after 1937 was rapid by comparison, so one wonders: How long can the oceans keep this up?

To paraphrase the wheel of fortune carnival barker:  “Down and down she goes, where she stops nobody knows.”  As this month shows, nature moves in cycles, not straight lines, and human forecasts and projections are tenuous at best.

einsteinalbert-integratesempirically800px

Postscript:

In the most recent GWPF 2017 State of the Climate report, Dr. Humlum made this observation:

“It is instructive to consider the variation of the annual change rate of atmospheric CO2 together with the annual change rates for the global air temperature and global sea surface temperature (Figure 16). All three change rates clearly vary in concert, but with sea surface temperature rates leading the global temperature rates by a few months and atmospheric CO2 rates lagging 11–12 months behind the sea surface temperature rates.”

Footnote: Why Rely on HadSST3

HadSST3 is distinguished from other SST products because HadCRU (Hadley Climatic Research Unit) does not engage in SST interpolation, i.e. infilling estimated anomalies into grid cells lacking sufficient sampling in a given month. From reading the documentation and from queries to Met Office, this is their procedure.

HadSST3 imports data from gridcells containing ocean, excluding land cells. From past records, they have calculated daily and monthly average readings for each grid cell for the period 1961 to 1990. Those temperatures form the baseline from which anomalies are calculated.

In a given month, each gridcell with sufficient sampling is averaged for the month and then the baseline value for that cell and that month is subtracted, resulting in the monthly anomaly for that cell. All cells with monthly anomalies are averaged to produce global, hemispheric and tropical anomalies for the month, based on the cells in those locations. For example, Tropics averages include ocean grid cells lying between latitudes 20N and 20S.

Gridcells lacking sufficient sampling that month are left out of the averaging, and the uncertainty from such missing data is estimated. IMO that is more reasonable than inventing data to infill. And it seems that the Global Drifter Array displayed in the top image is providing more uniform coverage of the oceans than in the past.

uss-pearl-harbor-deploys-global-drifter-buoys-in-pacific-ocean

USS Pearl Harbor deploys Global Drifter Buoys in Pacific Ocean


Ice Alive: Uncovering the secrets of Earth’s Ice

You have to respect glaciologists whose curiosity takes them to the most extreme places, in this case the Arctic.  Joseph Cook received the Rolex award for Science in Extremis and he provides at his blog a wonderful 20 minute video explaining his work.  From Ice Alive: Uncovering the secrets of Earth’s Ice by Joseph Cook and Chris Hadfield.  Excerpts from below in italics.

In collaboration with Rolex Awards for Enterprise, Proudfoot Media and I have produced a documentary film explaining the latest research into the surprising hidden biology shaping Earth’s ice. The story is told by young UK Arctic scientists with contributions from guests including astronaut Chris Hadfield and biologist Jim Al-Khalili. We went to great lengths to make this a visually striking film that we hope is a pleasure to watch and communicates the otherwordly beauty and incredible complexity of the Arctic glacial landscape. We aim to educate, entertain and inspire others into exploring and protecting this most sensitive part of our planet in their own ways.

We think the film is equally suited to the general public as school and university students, and we are delighted to make this a free-to-all teaching resource. Please watch, share and use!

Albedo is the survival probability of a photon entering a medium. Light incident upon a material partly reflects from the upper surface, the remainder enters the medium and can scatter anywhere there is a change in the refractive index (e.g. a boundary between air and ice, or ice and water, etc). Where there are opportunities for scattering, light bounces around in the medium, sometimes preferentially in a certain direction depending upon the optical properties of the medium (ice is forward-scattering) but always changing direction to some extent each time it scatters, until it is either absorbed or it escapes back out of the medium travelling in a skywards direction.

The albedo of the material is the likelihood that the down-welling light entering the medium exits again later as up-welling light. The more strongly absorbing the material, the more likely the light is to be absorbed before exiting. Ice is very weakly absorbing in blue wavelengths (~400 nm), becoming generally more strongly absorbing at longer wavelengths into the near infra-red (hence ice often appearing blue). Solar energy is mostly concentrated within the wavelength range 300 – 5000 nm and the term albedo concerns the survival probability of all photons with wavelengths within this range either at a particular wavelength (spectral albedo) or integrated over the entire solar spectrum (broadband albedo).

For a single material, its absorbing and scattering efficiencies are described using the scattering and absorption coefficients. The ratio of these two coefficients is known as the single scattering albedo (SSA), which is a crucial term for radiative transfer. A higher SSA is associated with a greater likelihood of a particle scattering a photon rather than absorbing it. a particle with SSA = 1 is non-absorbing.

Algal cells are strongly absorbing and their effect on snow and ice albedo is to increase the likelihood of a photon being absorbed rather than scattered back out of the medium. For this reason, the better term to use would be bio-co-albedo, where co-albedo describes the fraction of incident energy absorbed by the particles (i.e. 1-SSA).

Albedo is a primary driver of snow melt. For clean snow and snow with black carbon, radiative transfer models to an excellent job of simulating albedo, yet there remain aspects of snow albedo that are poorly understood. In particular current models do not take into account algal cells that grow and dramatically discolour ice in some places (except our 1-D BioSNICAR model) and few take into account changes in albedo over space and time.

This led me to wonder about using cellular automata as a mechanism for distributing albedo modelling using radiative transfer over three spatial dimensions and time, and also enabling a degree of stochasticity to be introduced to the modelling (which is certainly present in natural systems).

As an Arctic scientist I am privileged to be able to explore the coldest parts of our planet, making observations and measurements and helping others to understand how these areas function by writing papers and giving talks, lectures and writing for magazines and newspapers. But to truly understand an environment, we must also explore the intangible and immeasurable. To communicate it to diverse audiences, we must use not only facts and observations, but aesthetics and emotion. The piece above is a bridge connecting music and science – an effort to understand and communicate the hidden beauty, complexity and sensitivity of the Greenland Ice Sheet through sound. I hope that projects like this will bring new audiences to Arctic science, using music, art and aesthetics to pique their curiosity.

Footnote:

The video mentions algae as a positive feedback:  more warming>more algae>less albedo>more warming.  However, there are also negative feedbacks operating in summertime.  More warming>more open water>more evaporation>more clouds>less sunshine on the surface.  Also, more evaporation>more snowfall>whiter surface>higher albedo>less solar absorption.

More on sea ice dynamics: Climate on Ice: Ocean-Ice Dynamics


G7 Hypocrisy

Diplomacy has become the art of talking as though something is agreed and will happen, when in fact nothing has changed and nothing different will ensue. Trump did indeed blow up the G7 meeting because he insists on facing the facts of trade imbalances and the emptiness of virtue signaling. By not making the gesture of signing some insipid joint communique, he exposed the whole charade.

Liz Peek at the Hill explains in article Hypocritical France and Germany scold Trump; how dare they  Excerpts below in italics with my bolds

Emmanuel Macron is having a “crise de colere;” that’s French for hissy fit.

In the run-up to the Group of Seven (G-7) meeting, the French president joined with Germany’s Angela Merkel in warning that he would refuse to sign a joint statement from the G-7 unless the U.S. demonstrates a willingness to shift its position on the Iran nuclear agreement, the Paris Agreement and on tariffs. The nerve!

Let’s start with tariffs. As Commerce Secretary Wilbur Ross has written, the EU is quick to criticize the United States for not pursuing free trade, but at the same time, they charge higher tariffs than the U.S. in 17 of 22 major consumer goods categories.

On dairy products, fruits and vegetables, cereals, sugar, fish, chemicals, electrical machinery and many other goods, the EU charges import fees far above those levied by the U.S. What is the rationale for that imbalance? There is none. Europe is simply protecting its interests.

On autos, the EU imposes a 10-percent fee on imports from the U.S. while we reciprocate with a 2.5-percent charge. Again, why the difference? Why shouldn’t we help out our car manufacturers and workers just as the French and Germans help theirs?

It isn’t as though the U.S. has a built-in advantage. As Ross wrote, “Today Europe exports 1.14 million automobiles to the U.S., nearly four times as many as the U.S. exports to Europe.”

And, of course, the EU doesn’t rely on tariffs alone to jack up their trade surplus with the U.S. They also give their exporters enormous help with financing and impose other kinds of barriers to American goods, like obscure health standards and regulations.

In short, over the years they have tilted the playing field in their favor, and we have let them get away with it. Today, their protectionist measures help earn them a roughly $150 billion annual trade surplus; there is no plausible excuse for that.

As for the Iran deal, France and Germany are incensed that a seriously flawed agreement will be abandoned. They do not care, apparently, that Tehran’s mullahs have not lived up to the spirit of the deal, instead spending the billions received as part of the pact to foment unrest across the region.

Their pique is not because they believe that in return for being freed from sanctions, Tehran was about to emerge as a reliable actor for peace in the Middle East. No, they are miffed that their scramble to do business with Iran will have to wait.

Given the EU’s sluggish growth track, brought on in large part by dysfunctional work rules and regulations of the sort that President Trump has worked to eliminate in the U.S., they are desperate for access to new markets.

Even as President Trump ditched the Iran deal and threatened to re-impose sanctions, EU officials encouraged companies to power forward with commercial ties, so greedy are they for growth.

Already, however, many firms have decided the risk of running afoul of U.S. prohibitions is simply too great and have started to leave the country.

French company Total, the only major oil firm to re-engage in Iran, signed a $5 billion, 20-year agreement last year to develop a large natural gas field. It has announced it is withdrawing from the deal.

The Danish shipping company Moller-Maersk announced it would cease shipping Iranian oil; the company’s CEO said in a statement that its business with the U.S. was more important than operating in Iran. Peugeot and Siemens, similarly, have announced they would withdraw from Iran.

Germany and France are unhappy, too, about President Trump’s withdrawal from the Paris treaty. But their outrage is undeserved. In 2017, the U.S. reported the largest year-to-year drop in carbon emissions of any advanced economy, according to a report from the International Energy Agency.

In the same year, the EU saw emissions rise 1.5 percent. Greenhouse gases also rose in Asia. In fact, the only country making progress toward emissions reductions at this time is the U.S. So, bemoaning the decision by President Trump to withdraw from the cherished Paris Agreement would appear to be little more than diplomatic theater.

While berating the U.S., the French allowed their own carbon dioxide emissions to rise 3.6 percent over their targeted level last year. France has decided to mothball its clean nuclear power industry, which of course makes any progress on emissions reductions all but impossible.

Meanwhile, last fall, French officials pledged to phase out all oil and gas production by 2040; they notably did not promise to stop importing and refining fossil fuels from other countries. It is consumption of course that is key to global carbon output, not where the production takes place.

Meanwhile, the Germans have set lofty targets for using renewables to generate electricity, only to find that the wind doesn’t always blow and the sun doesn’t always shine. Consequently, they have had to burn lignite, one of the dirtiest fuels on the planet, to satisfy their demand for power. Needless to say, like the French, the Germans have missed their emission goals.

It is tiresome to be lectured by the EU, a region that is facing serious, ongoing tensions. The Brussels wizards who readily criticize U.S. policies have not faced up to the block’s structural problems revealed during the financial crisis.

Just last week, anti-EU election results in Italy caused market turbulence; voter impatience with Europe’s bureaucrats is unlikely to disappear.

President Trump has upset conventions in some areas that should have been challenged decades ago. That is uncomfortable for those reliant on U.S. largesse, but should be cheered by Americans.

Summary

It is really remarkable to see a non-politician businessman operate with instincts for finding leverage and using it to strike new arrangements.  And Trump also shows how peer pressure and disapproval, so effective in cowing those who care, rolls off his back like nothing.  They truly don’t know what game he is playing because he is not wired like them, and they have seriously underestimated his capacities and determination.  Those who accuse him of polarizing the situation are mistaken; he is revealing the conflicts of interest that have been papered over and never challenged by previous Presidents.  As they say, “You can’t change until you first acknowledge the problem.”


Ontario Voters Sack Climate-Obsessed Premier

A number of posts here (linked at bottom) described how Ontario’s liberal government spent taxpayers’ and ratepayers’ money like drunken sailers looking to score in International circles.  It seems chickens do come home to roost, and those politicians are out in a landslide.  The story from CBC (warmists all) is Ontario vote will hamper prime minister’s efforts on climate change (Ya think?) Excerpts below with my bolds.

Voters in the province of Ontario have sent a stinging rebuke to the ruling Liberal Party reducing it to a rump, and they voted massively for populist Doug Ford and his Progressive Conservatives. Ford has promised to take Ontario out of its carbon cap-and-trade agreement with California and the province of Quebec, and he is against Prime Minister Justin Trudeau’s plan to oblige all provinces to levy a carbon tax.

“Now what you have is Doug Ford leading…the biggest province in the country…Now as premier of Ontario, he has one of the largest voices in the country when it comes to issues on the environment, the economy—all of these things that the premiers of the country and the prime minister have to sit down and talk about. Doug Ford now has the biggest voice at that table,” says Jordan Press, parliamentary reporter with The Canadian Press.

‘How do you meet..international agreements?’

“In much the same way that he (Trudeau) has an issue dealing with (U.S. President) Donald Trump on the environment, now Justin Trudeau faces a domestic issue as well, that how do you meet those international agreements that you have promoted. How do you continue to be that progressive leader on the world stage when at home, you are facing opposition to some of your plans,” asks Press.

Environment Minister Catherine McKenna with Justin Trudeau in the choir.

Less tax, cheaper beer promised

During the election campaign, Ford promised to cut taxes, reduce gasoline prices by 10 cents a litre, reduce the high price of electricity and offer beer for one dollar a bottle. He was criticized for not providing a clear plan for how he would pay for these promises. The province of Ontario already carries a massive debt load.

But people seem to have appreciated his promise to defend “the little guy” and ignored a lawsuit launched by his brother’s widow alleging Ford mismanaged the family’s business costing millions from the estate.

Some people compare Ford to Trump and debate about that will likely be vigorous long into the future.

In the final tally, Progressive Conservatives were elected in 76 ridings and the New Democratic Party took 40. After ruling for 15 years, the Liberal Party lost official party status and the funding that comes with it by winning only seven seats. The Green Party took one.

Former Ontario Premier Kathleen Wynne.

Background

Electrical Madness in Green Ontario

Ontario Jammed by Rent-Seekers and Ratepayers

Ontario Climate Policy Refugees

Ontario Coal Phase-out: All Pain, No Gain

Another wheel flies off Ontario’s green energy bus

US House Votes Down Social Cost of Carbon


The House GOP on Friday took a step forward in reining in the Obama administration’s method of assessing the cost of carbon dioxide pollution when developing regulations.

The House voted 212-201, along party lines, to include a rider blocking the use of the climate change cost metric to an energy and water spending bill.

The amendment offered by Texas Republican Rep. Louie Gohmert bars any and all funds from being used under the bill to “prepare, propose, or promulgate any regulation that relies on the Social Carbon analysis” devised under the Obama administration on how to value the cost of carbon. (Source Washington Examiner, here)

To clarify: the amendment in question defunds any regulation or guidance from the federal government concerning the social costs of carbon.

Background: 
The Obama administration created and increased its estimates of the “Social Cost of Carbon,” invented by Michael Greenstone, who commented on the EPA Proposed Repeal of CO2 emissions regulations.  A Washington Post article, October 11, 2017, included this:

“My read is that the political decision to repeal the Clean Power Plan was made and then they did whatever was necessary to make the numbers work,” added Michael Greenstone, a professor of economics at the University of Chicago who worked on climate policy during the Obama years.

Activists are frightened about the Clean Power Plan under serious attack along three lines:
1. No federal law governs CO2 emissions.
2. EPA regulates sites, not the Energy Sector.
3. CPP costs are huge, while benefits are marginal.

Complete discussion at CPP has Three Fatal Flaws.

Read below how Greenstone and a colleague did exactly what he now complains about.

Social Cost of Carbon: Origins and Prospects

The Obama administration has been fighting climate change with a rogue wave of regulations whose legality comes from a very small base: The Social Cost of Carbon.

The purpose of the “social cost of carbon” (SCC) estimates presented here is to allow agencies to incorporate the social benefits of reducing carbon dioxide (CO2) emissions into cost-benefit analyses of regulatory actions that impact cumulative global emissions. The SCC is an estimate of the monetized damages associated with an incremental increase in carbon emissions in a given year. It is intended to include (but is not limited to) changes in net agricultural productivity, human health, property damages from increased flood risk, and the value of ecosystem services due to climate change. From the Technical Support Document: -Technical Update of the Social Cost of Carbon for Regulatory Impact Analysis -Under Executive Order 12866

A recent Bloomberg article informs on how the SCC notion was invented, its importance and how it might change under the Trump administration.
How Climate Rules Might Fade Away; Obama used an arcane number to craft his regulations. Trump could use it to undo them. (here). Excerpts below with my bolds.

scc-working-group

In February 2009, a month after Barack Obama took office, two academics sat across from each other in the White House mess hall. Over a club sandwich, Michael Greenstone, a White House economist, and Cass Sunstein, Obama’s top regulatory officer, decided that the executive branch needed to figure out how to estimate the economic damage from climate change. With the recession in full swing, they were rightly skeptical about the chances that Congress would pass a nationwide cap-and-trade bill. Greenstone and Sunstein knew they needed a Plan B: a way to regulate carbon emissions without going through Congress.

Over the next year, a team of economists, scientists, and lawyers from across the federal government convened to come up with a dollar amount for the economic cost of carbon emissions. Whatever value they hit upon would be used to determine the scope of regulations aimed at reducing the damage from climate change. The bigger the estimate, the more costly the rules meant to address it could be. After a year of modeling different scenarios, the team came up with a central estimate of $21 per metric ton, which is to say that by their calculations, every ton of carbon emitted into the atmosphere imposed $21 of economic cost. It has since been raised to around $40 a ton.

Trump can’t undo the SCC by fiat. There is established case law requiring the government to account for the impact of carbon, and if he just repealed it, environmentalists would almost certainly sue.

There are other ways for Trump to undercut the SCC. By tweaking some of the assumptions and calculations that are baked into its model, the Trump administration could pretty much render it irrelevant, or even skew it to the point that carbon emissions come out as a benefit instead of a cost.

The SCC models rely on a “discount rate” to state the harm from global warming in today’s dollars. The higher the discount rate, the lower the estimate of harm. That’s because the costs incurred by burning carbon lie mostly in the distant future, while the benefits (heat, electricity, etc.) are enjoyed today. A high discount rate shrinks the estimates of future costs but doesn’t affect present-day benefits. The team put together by Greenstone and Sunstein used a discount rate of 3 percent to come up with its central estimate of $21 a ton for damage inflicted by carbon. But changing that discount just slightly produces big swings in the overall cost of carbon, turning a number that’s pushing broad changes in everything from appliances to coal leasing decisions into one that would have little or no impact on policy.

According to a 2013 government update on the SCC, by applying a discount rate of 5 percent, the cost of carbon in 2020 comes out to $12 a ton; using a 2.5 percent rate, it’s $65. A 7 percent discount rate, which has been used by the EPA for other regulatory analysis, could actually lead to a negative carbon cost, which would seem to imply that carbon emissions are beneficial. “Once you start to dig into how the numbers are constructed, I cannot fathom how anyone could think it has any basis in reality,” says Daniel Simmons, vice president for policy at the American Energy Alliance and a member of the Trump transition team focusing on the Energy Department.

David Kreutzer, a senior research fellow in energy economics and climate change at Heritage and a member of Trump’s EPA transition team, laid out one of the primary arguments against the SCC. “Believe it or not, these models look out to the year 2300. That’s like effectively asking, ‘If you turn your light switch on today, how much damage will that do in 2300?’ That’s way beyond when any macroeconomic model can be trusted.”

Another issue for those who question the Obama administration’s SCC: It estimates the global costs and benefits of carbon emissions, rather than just focusing on the impact to the U.S. Critics argue that this pushes the cost of carbon much higher and that the calculation should instead be limited to the U.S.; that would lower the cost by more than 70 percent, says the CEI’s Mario Lewis.

Still, by narrowing the calculation to the U.S., Trump could certainly produce a lower cost of carbon. Asked in an e-mail whether the new administration would raise the discount rate or narrow the scope of the SCC to the U.S., one person shaping Trump energy and environmental policy replied, “What prevents us from doing both?”

See Also:

Six Reasons to Rescind Social Cost of Carbon

SBC: Social Benefits of Carbon

drain-the-swamp

From Russia With Climate Love

Sputnik News spins climate alarmism in this current article New Climate Change Report Says We’re Screwed Even if Paris Accord Goals Met Text in italics with my bolds, images and titles.

A recently published study on climate change predicts catastrophic changes to the planet’s ecology, even if global temperatures rise by only 1.5 degrees Celsius, a cap on warming the Paris Climate Accord aims to secure.

Foretelling the Future

The new study, performed by an international research group and published in the journal Nature on June 7, predicts catastrophic changes to the planet even if Paris Accord emission targets are met.

According to Phys.org, many studies predict that a 2 degree increase would lead to massive climatic and ecological changes, but few have examined what would happen if the temperature rose by only 1.5 degrees instead. While this fraction of a degree might seem unimportant, it actually means a lot on a global scale, researchers say.

Apocalypse Now

If today’s temperature trend continues until 2100, then many inhabited islands as well as many coastal cities will be swallowed by the sea, with the Maldives being just one example. The Paris Agreement was signed with the stated aim of preventing this catastrophe by limiting global warming to only 1.5 C.

However, the new study says that while a hard limit keeping the temperature increase fewer than 2 C would avert drastic changes, such as the Mediterranean drying up or US cities getting 5 C hotter than they are now, the exact character of the global warming curve is more important to overall climate change effects than most people understand. For example, if global temperature even briefly increases by 2 C overall but then falls back, that would also cause irreparable damage.

“The extinction of species during a phase of excess temperatures couldn’t be undone, even if the level of warming was then reduced and limited to a 1.5 C increase,” says ETH Zurich (Swiss Federal Institute of Technology) professor Sonia Seneviratne, one of the lead authors of the study.

No Escape, No Silver Bullet

According to Seneviratne, many existing scenarios on climate change mitigation actually allow for a temporary 2 C degree increase and also involve vast CO2-reducing measures, which include reforestation, carbon capture and storage operations (CCS). However, CCS is not yet a viable option, as humanity does not have any effective and scalable means to return carbon from the air to the ground for good. Even the much-advertised “negative emissions” power plant in Iceland is not as great in reality as it looks on paper. Besides, even in theory, CCS needs so much space to work that it’s comparable to the world’s food production operations.

Therefore, Seneviratne says, the only way to save the world now is to immediately and dramatically cut CO2 emissions.

“It’s clear that we must urgently reduce emissions if we want to stand a chance of meeting the 1.5 C goal and keeping any temperature overshoot as low as possible,” Seneviratne emphasized.

The Usual Bad Guys

In 2015, China was the number one carbon dioxide-emitting country, with almost 30 percent of the world’s fossil fuel CO2 emissions, according to the data from the EU’s Emissions Database for Global Atmospheric Research. The US took second place, emitting almost half as much as China does, slightly below 15 percent of the world’s total. Despite all their efforts, the European Union as a whole takes proud third place with 9.6 percent, followed by India, which produces 6.8 percent of the world’s fossil fuel carbon emissions.

Women, Children and Minorities Hit Hardest By the World Ending

Unfortunately, drastic carbon emission cuts will also mean drastic changes to modern social and economic life, consequences the US has recently and notably refused to countenance by backing out of the global climate accord.


Pope Francis Has Climate Change Backwards

150928believer

Reblogged from Town Hall Pope Francis has it Exactly Backwards on Climate Change by Gregory Whitestone. Text in italics with my bolds.

This week Pope Francis will host a gathering of executives from major oil companies and investment firms at the Vatican to have a dialogue on climate and more specifically on transitioning away from fossil fuels. Already confirmed to attend were leaders of BP, ExxonMobil, Royal Dutch Shell and mega-investment firm Black Rock. That these major companies would attend such a meeting shows just how successful the constant world-wide drum beat of climate alarmism has been. I doubt that these oil executives would agree to bring the rope to their own hanging, but they certainly appear to be ready to negotiate the terms of their own demise.

This pope has a long history of supporting the notion of catastrophic man-made global warming and using his interpretation of biblical teaching to support it. In 2015 he wrote his encyclical Laudato Si, on climate change and man’s responsibilities to the planet as a warning to his flock of the dangers of our “sins of emission” through our use of fossil fuels and in praise of renewable energy and living a more spartan existence. This more than 100-page manifesto reads like it could have been co-authored by Al Gore, Karl Marx and Chicken Little and depicts an Earth that is spiraling quickly into man-made climate hell which can only be saved by radically reducing our carbon footprint and curbing our wasteful habits.

The document contains bitter condemnations on human failures that are supposedly harming the planet including the usual litany of a lack of clean water, soils that are despoiled by pesticides, increasing air pollution, desertification and drought, to name a few. In it he states that we must, “… hear both the cry of the earth and the cry of the poor. These situations have caused sister earth, along with all the abandoned of our world, to cry out, pleading that we take another course. Never have we so hurt and mistreated our common home as we have in the last two hundred years.”

The encyclical professes to speak for the poor but in truth, it will be the poor that will bear the brunt of the very policies the Pope endorses. Pope Francis’ endorsement of climate agreements like the Paris Climate Accord will necessarily limit and reduce the availability of inexpensive, reliable energy that can help lift the billions of the poorest out of staggering poverty. Nearly a billion people do not have the benefit of electricity and another 2 billion have very limited access to the energy standards we expect in the western world. In addition, the living standards of all peoples benefit from inexpensive, dependable energy from fossil fuels.

The Pope recommends that we move away from low-cost, reliable energy provided through fossil fuels and embrace expensive, intermittent “green” energy. In developed countries, the poor pay a higher percentage of their income on energy than others, so in effect, the policies proposed are a regressive form of taxation with higher costs to the poor than the wealthy. It is estimated that pollution from dirty, inefficient cooking and heating fuels, often dung, lead to about 4 million premature deaths a year. Policies such as that proposed by Francis condemn these unfortunates to more generations of poverty, disease and despair.

The Pope has it exactly backwards. A prospering of the human condition requires full use of all of God’s Creation. Reliable, inexpensive energy is part of the solution which can lift billions of God’s creatures out of systemic poverty and disease. Instead of promoting fruitless and harmful policies to control global temperature, Christian leadership should embrace responsible environmental stewardship, make energy and all its benefits more affordable, and thereby free the poor to rise out of poverty.

Cooling Ocean Air Temps

Presently sea surface temperatures (SST) are the best available indicator of heat content gained or lost from earth’s climate system.  Enthalpy is the thermodynamic term for total heat content in a system, and humidity differences in air parcels affect enthalpy.  Measuring water temperature directly avoids distorted impressions from air measurements.  In addition, ocean covers 71% of the planet surface and thus dominates surface temperature estimates.  Eventually we will likely have reliable means of recording water temperatures at depth.

Recently, Dr. Ole Humlum reported from his research that air temperatures lag 2-3 months behind changes in SST.  He also observed that changes in CO2 atmospheric concentrations lag behind SST by 11-12 months.  This latter point is addressed in a previous post Who to Blame for Rising CO2?

The May update to HadSST3 will appear later this month, but in the meantime we can look at lower troposphere temperatures (TLT) from UAHv6 which are already posted for May. The temperature record is derived from microwave sounding units (MSU) on board satellites like the one pictured above.

The UAH dataset includes temperature results for air above the oceans, and thus should be most comparable to the SSTs. The graph below shows monthly anomalies for ocean temps since January 2015.

UAH May2018

Open image in new tab to enlarge.

The anomalies have reached the same levels as 2015.  Taking a longer view, we can look at the record since 1995, that year being an ENSO neutral year and thus a reasonable starting point for considering the past two decades.  On that basis we can see the plateau in ocean temps is persisting. Since last October all oceans have cooled, with upward bumps in Feb. 2018, now erased.

UAHv6 TLT 
Monthly Ocean
Anomalies
Average Since 1995 Ocean 5/2018
Global 0.13 0.09
NH 0.16 0.33
SH 0.11 -0.09
Tropics 0.12 0.02

As of May 2018, global ocean temps are slightly lower than April and below the average since 1995.  NH remains higher, but not enough to offset much lower temps in SH and Tropics (between 20N and 20S latitudes).  Global ocean air temps are now the lowest since April 2015, and SH the lowest since May 2013.

The details of UAH ocean temps are provided below.  The monthly data make for a noisy picture, but seasonal fluxes between January and July are important.

Click on image to enlarge.

The greater volatility of the Tropics is evident, leading the oceans through three major El Nino events during this period.  Note also the flat period between 7/1999 and 7/2009.  The 2010 El Nino was erased by La Nina in 2011 and 2012.  Then the record shows a fairly steady rise peaking in 2016, with strong support from warmer NH anomalies, before returning to the 22-year average.

Summary

TLTs include mixing above the oceans and probably some influence from nearby more volatile land temps.  They started the recent cooling later than SSTs from HadSST3, but are now showing the same pattern.  It seems obvious that despite the three El Ninos, their warming has not persisted, and without them it would probably have cooled since 1995.  Of course, the future has not yet been written.