 Big Chill in last Two Weeks
The major growth in ice extent came in the Russian basins (right side). The image above shows massive gains in ice extent in East Siberian and Laptev seas. East Siberian added 460k km2 for a total of 895, or 82% of last March maximum. Laptev was mostly open water in September, but added 600k km2 in the last two weeks for a total of 700k km2 or 78% of last March maximum. With the Canadian Arctic on the left already frozen over, the gains were smaller, limited to northern Hudson Bay (top left) and Baffin Bay filling in from the north.
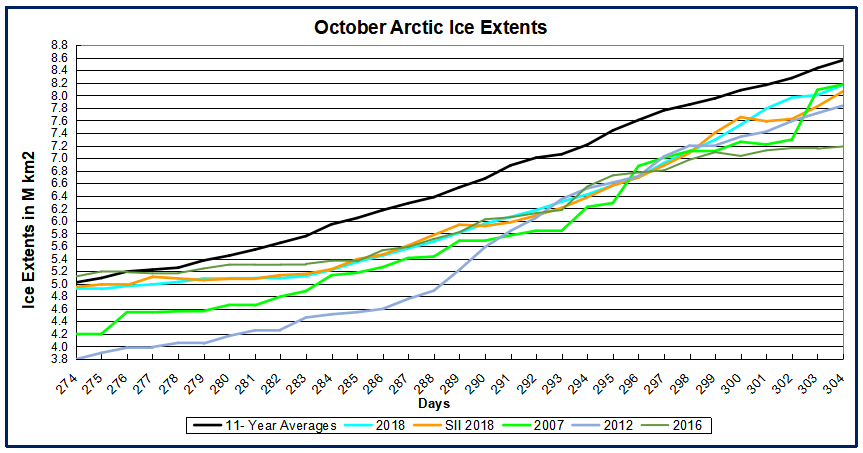
The graph shows MASIE reporting ice extents totaling 8.2M km2 yesterday, 400k km2 below the 11 year average (2007 to 2017 inclusive). Note how 2018 started October on average, then went fairly flat the first week or so, falling 900k km2 below average. Recent gains in ice extent exceed average gains, closing the gap. Presently, 2018 is three days behind the average, matching 2007 and tracking above 2016 and 2012. NOAA’s Sea Ice Index matched MASIE throughout October.
The current IMS Snow and Ice Chart shows how snow is covering Siberia completely, and has spread over northern and eastern canada.

The table below shows the regional distribution of Arctic ice extents.
| Region | 2018304 | Day 304 Average |
2018-Ave. | 2007304 | 2018-2007 |
| (0) Northern_Hemisphere | 8167466 | 8561136 | -393671 | 8175072 | -7606 |
| (1) Beaufort_Sea | 1069285 | 948751 | 120534 | 1038126 | 31159 |
| (2) Chukchi_Sea | 412073 | 468794 | -56721 | 242685 | 169389 |
| (3) East_Siberian_Sea | 894863 | 954841 | -59978 | 835071 | 59792 |
| (4) Laptev_Sea | 698238 | 896167 | -197929 | 887789 | -189551 |
| (5) Kara_Sea | 299264 | 462673 | -163409 | 311960 | -12695 |
| (6) Barents_Sea | 4058 | 81432 | -77375 | 52823 | -48765 |
| (7) Greenland_Sea | 341543 | 416633 | -75090 | 443559 | -102016 |
| (8) Baffin_Bay_Gulf_of_St._Lawrence | 427557 | 271561 | 155996 | 289374 | 138184 |
| (9) Canadian_Archipelago | 823551 | 789952 | 33599 | 817220 | 6331 |
| (10) Hudson_Bay | 131284 | 85823 | 45461 | 48845 | 82439 |
| (11) Central_Arctic | 3063891 | 3173126 | -109235 | 3206345 | -142454 |
The deficits are mainly on the Russian and European seas, only partly offset by surpluses in Beaufort, CAA, Baffin and Hudson Bays.


Reblogged this on Climate Collections.
LikeLike
Kara Sea is about to copy the Beaufort. As all island of ice developing in the middle which allows a much quicker fill and freeze once underway. Hoping for a massiv e jump in this area in the next week. Thank you for your informative updates. Always happy when I come over here and see one even when not freezing as fast as I would like.
LikeLike
angech, thanks for that. Much appreciated. Despite our wish for Nature to give warmists a cooling comeuppance, she doesn’t follow our whims either. Nothing to do but watch, wait and see.
LikeLike