The man poised to become New Brunswick’s next premier has a well-earned reputation as a tight-fisted fiscal manager whose resume includes 33 years as a senior executive working for one of Canada’s richest families: the Irving clan.
Progressive Conservative Leader Blaine Higgs, a 64-year-old engineer and former finance minister, was hired by Irving Oil a week after he graduated from the University of New Brunswick. He was eventually promoted to director of distribution, overseeing oil transportation across eastern Canada and New England.
His extensive big business experience has informed his approach to politics. Higgs refers to citizens as customers, and his campaign for the Sept. 24 election was replete with references to getting results.
“I came from a company where you had to deliver results in order to survive,” Higgs said when he released the Progressive Conservative platform.
“(New Brunswickers) are paying the bills but they’re not getting the service to reflect the amount of money being spent.”
Higgs had promised to cut government waste and balance the province’s budget in two years — a year earlier than his outgoing rival, Liberal Premier Brian Gallant.
And like other right-of-centre politicians, he also promised not to raise taxes, while offering a modest spending plan.
On the national stage, Higgs isn’t expected to ruffle too many feathers. Unlike Ontario Premier Doug Ford, Higgs is no populist.
“His message isn’t that different from previous premiers,” said J.P. Lewis, a political scientist at the University of New Brunswick in Saint John. “He’s more like a traditional Progressive Conservative. He’s like a Harper-era cabinet minister.”
Still, Higgs and Prime Minister Justin Trudeau are expected to clash over how to deal with climate change.
Higgs has said he will join with his counterparts in Ontario and Saskatchewan in rejecting Ottawa’s bid to get the provinces to impose a carbon tax on their citizens.
Last month, Manitoba Premier Brian Pallister said his province would also scrap plans for a carbon tax. As well, Jason Kenney, leader of Alberta’s Opposition, has promised to repeal the province’s carbon tax if his party wins the 2019 spring election.
“Based on (Higgs’) rhetoric, he could become another thorn in the side of Trudeau, especially when it comes to natural resources,” Lewis said.
Higgs also faces a daunting task in turning around the province’s economy, which some economists have said is headed for a “fiscal cliff.” Carrying a $14 billion debt, it could be pushed over the edge if there’s a sharp rise in interest rates or a credit-rating downgrade.
The province has the nation’s lowest median household income, and was the only province that recorded a population decline between 2011 and 2016. As well, its tax base is shrinking and the province has suffered through consecutive deficit budgets.
Economic growth — forecasted by the Conference Board to be about 1.3 per cent this year — is expected to remain sluggish as the province struggles to increase its population.
“We can fix this,” Higgs said before the election campaign. “We have to be straight with each other and talk about real issues, not pretend all is well.”
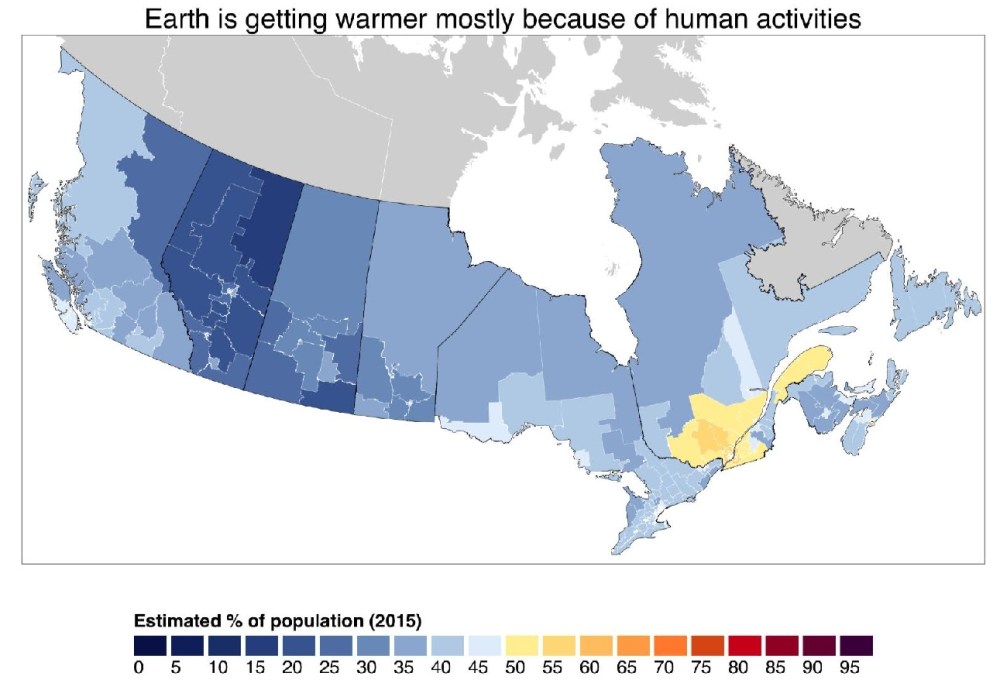
Results from survey The distribution of climate change public opinion in Canada Mildenberger et al. 2015
Just in time for Halloween, the United Nations’ Intergovernmental Panel on Climate Change has released yet another in a 30-year stream of spooky stories: Global Warming of 1.5 Degree Celsius, an IPCC special report on the impacts of global warming of 1.5°C above pre-industrial levels.
Like its five predecessors, it makes terrifying predictions about human-caused climate catastrophes that are always just about to occur, unless governments reduce the level of the harmless trace gas carbon dioxide in the atmosphere from its current four-hundredths of one percent to the three hundredths it was before industrialization.
Notice that the title chosen by the UN gives the game away. It presents correlation as causation by implying that all the warming since pre-industrial times has been caused by industry. There’s no room here for a natural oscillation back from the well-documented lows of the 1700s, which themselves were rebounds from a higher temperature period in the 1400s. (See this NOAA chart).
So how will the UN engender so much fear that the public will agree to stop using fossil-fueled electricity to halt “climate change?” After all, the phrase in itself is benign and natural. With enough repetition as images of hurricanes play on the screen, however, climate change has come to be short-hand for fossil-fueled, civilization-threatening storms, droughts, and destruction of coastal cities and islands, a dubious hypothesis on which we are hilariously told “the debate is over.”
For years I assigned statistics students to pick any apocalyptic climate claim in the media and trace it back through the UN reports to its genesis in a scientific study. I knew they would discover that these reports are not scientific documents based on the peer review process, but political documents “approved by governments” and intended to scare the public into supporting constraints on the production and use of energy.
A powerful publicity machine magnifies the alarm, bombarding citizens with exaggerations and claims of certainty that are proven wrong as you dig down to their underlying scientific studies:
Public figures, news editors, and commentators make claims that are more alarmist than what individual IPCC authors say at the release of the report.
Individual IPCC authors make claims at the release of the report that are more alarmist than what the official press release says.
The official press release makes claims that are more alarmist than what the report’s summary for policy-makers says.
The summary for policy-makers makes claims that are more alarmist than the various chapters of the reports.
The chapters of the report make claims that are more alarmist than the studies they reference in the footnotes.
The studies referenced in the footnotes are often actually peer-reviewed and generally make cautious claims about a possible trend spotted in one or a small number of locations or in a global computer model.
Both types of studies are more speculative than definitive because, as they always acknowledge in the fine print, they are based on highly-uncertain measurements of highly-complex phenomena with many interacting causes, of which warming gasses generated by human activity are only one, and often a minor component.
For governments to make policy on such a hierarchy of exaggeration brings to mind James Madison’s warning: “A popular Government, without popular information, or the means of acquiring it, is but a Prologue to a Farce or a Tragedy; or perhaps both.”
The serial release of UN reports obscures the fact that the climate catastrophes they predict never occur. As the data contained deep in the bowels of this latest report again acknowledge, Mother Nature is simply not cooperating with the UN There has been no positive trend in hurricanes, floods, and droughts as carbon dioxide levels continue to rise.
Even the average global temperature (whose rise is supposed to increase disasters) has barely budged, only rising a third of the amount that has been repeatedly been predicted by the IPCC computer models.
Sea levels, which are very difficult to measure due to human use of land and even to the natural rise and fall of land itself, chugs along at the same inch-per-decade that it has for thousands of years – not the terrifying 10 feet in a century warned about in previous reports. The islands and polar ice that we were repeatedly told would be gone by now are still there, and no closer to destruction.
The UN’s response to its failed predictions is simply to move the goal-posts, and make new dire predictions for some future date – in this case 2030. There is no reason to believe that this speculation will be any more accurate the ones that predicted human-induced climate catastrophes by certain dates, now passed.
But don’t be too frightened: the same governments who authorize the UN reports never take the steps needed to reduce the supposedly horrifying carbon dioxide level. Hidden behind their teeth-chattering fear of fossil fuels is their awareness that oil, gas, and coal have helped bring dramatic improvements in health, welfare, and life expectancy, and that alternative methods of generating power are currently available only at unacceptable economic (and hence political) cost.
Happy Halloween!
Caleb Rossiter, Ph.D., is the director of the American Exceptionalism Media Project, a fellow at The Texas Public Policy Foundation, and a former professor of statistics at American University.
Robert Bryce reports on the end of wind power hopes in City Journal. Why Wind Power Isn’t the AnswerExcerpts in italics with my bolds
As a new study confirms, turbines would have to be stacked across state-sized swaths of the American landscape.
On October 8, the Intergovernmental Panel on Climate Change released a report warning that nations around the world must cut their greenhouse-gas emissions drastically to reduce the possibility of catastrophic climate change. The report emphasizes “fast deployment of renewables like solar and wind” and largely ignores the essential role nuclear energy must play in any decarbonization effort.
Four days earlier, to much less fanfare, two Harvard researchers published a paper showing that trying to fuel our energy-intensive society solely with renewables would require cartoonish amounts of land. How cartoonish? Consider: meeting America’s current demand for electricity alone—not including gasoline or jet fuel, or the natural gas required for things like space heating and fertilizer production—would require covering a territory twice the size of California with wind turbines.
The IPCC and climate-change activists love solar and wind energy, and far-left politicians like Alexandria Ocasio-Cortez have called for a wartime-style national mobilization to convert to 100 percent renewable-energy usage. But this credo ignores a fundamental truth: energy policy and land-use policy are inextricable.
The renewables-only proponents have no trouble mobilizing against land use for the extraction of hydrocarbons. Consider the battle in Colorado over Proposition 112, which will prohibit oil- and gas-drilling activities within 2,500 feet of homes, hospitals, schools and “vulnerable areas.” Environmental groups including 350.org, the Sierra Club, and Greenpeace have endorsed the initiative, which will appear on the November 6 ballot. If it passes, Proposition 112 would effectively ban new oil and gas production in Colorado, the nation’s fifth-largest natural gas producer. Or consider the months-long demonstrations that ended last year in South Dakota over the Dakota Access pipeline. More than 700 climate-change activists and others were arrested during protests claiming that Dakota Access, by crossing the traditional lands of the Standing Rock Sioux, was violating the tribe’s cultural and spiritual rights. These energy- and land-use battles are waged by climate activists and environmental groups whose goal is to shutter the hydrocarbon industry. Most of these groups, including 350.org and Sierra Club, routinely claim that the American economy can run solely on renewables. Further, the Sierra Club has tallied 74 U.S. cities that have pledged to get all of their electricity from renewable energy.
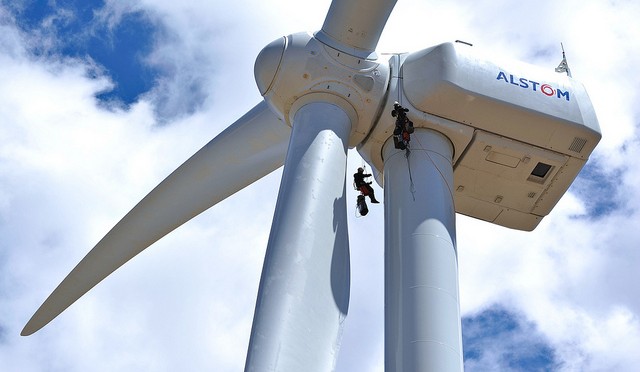
Japan is going to remove this Fukushima turbine, one of the world’s largest with a rotor diameter of 167 meters. It was deemed unprofitable due to multiple malfunctions decreasing the utilization rate. Its utilization rate over the year through June 2018 was 3.7 percent, well below the 30 percent necessary for commercialization.
But the new study, published in Environmental Research Letters, shows yet again that wind energy’s Achilles heel is its paltry power density. “We found that the average power density—meaning the rate of energy generation divided by the encompassing area of the wind plant—was up to 100 times lower than estimates by some leading energy experts,” said lead author Lee Miller, a postdoctoral fellow who coauthored the report with Harvard physics professor David Keith. The problem is that most estimates of wind energy’s potential ignore “wind shadow,” an effect that occurs when turbines are placed too closely together: the upwind turbines rob wind speed from others placed downwind.
The study looks at 2016 energy-production data from 1,150 solar projects and 411 onshore wind projects. The combined capacity of the wind projects totaled 43,000 megawatts, or roughly half of all U.S. wind capacity that year. Miller and Keith concluded that solar panels produce about 10 times more energy per unit of land as wind turbines—a significant finding—but their work demands attention for two other reasons: first, it uses real-world data, not models, to reach its conclusions, and second, it shows that wind energy’s power density is far lower than the Department of Energy, the IPCC, and numerous academics have claimed.
Further: “While improved wind turbine design and siting have increased capacity factors (and greatly reduced costs), they have not altered power densities.” In other words, though Big Wind has increased the size and efficiency of turbines—the latest models stand more than 700 feet tall—it hasn’t been able to wring more energy out of the wind. Due to the wind-shadow effect, those taller turbines must be placed farther and farther apart, which means that the giant turbines cover more land. As turbines get taller and sprawl across the landscape, more people see them.
Rural residents are objecting to wind projects because they want to protect their property values and viewsheds. They don’t want to see the red-blinking lights atop those massive turbines, all night, every night, for the rest of their lives. Nor do they want to be subjected to the health-damaging noise—both audible and inaudible—that the turbines produce.
The backlash against Big Wind is coast to coast. In New York, which has mandated 50 percent renewable-energy usage by 2030, the towns of Yates and Somerset are fighting against Lighthouse Wind, a 200-megawatt wind project proposed for the shores of Lake Ontario. In Oklahoma, the tiny town of Hinton continues its battle against NextEra Energy, the world’s biggest wind-energy producer, over the siting of wind projects nearby. In California, which just boosted its renewable-electricity mandate to 60 percent by 2030, wind turbines are so unpopular that the industry has effectively given up trying to site new projects there. Meantime, in deep-blue Vermont, both gubernatorial candidates—incumbent Republican Phil Scott and Democratic challenger Christine Hallquist—favor renewable energy in principle but oppose further wind-energy development in the state.
Big Wind has attempted to intimidate some of its rural opponents by filing lawsuits against them. Last year, NextEra sued the town of Hinton in federal and state court after the town passed an ordinance restricting wind-energy development. The wind-energy giant also sued local governments in Michigan, Indiana, and Missouri, all of which had passed measures restricting wind-energy development.
Why the hardball tactics? Simple: rural residents stand between Big Wind and tens of billions of dollars in subsidies available through the Production Tax Credit. In September, Lisa Linowes, cofounder and executive director of the Industrial Wind Action Group, a New Hampshire-based nonprofit that tracks the wind industry, published an article on MasterResource.org. “The US Treasury estimates the PTC will cost taxpayers $40.12 billion in the period from 2018 to 2027,” Linowes wrote, “making it, by far, the most expensive energy subsidy under current tax law.”
The punchline here is obvious: wind energy has been sold as a great source of “clean” energy. The reality is that wind energy’s expansion has been driven by federal subsidies and state-level mandates. Wind energy, cannot, and will not, meet a significant portion of our future energy needs because it requires too much land.
Gray area required for wind farms, yellow area for solar farms, to power London UK.
Miller and Keith’s paper shows that the ongoing push for 100-percent renewables, and, in particular, the idea that wind energy is going to be a major contributor to that goal, is not just wrongheaded—it’s an energy dead end.
Robert Bryce is a senior fellow at the Manhattan Institute and the producer of the forthcoming documentary, Juice: How Electricity Explains the World, which will be released in 2019.
Footnote: It bears repeating here that modern societies have benefited greatly by sourcing their energy from underground rather then above ground. From post excerpting writing by Pierre Desrochers and Joanna Szurmak, Control Population, Control the Climate. Not.
“Pessimists are also oblivious to the benefits of unlocking wealth from underground materials such as coal, petroleum, natural gas and mineral resources. Using these spares vast quantities of land. It should go without saying that even a small population will have a much greater impact on its environment if it must rely on agriculture for food, energy and fibres, raise animals for food and locomotion, and harvest wild animals for everything from meat to whale oil. By replacing resources previously extracted from the biosphere with resources extracted from below the ground, people have reduced their overall environmental impact while increasing their standard of living.”
The major growth in ice extent came in the Russian basins (right side). The image above shows massive gains in ice extent in East Siberian and Laptev seas. East Siberian added 460k km2 for a total of 895, or 82% of last March maximum. Laptev was mostly open water in September, but added 600k km2 in the last two weeks for a total of 700k km2 or 78% of last March maximum. With the Canadian Arctic on the left already frozen over, the gains were smaller, limited to northern Hudson Bay (top left) and Baffin Bay filling in from the north.
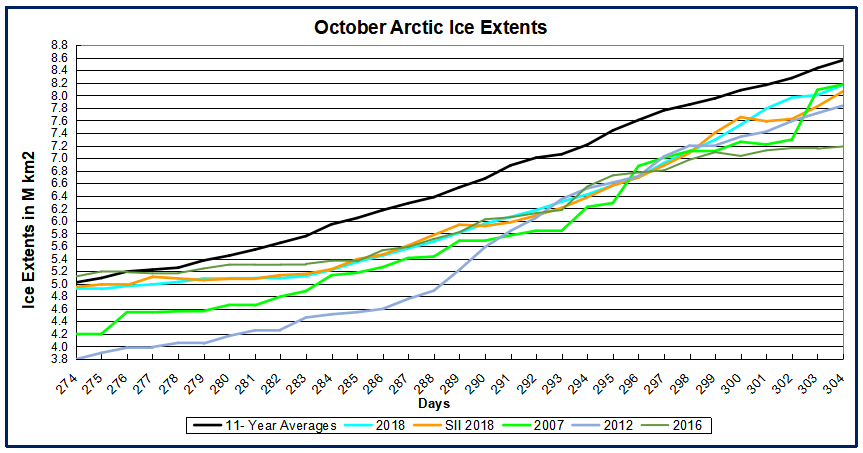
The graph shows MASIE reporting ice extents totaling 8.2M km2 yesterday, 400k km2 below the 11 year average (2007 to 2017 inclusive). Note how 2018 started October on average, then went fairly flat the first week or so, falling 900k km2 below average. Recent gains in ice extent exceed average gains, closing the gap. Presently, 2018 is three days behind the average, matching 2007 and tracking above 2016 and 2012. NOAA’s Sea Ice Index matched MASIE throughout October.
The current IMS Snow and Ice Chart shows how snow is covering Siberia completely, and has spread over northern and eastern canada.
The table below shows the regional distribution of Arctic ice extents.
Region
2018304
Day 304 Average
2018-Ave.
2007304
2018-2007
(0) Northern_Hemisphere
8167466
8561136
-393671
8175072
-7606
(1) Beaufort_Sea
1069285
948751
120534
1038126
31159
(2) Chukchi_Sea
412073
468794
-56721
242685
169389
(3) East_Siberian_Sea
894863
954841
-59978
835071
59792
(4) Laptev_Sea
698238
896167
-197929
887789
-189551
(5) Kara_Sea
299264
462673
-163409
311960
-12695
(6) Barents_Sea
4058
81432
-77375
52823
-48765
(7) Greenland_Sea
341543
416633
-75090
443559
-102016
(8) Baffin_Bay_Gulf_of_St._Lawrence
427557
271561
155996
289374
138184
(9) Canadian_Archipelago
823551
789952
33599
817220
6331
(10) Hudson_Bay
131284
85823
45461
48845
82439
(11) Central_Arctic
3063891
3173126
-109235
3206345
-142454
The deficits are mainly on the Russian and European seas, only partly offset by surpluses in Beaufort, CAA, Baffin and Hudson Bays.
_a06c9___Gallery.jpg)


 Big Chill in last Two Weeks