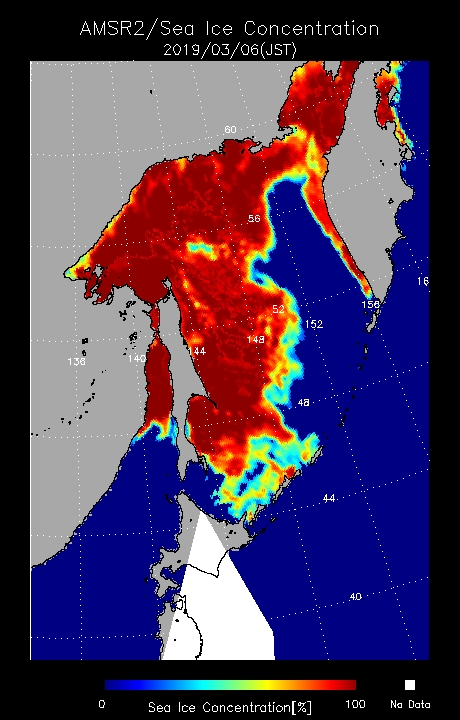
2019/03/06 GCOM-W/AMSR2 [Okhotsk] Sea Ice Concentration Source: JAXA. Note Hokkaido Island, Japan, under the white triangle tip.
The Pacific basins of Bering and Okhotsk display opposing ice patterns this year.

The last two weeks saw open water growing on the right in Bering Sea, now down to 140k km2, one-fourth of its maximum extent. Meanwhile, Okhotsk on the left grew steadily, now pressing down on Hokkaido Island, producing the southernmost Arctic Ice to be found. The graph below shows how 2019 compares to the 12 year average, after taking the Bering anomaly out of the picture.

The chart runs from mid-February to mid-March, showing how 2019 NH ice extent peaked above average on day 54, declined for a week, then rose again recently. The effect of Bering ice loss appears in the gaps between NH extents with and without Bering ice. Note that the black and green lines show Bering has contributed about 700k km2 to the overall total, and that increases to 800k km2 by day 76.
2019 NH included about 500k km2 from Bering on day 32, but the Bering extent has steadily decreased, now only 140k km2. Thus 2019 w/o Bering is 270k km2 greater than NH average w/o Bering at this time, with another 10 days or so for additional ice to form.

The table below shows ice extents in the various basins on day 64.
| Region | 2019064 | Day 064 Average |
2019-Ave. | 2018064 | 2019-2018 |
| (0) Northern_Hemisphere | 14706623 | 15022070 | -315447 | 14461393 | 245231 |
| (1) Beaufort_Sea | 1070498 | 1070200 | 297 | 1070445 | 53 |
| (2) Chukchi_Sea | 943452 | 965931 | -22479 | 965161 | -21709 |
| (3) East_Siberian_Sea | 1087137 | 1087133 | 4 | 1087120 | 18 |
| (4) Laptev_Sea | 897845 | 897842 | 3 | 897845 | 0 |
| (5) Kara_Sea | 934558 | 927864 | 6694 | 934055 | 503 |
| (6) Barents_Sea | 781551 | 642119 | 139431 | 598121 | 183430 |
| (7) Greenland_Sea | 553335 | 639443 | -86108 | 548263 | 5072 |
| (8) Baffin_Bay_Gulf_of_St._Lawrence | 1575867 | 1538064 | 37803 | 1610374 | -34507 |
| (9) Canadian_Archipelago | 853337 | 853037 | 300 | 853109 | 229 |
| (10) Hudson_Bay | 1260903 | 1259978 | 925 | 1260838 | 66 |
| (11) Central_Arctic | 3246782 | 3218361 | 28421 | 3150790 | 95993 |
| (12) Bering_Sea | 140439 | 716013 | -575574 | 286010 | -145571 |
| (13) Baltic_Sea | 64749 | 106825 | -42077 | 166155 | -101407 |
| (14) Sea_of_Okhotsk | 1285797 | 1063174 | 222622 | 1008051 | 277746 |
The Bering deficit is 575k km2 or just 20% of the 12 year average. Surpluses in Okhotsk, Baffin, Central Arctic and Barents do not completely offset, so the NH total is 315k km2 or 2% below average.

Taking a boat trip from Hokkaido Island to see Okhotsk drift ice is a big tourist attraction, as seen in the short video below. Al Gore had them worried back then, but not now.

Drift ice in Okhotsk Sea at sunrise.

Reblogged this on Climate Collections.
LikeLike