
With apologies to Paul Revere, this post is on the lookout for cooler weather with an eye on both the Land and the Sea. UAH has updated their tlt (temperatures in lower troposphere) dataset for March. Previously I have done posts on their reading of ocean air temps as a prelude to updated records from HADSST3. This month also has a separate graph of land air temps because the comparisons and contrasts are interesting as we contemplate possible cooling in coming months and years.

Presently sea surface temperatures (SST) are the best available indicator of heat content gained or lost from earth’s climate system. Enthalpy is the thermodynamic term for total heat content in a system, and humidity differences in air parcels affect enthalpy. Measuring water temperature directly avoids distorted impressions from air measurements. In addition, ocean covers 71% of the planet surface and thus dominates surface temperature estimates. Eventually we will likely have reliable means of recording water temperatures at depth.
Recently, Dr. Ole Humlum reported from his research that air temperatures lag 2-3 months behind changes in SST. He also observed that changes in CO2 atmospheric concentrations lag behind SST by 11-12 months. This latter point is addressed in a previous post Who to Blame for Rising CO2?
The March update to HadSST3 will appear later this month, but in the meantime we can look at lower troposphere temperatures (TLT) from UAHv6 which are already posted for March. The temperature record is derived from microwave sounding units (MSU) on board satellites like the one pictured above. This month also involved a change in UAH processing of satellite drift corrections, including dropping one platform which can no longer be corrected. The graphs below are taken from the new and current dataset.
The UAH dataset includes temperature results for air above the oceans, and thus should be most comparable to the SSTs. There is the additional feature that ocean air temps avoid Urban Heat Islands (UHI). The graph below shows monthly anomalies for ocean temps since January 2015.
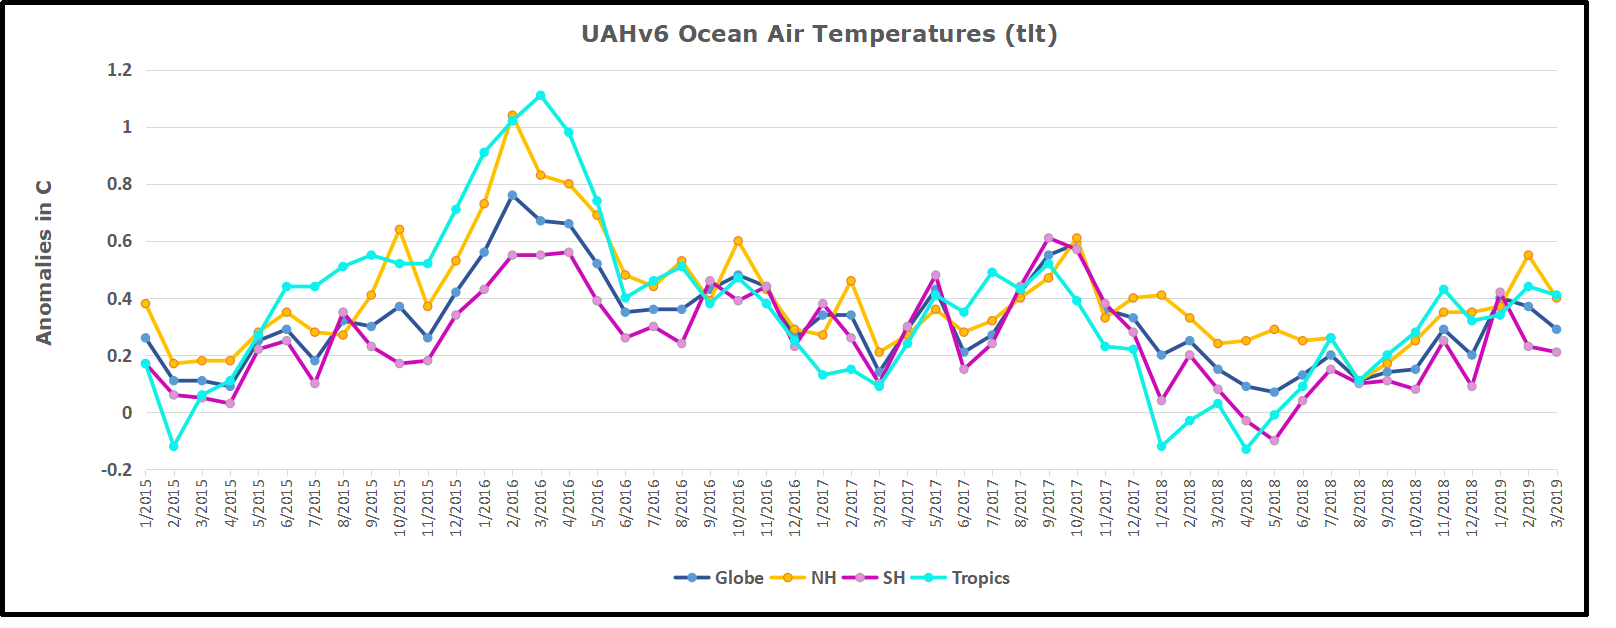
Open image in new tab to enlarge.
The anomalies over the entire ocean dropped to the same value, 0.11C in August. Warming in previous months was erased, and September added very little warming back. In October and November NH and the Tropics rose, joined by SH. In December 2018 all regions cooled resulting in a global drop of nearly 0.1C. The upward bump in January in SH was reversed in February. Despite some February warming in both NH and the Tropics, the Global anomaly cooled. Now in March the cooling appears in all regions resulting in a global decline in SST anomaly of 01C since 01/2019. Except for the Tropics, the ocean SSTs match those of 2015.
Land Air Temperatures Tracking Downward in Seesaw Pattern
We sometimes overlook that in climate temperature records, while the oceans are measured directly with SSTs, land temps are measured only indirectly. The land temperature records at surface stations record air temps at 2 meters above ground. UAH gives tlt anomalies for air over land separately from ocean air temps. The graph updated for March is below.
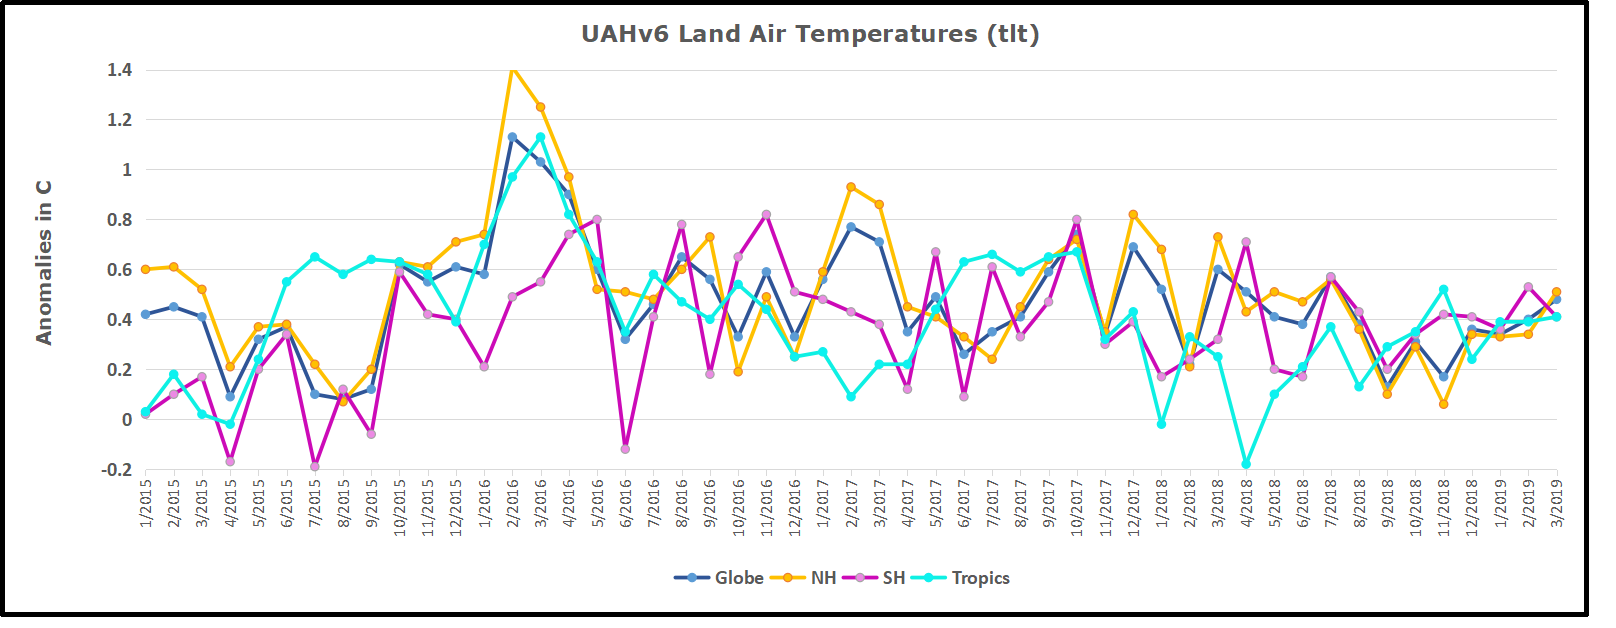
The greater volatility of the Land temperatures was evident earlier, but has calmed down recently. Also the NH dominates, having twice as much land area as SH. Note how global peaks mirror NH peaks. In November air over NH land Global and surfaces bottomed.despite the Tropics. By January all regions had almost the same anomaly. Now in March an upward bump in NH has pulled the Global anomaly up, and both are comparable to early 2015. SH and the Tropics air over land are currently matching other regions, in contrast to starting 2015 much cooler.
TLTs include mixing above the oceans and probably some influence from nearby more volatile land temps. Clearly NH and Global land temps have been dropping in a seesaw pattern, now more than 1C lower than the peak in 2016. TLT measures started the recent cooling later than SSTs from HadSST3, but are now showing the same pattern. It seems obvious that despite the three El Ninos, their warming has not persisted, and without them it would probably have cooled since 1995. Of course, the future has not yet been written.

Reblogged this on Climate Collections.
LikeLike
Ron,
I am having trouble understanding how GHG warming affects ocean heat content. It seems to me that trying to warm the oceans by warming air above it is a terribly inefficient process. I think that effect would be overwhelmed by any changes in the amount of solar radiation hitting the water. As a result a small change in cloudiness would more than overwhelm the greenhouse effect. Am I missing something?
Thanks
LikeLike
Ron. You are not missing something. You are pointing out a major influence in the climate.
The evaporation rate at the sea surface depends on the difference between the Partial Pressure of water vapor in the immediate atmosphere and the liquid vapour pressure of the water at the prevailing temperature. This is further complicated by the wind conditions which remove vapor from the immediate surface and thus lowering the Partial Pressure to increase the evaporation rate. (Witness wind chill.)
Further this evaporation generates a blanket above the surface which tends to absorb incoming radiation as seen in the clouds. This process occurs just as much in the clouds as it does at the sea surface.
For every kilogram of water evaporated some 680 Watthrs is adsorbed and converted to Latent Heat as constant temperature which due to the buoyancy of the vapor rises up through the atmosphere for dissipation partially into space. The balance between this 680 Watthrs and the incoming radiation is all that is left to warm up the sea. Not much I surmise!
It is interesting to note that ocean temperatures generally, with exceptions, rarely go much above 35 C in spite of millions of years of the sun’s radiation. I suggest the above partially explains this.
LikeLike
Roger, I was typing a response to you on Monday when the power went out at my house, along with 380,000 addresses in Quebec. The storm moving across the US dumping snow in Colorado and Montana produced considerable freezing rain here followed by 15-20 cm of snow on April 9. Now back on line, I will add to what cognog said.
Your instinct is correct: the sun heats the ocean and the ocean heats the air. Latent heat from water evaporation is large, along with convection by air warmed by contact with the ocean that then rises, replaced by descending cool air to be warmed in turn. IR from warm air cannot penetrate the skin of the water and serves only to add a bit to evaporation.
It does happen of course that a warm air parcel can come into contact with cooler ocean water, and can lose some heat by conduction to the water. Once the air and water temps are equal, that parcel stays there resulting in a temporary inversion, i.e. cooler air underlying warmer air. Eventually, that parcel will either be warmed or replaced by even cooler air, and the typical convection process resumes.
I posted on the heat transfers between ocean and air, including an empirical study demonstrating what I say above.
https://rclutz.wordpress.com/2015/05/10/empirical-evidence-oceans-make-climate/
LikeLike
Thank you both for your responses. Per usual the more you dig the problems you uncover with the existential threat claim.
LikeLike