 The image is an animation of MASIE ice charts over the last three weeks from Oct.1 to yesterday, Nov.20, 2019. At the top is Kara Sea icing, along with Barents, both higher than the 12 year average at this time. On the left Laptev and East Siberian have filled with ice. Chukchi on the bottom was mostly water, but in 3 weeks tripled from 170k km2 up to 518k km2, now 54% of March maximum. Bottom right shows Beaufort Sea and CAA filled with ice. On the right, Hudson Bay has begun freezing down its west coast, while Baffin Bay is freezing southward. Both of these bays are slower than average and a main reason 2019 NH ice extent remains below average presently.
MASIE daily results for November show 2019 ice recovering steadily, reducing the deficit to average.
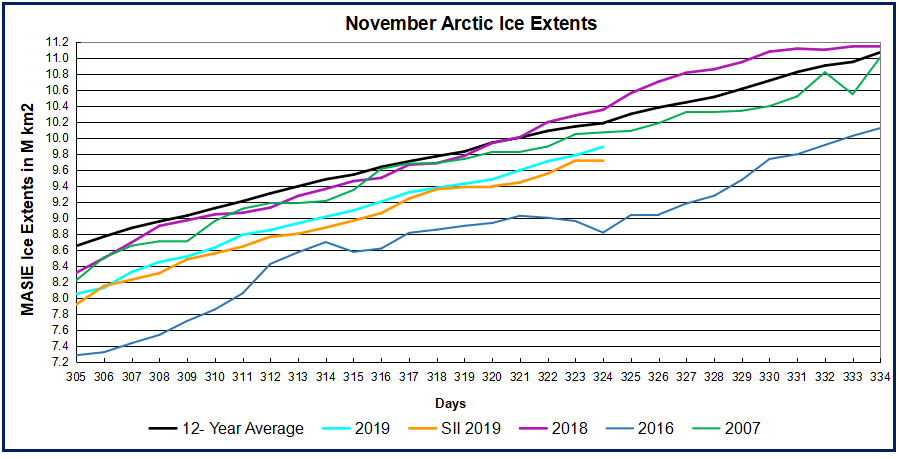 Note that Arctic ice recovers strongly in November going on average (2007 through 2018 inclusive) from 8.6M km2 to 11.1M km2. 2019 ended October as much as 654k km2 below average, but now shows a deficit of 296k km2. All of the tracks appear to be converging except for 2016, which had a much slower pace of refreezing.
The table for day 324 shows distribution of ice across the regions making up the Arctic ocean.
| Region | 2019324 | Day 324 Average | 2019-Ave. | 2007324 | 2019-2007 |
| (0) Northern_Hemisphere | 9888503 | 10184933 | -296430 | 10069799 | -181296 |
| (1) Beaufort_Sea | 1063360 | 1066882 | -3523 | 1046467 | 16892 |
| (2) Chukchi_Sea | 517822 | 702499 | -184678 | 622683 | -104861 |
| (3) East_Siberian_Sea | 1083955 | 1077768 | 6187 | 1059995 | 23959 |
| (4) Laptev_Sea | 897845 | 897094 | 751 | 897845 | 0 |
| (5) Kara_Sea | 807562 | 674120 | 133443 | 760883 | 46680 |
| (6) Barents_Sea | 255306 | 178393 | 76913 | 130915 | 124391 |
| (7) Greenland_Sea | 502301 | 490127 | 12174 | 546284 | -43983 |
| (8) Baffin_Bay_Gulf_of_St._Lawrence | 362245 | 600845 | -238600 | 532589 | -170343 |
| (9) Canadian_Archipelago | 854282 | 851989 | 2294 | 852142 | 2141 |
| (10) Hudson_Bay | 256575 | 374668 | -118093 | 380911 | -124336 |
| (11) Central_Arctic | 3206293 | 3171926 | 34367 | 3184762 | 21531 |
Presently 2019 ice extent according to MASIE is 296k km2 (3%) below the 12 year average and 181k km2 less than 2007. Most of the deficit to average is in Chukchi Sea, along with Baffin and Hudson Bays refreezing slowly this year. Other places are close to normal, with Kara and Barents Seas showing surpluses.

For context, note that the average maximum has been 15M, so on average the extent shrinks to 30% of the March high before growing back the following winter.


Reblogged this on Climate Collections.
LikeLike
Interesting: the German University of Bremen’s Institute of Environmental Physics notices a record low Ice Extent for October 2019.
But even more interesting is the reason that is given: “most likely caused by the increased heat input from the ocean and the atmospheric circulation in the Arctic.
From: https://www.meereisportal.de/en/archive/2019-kurzmeldungen-gesamttexte/arctic-sea-ice-extent-at-a-record-low/
WR: Heat from the ocean is causing ice melt and this results in more water vapor in the air. This is causing a changing weather type: more low pressure areas are sucking in warm air from the south. See the weather maps in https://sunriseswansong.wordpress.com/2019/11/19/arctic-sea-ice-ralphs-hooked-signature/
LikeLike
Thanks Wim, further support for the oceans making climate. As the Russians have also noted, the Arctic is a self-oscillating system including changes in the water structure, ice cover, and air circulation. On the latter point, Judah Cohen has evidence that October snowfall from increased moisture leads to a wavy polar vortex.
https://rclutz.wordpress.com/2015/12/23/arctic-sea-ice-self-oscillating-system/
https://rclutz.wordpress.com/2019/11/13/rapid-nh-snow-cover-oct-2019/
LikeLiked by 1 person
Thanks Ron, a very interesting article of Zakharov, I will have to read the article well.
A possibility is that the oceans start the oscilation by changing salinity: more saline Atlantic ocean water can sink as warmer (!) water than usual and flow as a a warmer than normal subsurface flow below the ice and the fresher layer below the ice. After some time (years) of warming some ice will melt starting a chain of events that eventually will refreeze the Arctic.
Polyakov 2017 https://science.sciencemag.org/content/356/6335/285 describes the effects of the inflow of warmer subsurface water from the nineties and 2000’s. Without a new inflow of warmer than normal Atlantic water finally a new refreeze will take place. An Arctic round trip of the warmer water may take a 15 years or so. Cooling down of the Arctic might take some more time.
In this view the ice in the Arctic has a strong tendency to remain, but is dependent for its extent on the behavior of the oceans.
.
LikeLike
Wim, as you know it’s complicated. The quasi-60 year cycle of waxing and waning Arctic sea ice also involves changing wind regimes which push the drift ice around and cause more or less extent even while piling ice in different locations. My insight on this comes again from AARI:
https://rclutz.wordpress.com/2016/03/02/the-great-arctic-ice-exchange/
LikeLike
Hi Ron, you know I am delighted if someone is saying: „the oceans making climate“, and especially if it coming from you. It is also fine seeing your frequent analysis in sea-ice matters and the Arctic. It is a shame, that climatology, nor oceanography, is able to thoroughly explain the Early Arctic Warming from 1918 to 1939. My 109 pages long book on this matter, in these days 10 years old, http://www.arctic-heats-up.com/ , is still offering the most convincing of all I have yet been able to read.
Sorry for been blogging very rarely, but do visiting your site frequently. Wishing you a fine time remaining in 2019;
Cheers Arnd
LikeLike
Arnd, thanks for stopping by and commenting. Long time, no hear. Best wishes to you as well.
LikeLike
About your link: https://rclutz.wordpress.com/2016/03/02/the-great-arctic-ice-exchange/
Good information! Thanks.
LikeLike