Easter News: Covid Killing Secret Exposed

There is a breakthrough in understanding how Covid19 kills people. How fitting that such good news arrives on Easter Sunday. A great H/T to Ice Age Now for breaking this story along with others.

Caroline Snyder writes Covid-19 had us all fooled, but we might have found its secret. Excerpts in italics with my bolds.

Why chloroquine and Z-Pak (also known as azithromycin or Zithromax) work.

I have been thinking this for several weeks now, so it is good to see other folks thinking the same. By the way, I am an RN and a Nutritional Biochemist in former times.

The Malaria-COVID-19 connection is explained very well here in this link (text reprinted at end)

I am unpacking this to a very simple level so all of you can understand why Z-Pak, also known as azithromycin or Zithromax, works, as does the Quinine derivative chloroquine! That doctor compares the presentation to that of altitude sickness, and he is spot-on! (See “We are treating the wrong disease.”)

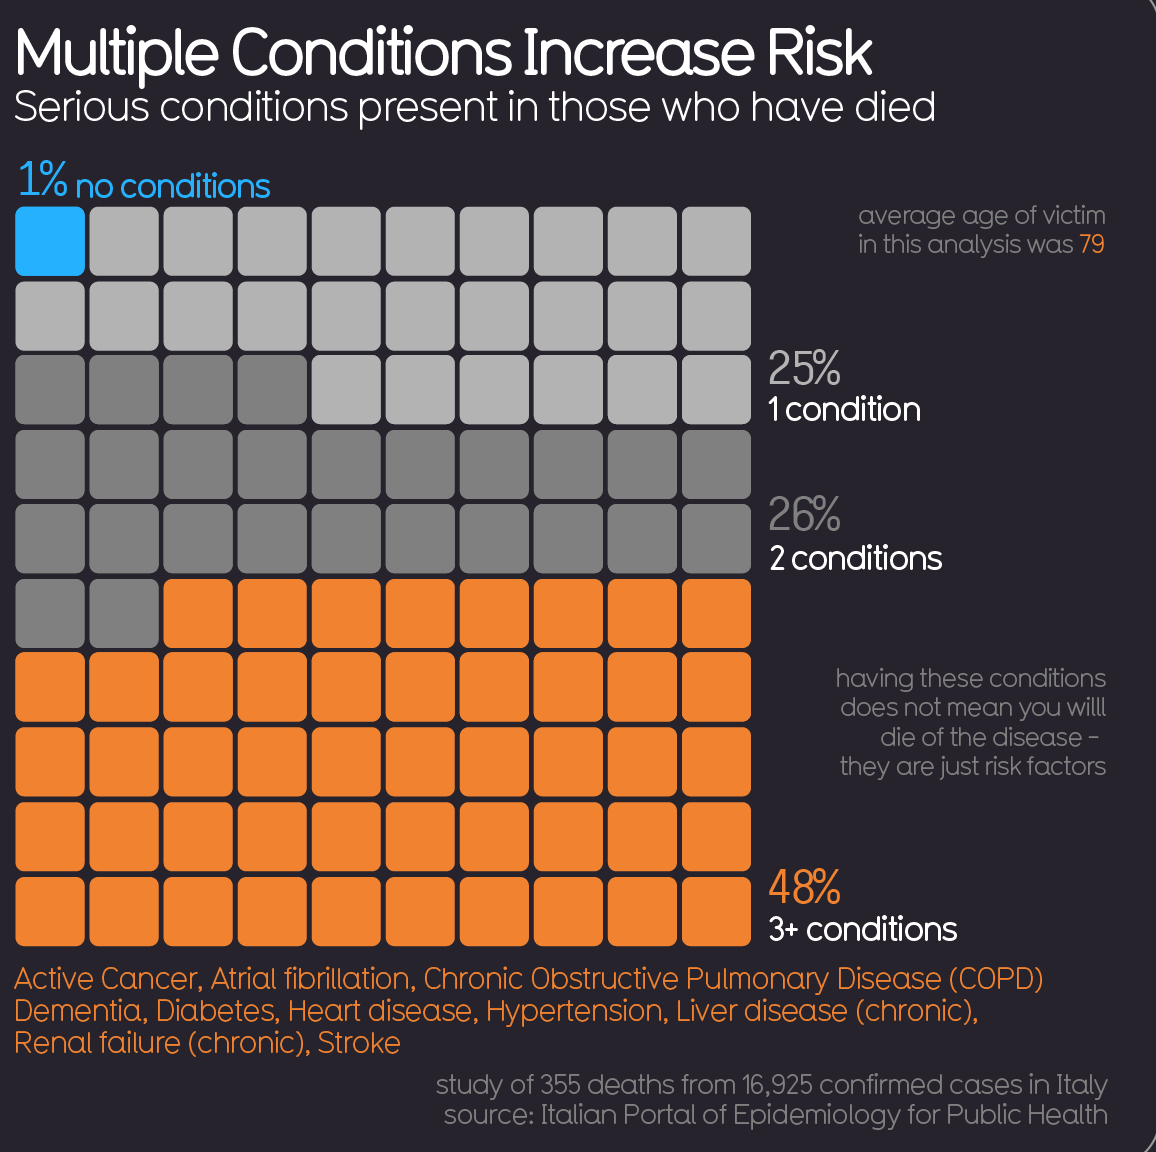
Like Malaria, the coronavirus “ROBS” red blood cells of the ability to “collect and transfer” oxygen to wherever it is needed. This results in lower and lower Oxygen levels.. organs start to fail as they can’t get enough oxygen to function properly.. people die…. this alone is likely why those who already have eg Kidney or Heart, or Liver Failure, have a high morbidity.. also anyone who doesn’t have a SPLEEN is at VERY high risk as the spleen is involved with filtering your blood. The spleen affects the number of red blood cells that carry oxygen throughout your body, by breaking down and removing cells that are abnormal, old, or damaged.. also If you have COPD, or are a smoker, and/or have Cardiovascular Disease, you ALREADY have impaired Oxygen transport mechanisms, so this is another perfectly logical co-morbidity!

In this article, the Red Blood Cells (RBCs) are compared to truck cabs running around furiously with no payload (OXYGEN).. so simply pumping oxygen into the lungs under pressure will NOT work, unless you address the “diseased “Red Blood Cells, which are the OXYGEN CARRIERS. which both Quinine derivatives and Z-Pak address, along with (interestingly!) Vitamin C and other “cell-protective” Antioxidants address.

NOW it makes perfect sense.. the biggest clue is that the “pneumonia” is always bilateral with COVID-19, unlike almost every other case of pneumonia which typically affects just ONE lung! 

The body’s response to low Oxygen levels is to make more red blood cells, so that is why high red blood cell levels are also found in the sickest patients.

Covid-19 had us all fooled, but now we might have finally found its secret.

A more detailed explanation from link mentioned in text above:

In the last 3–5 days, a mountain of anecdotal evidence has come out of NYC, Italy, Spain, etc. about COVID-19 and characteristics of patients who get seriously ill. It’s not only piling up but now leading to a general field-level consensus backed up by a few previously little-known studies that we’ve had it all wrong the whole time. Well, a few had some things eerily correct (cough Trump cough), especially with Hydroxychloroquine with Azithromicin, but we’ll get to that in a minute.

There is no ‘pneumonia’ nor ARDS. At least not the ARDS with established treatment protocols and procedures we’re familiar with. Ventilators are not only the wrong solution, but high pressure intubation can actually wind up causing more damage than without, not to mention complications from tracheal scarring and ulcers given the duration of intubation often required… They may still have a use in the immediate future for patients too far to bring back with this newfound knowledge, but moving forward a new treatment protocol needs to be established so we stop treating patients for the wrong disease.

The past 48 hours or so have seen a huge revelation: COVID-19 causes prolonged and progressive hypoxia (starving your body of oxygen) by binding to the heme groups in hemoglobin in your red blood cells. People are simply desaturating (losing o2 in their blood), and that’s what eventually leads to organ failures that kill them, not any form of ARDS or pneumonia. All the damage to the lungs you see in CT scans are from the release of oxidative iron from the hemes, this overwhelms the natural defenses against pulmonary oxidative stress and causes that nice, always-bilateral ground glass opacity in the lungs. Patients returning for re-hospitalization days or weeks after recovery suffering from apparent delayed post-hypoxic leukoencephalopathy strengthen the notion COVID-19 patients are suffering from hypoxia despite no signs of respiratory ‘tire out’ or fatigue.

Here’s the breakdown of the whole process, including some ELI5-level cliff notes. Much has been simplified just to keep it digestible and layman-friendly.

Your red blood cells carry oxygen from your lungs to all your organs and the rest of your body. Red blood cells can do this thanks to hemoglobin, which is a protein consisting of four “hemes”. Hemes have a special kind of iron ion, which is normally quite toxic in its free form, locked away in its center with a porphyrin acting as it’s ‘container’. In this way, the iron ion can be ‘caged’ and carried around safely by the hemoglobin, but used to bind to oxygen when it gets to your lungs.

When the red blood cell gets to the alveoli, or the little sacs in your lungs where all the gas exchange happens, that special little iron ion can flip between FE2+ and FE3+ states with electron exchange and bond to some oxygen, then it goes off on its little merry way to deliver o2 elsewhere.

covid-19-research1

Here’s where COVID-19 comes in. Its glycoproteins bond to the heme, and in doing so that special and toxic oxidative iron ion is “disassociated” (released). It’s basically let out of the cage and now freely roaming around on its own. This is bad for two reasons:

1) Without the iron ion, hemoglobin can no longer bind to oxygen. Once all the hemoglobin is impaired, the red blood cell is essentially turned into a Freightliner truck cab with no trailer and no ability to store its cargo.. it is useless and just running around with COVID-19 virus attached to its porphyrin. All these useless trucks running around not delivering oxygen is what starts to lead to desaturation, or watching the patient’s spo2 levels drop. It is INCORRECT to assume traditional ARDS and in doing so, you’re treating the WRONG DISEASE. Think of it a lot like carbon monoxide poisoning, in which CO is bound to the hemoglobin, making it unable to carry oxygen. In those cases, ventilators aren’t treating the root cause; the patient’s lungs aren’t ‘tiring out’, they’re pumping just fine. The red blood cells just can’t carry o2, end of story. Only in this case, unlike CO poisoning in which eventually the CO can break off, the affected hemoglobin is permanently stripped of its ability to carry o2 because it has lost its iron ion. The body compensates for this lack of o2 carrying capacity and deliveries by having your kidneys release hormones like erythropoietin, which tell your bone marrow factories to ramp up production on new red blood cells with freshly made and fully functioning hemoglobin. This is the reason you find elevated hemoglobin and decreased blood oxygen saturation as one of the 3 primary indicators of whether the shit is about to hit the fan for a particular patient or not.

2) That little iron ion, along with millions of its friends released from other hemes, are now floating through your blood freely. As I mentioned before, this type of iron ion is highly reactive and causes oxidative damage. It turns out that this happens to a limited extent naturally in our bodies and we have cleanup & defense mechanisms to keep the balance. The lungs, in particular, have 3 primary defenses to maintain “iron homeostasis”, 2 of which are in the alveoli, those little sacs in your lungs we talked about earlier. The first of the two are little macrophages that roam around and scavenge up any free radicals like this oxidative iron. The second is a lining on the walls (called the epithelial surface) which has a thin layer of fluid packed with high levels of antioxidant molecules.. things like abscorbic acid (AKA Vitamin C) among others. Well, this is usually good enough for naturally occurring rogue iron ions but with COVID-19 running rampant your body is now basically like a progressive state letting out all the prisoners out of the prisons… it’s just too much iron and it begins to overwhelm your lungs’ countermeasures, and thus begins the process of pulmonary oxidative stress. This leads to damage and inflammation, which leads to all that nasty stuff and damage you see in CT scans of COVID-19 patient lungs.

Ever noticed how it’s always bilateral? (both lungs at the same time) Pneumonia rarely ever does that, but COVID-19 does… EVERY. SINGLE. TIME.

The core point being, treating patients with the iron ions stripped from their hemoglobin (rendering it abnormally nonfunctional) with ventilator intubation is futile, unless you’re just hoping the patient’s immune system will work its magic in time. The root of the illness needs to be addressed.

Best case scenario? Treatment regimen early, before symptoms progress too far. Hydroxychloroquine (more on that in a minute, I promise) with Azithromicin has shown fantastic, albeit critics keep mentioning ‘anecdotal’ to describe the mountain, promise and I’ll explain why it does so well next. But forget straight-up plasma with antibodies, that might work early but if the patient is too far gone they’ll need more. They’ll need all the blood: antibodies and red blood cells. No help in sending over a detachment of ammunition to a soldier already unconscious and bleeding out on the battlefield, you need to send that ammo along with some hemoglobin-stimulant-magic so that he can wake up and fire those shots at the enemy.

The story with Hydroxychloroquine

All that hilariously misguided and counterproductive criticism the media piled on chloroquine (purely for political reasons) as a viable treatment will now go down as the biggest Fake News blunder to rule them all. The media actively engaged their activism to fight ‘bad orange man’ at the cost of thousands of lives. Shame on them.

How does chloroquine work? Same way as it does for malaria. You see, malaria is this little parasite that enters the red blood cells and starts eating hemoglobin as its food source. The reason chloroquine works for malaria is the same reason it works for COVID-19 — while not fully understood, it is suspected to bind to DNA and interfere with the ability to work magic on hemoglobin. The same mechanism that stops malaria from getting its hands on hemoglobin and gobbling it up seems to do the same to COVID-19 (essentially little snippets of DNA in an envelope) from binding to it. On top of that, Hydroxychloroquine (an advanced descendant of regular old chloroquine) lowers the pH which can interfere with the replication of the virus.

Again, while the full details are not known, the entire premise of this potentially ‘game changing’ treatment is to prevent hemoglobin from being interfered with, whether due to malaria or COVID-19.

Update: A more technical discussion and link to published research is here:

Research Reveals That COVID-19 Attacks Hemoglobin In Red Blood Cells, Rendering It Incapable Of Transporting Oxygen.

Virus Models Are Accountable. Climate Models Not.

Paul Driessen and David Legates write at the Hill about what we are learning from coronavirus epidemic models, and why we should remain skeptical about forecasts from climate models. His article is Fauci-Birx Climate Models? Excerpts in italics with my bolds and images.

President Trump and his Coronavirus Task Force presented some frightening numbers during their March 31 White House briefing. Based on now two-week-old data and models, as many as 100,000 Americans at the models’ low end, to 2.2 million at their high end, could die from the fast-spreading virus, they said.

However, the president, vice president, and Drs. Anthony Fauci and Deborah Birx hastened to add that those high-end numbers are based on computer models. And they are “unlikely” if Americans keep doing what they are doing now to contain, mitigate and treat the virus. Although that worst-case scenario “is possible,” it is “unlikely if we do the kinds of things that we’re essentially outlining right now.”

On March 31, Dr. Fauci said, the computer models were saying that, even with full mitigation, it is “likely” that America could still suffer at least 100,000 deaths. But he then added a very important point:

“The question is, are the models really telling us what’s going on? When someone creates a model, they put in various assumptions. And the models are only as good and as accurate as the assumptions you put into them. As we get more data, as the weeks go by, that might change. We feed the data back into the models and relook at the models.”

The data can change the assumptions – and thus the models’ forecasts.

“If we have more data like the NY-NJ metro area, the numbers could go up,” Dr. Birx added. But if the numbers coming in are more like Washington or California, which reacted early and kept their infection and death rates down – then the models would likely show lower numbers. “We’re trying to prevent that logarithmic increase in New Orleans and Detroit and Chicago – trying to make sure those cities work more like California than like the New York metro area.” That seems to be happening, for the most part.

If death rates from corona are misattributed or inflated, if other model assumptions should now change, if azithromycin, hydroxychloroquine and other treatments, and people’s immunities are reducing infections – then business shutdowns and stay-home orders could (and should) end earlier, and we can go back to work and life, rebuild America and the world’s economies …

And avoid different disasters, like these:

    • Millions of businesses that never reopen.
    • Tens of millions of workers with no paychecks.
    • Tens of trillions of dollars vanished from our economy.
    • Millions of families with lost homes and savings.
    • Millions of cases of depression, stroke, heart attack, domestic violence, suicide, murder-suicide, and early death due to depression, obesity and alcoholism, due to unemployment, foreclosure and destroyed dreams.

In other words, numerous deaths because of actions taken to prevent infections and deaths from COVID-19.

It is vital that they recheck the models and assumptions – and distinguish between COVID-19 deaths actually due to the virus … and not just associated with or compounded by it, but primarily due to age, obesity, pneumonia or other issues. We can’t afford a cure that’s worse than the disease – or a prolonged and deadly national economic shutdown that could have been shortened by updated and corrected models.

Now just imagine: What if we could have that same honest, science-based approach to climate models?

What if the White House, EPA, Congress, UN, EU and IPCC acknowledged that climate models are only as good and as accurate as the assumptions built into them? What if – as the months and years went by and we got more real-world temperature, sea level and extreme weather data – we used that information to honestly refine the models? Would the assumptions and therefore the forecasts change dramatically?

What if we use real science to help us understand Earth’s changing climate and weather? And base energy and other policies on real science that honestly examines manmade and natural influences on climate?

Many climate modelers claim we face existential manmade climate cataclysms caused by our use of fossil fuels. They use models to justify calls to banish fossil fuels that provide 80% of US and global energy; close down countless industries, companies and jobs; totally upend our economy; give trillions of dollars in subsidies to fossil fuel replacement companies; and drastically curtail our travel and lifestyles.

Shouldn’t we demand that these models be verified against real-world evidence?

Natural forces have caused climate changes and extreme weather events throughout history. What proof is there that what we see today is due to fossil fuel emissions, and not to those same natural forces? We certainly don’t want energy “solutions” that don’t work and are far worse than the supposed manmade climate and weather ‘virus.’

And we have the climate data. We’ve got years of data. The data show the models don’t match reality.

Model-predicted temperatures are more than 0.5 degrees F above actual satellite-measured average global temperatures – and “highest ever” records are mere hundredths of a degree above previous records from 50 to 80 years ago. Actual hurricane, tornado, sea level, flood, drought, and other historic records show no unprecedented trends or changes, no looming crisis, no evidence that humans have replaced the powerful natural forces that have always driven climate and weather in the real world outside the modelers’ labs.

Real science – and real scientists – seek to understand natural phenomena and processes. They pose hypotheses that they think best explain what they have witnessed, then test them against actual evidence, observations and data. If the hypotheses (and predictions based on them) are borne out by their subsequent observations or findings, the hypotheses become theories, rules or laws of nature – at least until someone finds new evidence that pokes holes in their assessments, or devises better explanations.

Real scientists often employ computers to analyze data more quickly and accurately, depict or model complex natural systems, or forecast future events or conditions. But they test their models against real-world evidence. If the models, observations and predictions don’t match up, real scientists modify or discard the models, and the hypotheses behind them. They engage in robust discussion and debate.

Real scientists don’t let models or hypotheses become substitutes for real-world data, evidence and observations.

They don’t alter or “homogenize” raw or historic data to make it look like the models actually work. They don’t tweak their models after comparing predictions to actual subsequent observations, to make it look like the models “got it right.” They don’t “lose” or hide data and computer codes, restrict peer review to closed circles of like-minded colleagues who protect one another’s reputations and funding, claim “the debate is over,” or try to silence anyone who asks inconvenient questions or criticizes their claims or models. Climate modelers have done all of this – and more.

Climate models have always overstated the warming. But even though modelers have admitted that their models are “tuned” – revised after the fact to make it look like they predicted temperatures accurately – the modelers have made no attempt to change the climate sensitivity to match reality. Why not?

They know disaster scenarios sell. Disaster forecasts keep them employed, swimming in research money – and empowered to tell legislators and regulators that humanity must we take immediate, draconian action to eliminate all fossil fuel use – the economic, human and environmental consequences be damned. And they probably will never admit their mistakes or duplicity, much less be held accountable.

“Wash your hands! You could save millions of lives!” has far more impact than “You could save your own life, your kids’ lives, dozens of lives.” When it comes to climate change, you’re saving the planet.

With ‘Mann-made’ climate change, we are always shown the worst-case scenario: RCP 8.5, the “business-as-usual” … ten times more coal use in 2100 than now … “total disaster.” Alarmist climatologists know their scenario has maybe a 0.1 percent likelihood, and assumes no new energy technologies over the next 80 years. But energy technologies have evolved incredibly over the last 80 years – since 1940, the onset of World War II! Who could possibly think technologies won’t change at least as much going forward?

Disaster scenarios are promoted because most people don’t know any better – and voters and citizens won’t accept extreme measures and sacrifices unless they are presented with extreme disaster scenarios.

The Fauci-Birx team has been feeding updated data into their models, and forecasts for infections and deaths from the ChiCom-WHO coronavirus are going down. They team is doing data-based science. Let’s start demanding a similarly honest, factual, evidence-based approach to climate models and “dangerous manmade climate change.” Our energy, economy, livelihoods, lives and liberties depend on it.

Paul Driessen is senior policy analyst for the Committee For A Constructive Tomorrow (www.CFACT.org) and author of books and articles on energy, environment, climate and human rights issues. David R. Legates is a Professor of Climatology at the University of Delaware.

Coronavirus Statistical Games

Robert Stacy McCain writes at the Spectator Coronavirus: Statistical Stupidity Excerpts in italics with my bolds and images.

Why were “smart” people so wrong about this pandemic?

Two weeks ago, Dr. Deborah Birx warned against doomsday predictions that millions of Americans might die from coronavirus. At a White House press briefing on March 25, the coordinator of President Trump’s task force condemned media speculation based on claims that as much as half the country’s population might become infected with COVID-19. “I think the numbers that have been put out there are actually very frightening to people,” said Birx, adding that reported rates of infection in China, where the virus originated, were “nowhere close to the numbers that you see people putting out there. I think it has frightened the American people.”

Birx did not name MSNBC personality Chris Hayes, although he was one of the worst scaremongers in the media mob. On his March 23 program, Hayes warned that “millions of lives are on the line” if the economic lockdown response to the virus was not extended indefinitely: “There is no option to just let everyone go back out and go back to normal if a pandemic rages across the country and infects 50 percent of the population and kills a percentage point at the low end of those infected and also melts down all the hospitals.” Applying simple arithmetic to that sentence — treating it like one of those word problems we learned to do in middle-school math class — we find that 50 percent of the U.S. population is more than 160 million people infected with COVID-19. If just 1 percent of those infected died from the virus, that would mean a death toll of at least 1.6 million.

The word “if” signifies a hypothetical contingency, but the way Hayes used the word implied a predictive quality to his speculation about “millions of lives” at jeopardy in a rampaging coronavirus outbreak. And who can say, really, what might have happened in some imagined alternative scenario? As it happened in real life, however, Trump decided to extend the “social distancing” policy to April 30, most Americans took the recommended precautions seriously, and there is already evidence that we have begun to “flatten the curve,” so that the final U.S. death toll of COVID-19 will likely be a mere fraction of the “millions” about which Hayes warned last month.

Chris Hayes is not stupid, and neither are the scientists whose forecasting models wildly exaggerated the trajectory of this pandemic. Smart people can be wrong, too. Monday, just hours after I called attention to the failure of these doomsday prophecies (“Coronavirus: The Wrong Numbers”), the widely cited Institute for Health Metrics and Evaluation (IHME) made headlines by revising their forecast: “Key Coronavirus Model Now Predicts Many Fewer U.S. Deaths” (New York magazine), “Dramatic Reduction in COVID-19 Disaster Projections” (National Review), and “Coronavirus Model Now Estimates Fewer U.S. Deaths” (U.S. News & World Report), to cite a few.

Why were the original IMHE projections, first published March 26, so far off the mark? We don’t know. Perhaps the scientists underestimated the efficacy of the “mitigation” measures Trump announced March 16. Or possibly the use of chloroquine — which Trump controversially called a “game changer” — to combat the virus was more successful than any of the president’s critics are willing to admit. But the fact is, the projection models were wrong, and the gap between what was predicted and what actually happened became apparent within a matter of days. By April 1, as Justin Hart pointed out, the number of COVID-19 patients hospitalized was less than a third of the number projected by the IHME model. In their revised forecast issued Monday, IHME lowered its estimate of total U.S. coronavirus deaths by 12 percent, from 93,531 down to 81,766.

Even this revised forecast may be too pessimistic, however. At his Tuesday press conference, New York Gov. Andrew Cuomo, whose state is the epicenter of the U.S. outbreak, spoke of a “plateau” in the number of COVID-19 cases in the state’s hospitals, with about 17,500 patients currently hospitalized, about 4,600 of those in intensive-care units. This is very bad, but it is not the system-crashing catastrophe Cuomo was anticipating when, at a March 24 press conference, he angrily shouted that a shortage of ventilators would cause 26,000 unnecessary deaths in the state. While we cannot predict future events, it appears that New York now has more ventilators than will ever be needed to cope with the coronavirus outbreak — and this is good news.

Such hopeful signs that we have avoided the worst-case scenarios are probably little comfort to doctors and nurses working double shifts to cope with the COVID-19 patient load in New York City and its suburbs, or in other places around the country dealing with severe local outbreaks of the virus. At Monday’s White House briefing, Birx spoke of her team’s tracking of the pandemic at a “county by county” level, citing Detroit and New Orleans as examples of the hot spots where federal authorities are helping communities cope with the problem. At a time when more than 1,000 Americans are dying daily from this disease, the good news — that the pandemic is falling short of the catastrophe previously predicted — is a matter of comparison between a reality that is still quite bad and a doomsday scenario where MSNBC viewers were told that “millions of lives” might be lost.

What was Chris Hayes doing when he hyped fears of a raging pandemic that would overwhelm the health-care system and kill 1.6 million Americans, 200 times more than the 80,000 currently projected by the IMHE model? He was blaming Trump for having failed to prevent the approaching “doom and death.” The more deaths, the more blame — that was apparently why the Greek chorus of media fear-mongers (Hayes was by no means alone in this) were so eager to promote the worst-case scenarios that did not materialize. America’s coronavirus death rate (39 per 1 million residents) is currently a fraction of the rates in several European countries, including Spain (300 per million), Italy (283 per million), France (158 per million), and Belgium (176 per million). Trump’s critics accuse our president of failing to prepare America for this crisis, but where is their criticism for the leaders of the European countries, who, as measured by statistics, failed far worse? Dead people are not statistics, of course, and many thousands of Americans are now fighting for their lives against this Chinese virus.

Oh, wait — we’re not allowed to mention where this disease came from, are we? One might hope that Chris Hayes and the other media fear-mongers would spend more time blaming the communist regime in Beijing and less time accusing our president of malicious indifference to American lives. But we should not think the media’s failures prove that they’re stupid.

They’re smart people who know exactly what they’re doing. And they should be ashamed of themselves.

See Also: Canadian Flu vs. Kung Flu

A Lesson in Mortality

A Lesson in Mortality

Clearly the coronavirus outbreak has aroused the fear of dying that is always just beneath the surface of awareness. Most of us are closer to being snowflakes than warriors, and thus secure in our artificial physical and cyberspaces. With only virtual threats serving as entertainment, the notion that we could actually die from an unseen virus is terrifying.

Meanwhile, mass media is following the global warming/climate change game plan: Hose the public with a tsunami of large numbers, guaranteed to cow them into fearful submission. That approach backfired with climate claims since anyone who bothered to check could verify that nothing out of the ordinary has yet happened. But the viral emergency is different: It is happening and people are dying from Kung Flu! Or are we again being besieged with numbers out of context in order to feed on our fear of mortality?

It occurred to me that unless you are a public health professional or an actuary, you pay little or no attention to morbidity statistics, and thus have no basis to judge how serious is this crisis. For example, every day In every province, elected officials along with health officials are messaging us that things are dire, even “unprecedented”, and all we can do is put our lives on hold in order to save them. I am following the restrictions but can’t help wondering about the level of exaggeration.

For example, here are some mortality facts in Canada, where I live. Source: Deaths and age-specific mortality rates, by selected grouped causes, Statistics Canada.

ln the last reported statistical year (2018) the top twelve causes resulted in 209,290 deaths, or 574 people dying every day. When we add in the less lethal killers, in 2018 in Canada, 283,706 people died, or 777 every day. This is not abnormal, but is the ongoing reality of our society where lives end for all kinds of reasons to make room for infants to be born and take their place among us. Below are the tables for the last five years to show how this level of mortality is our ordinary state.

Canada Leading Causes of Death

Causes of Death 2014 2015 2016 2017 2018
Cancers 77,059 77,054 79,084 79,844 79,536
Heart Disease 51,014 51,534 51,396 53,029 53,134
Arteries 13,573 13,795 13,551 13,893 13,480
Accidents 11,724 11,833 12,524 13,894 13,290
Chronic Lung Disease 11,876 12,573 12,293 12,847 12,998
Flu and Pneumonia 6,597 7,630 6,235 7,396 8,511
Diabetes 7,071 7,172 6,838 6,882 6,794
Alzheimer’s 6,410 6,587 6,521 6,675 6,429
Other infections 4,881 4,964 4,168 4,272 4,578
Suicides 4,254 4,405 3,978 4,157 3,811
Kidneys 3,098 3,129 3,054 3,270 3,615
Liver 3,126 3,176 3,385 3,425 3,514
Total Top 12 Causes 200,683 203,852 203,027 209,584 209,690
Total All causes 258,821 264,333 267,213 276,689 283,706
Population 35,437,435 35,702,908 36,109,487 36,543,321 37,057,765

There are many things to note here. The diseases of cancers, heart and arteries dominate in the aged cohorts of our society, and show that the bulk of the population is not threatened by diseases that wreak havoc in many parts of the world. Note how far down is the batch of other infections, including such as malaria, cholera, HIV. The overall death rate in Canada is about 0.75% of the population each year.

With the Wuhan virus raging, our attention is drawn to the middle portion of the figure: deaths caused by lung failure. Chronic lung disease kills more, but close behind is flu and bacterial infections leading to pneumonia. This is important because Kung Flu in its severe manifestation is essentially viral pneumonia.

All of the deaths in the tables above are identified according to the International Classifications for Diseases.  On March 24, 2020 a new ICD code was established to designate deaths caused by Covid 19.

The notice included these instructions:
The WHO has provided a second code, U07.2, for clinical or epidemiological diagnosis of COVID-19 where a laboratory confirmation is inconclusive or not available. Because laboratory test results are not typically reported on death certificates in the U.S., NCHS is not planning to implement U07.2 for mortality statistics.

Will COVID-19 be the underlying cause? The underlying cause depends upon what and where conditions are reported on the death certificate. However, the rules for coding and selection of the underlying cause of death are expected to result in COVID19 being the underlying cause more often than not.

What happens if the terms reported on the death certificate indicate uncertainty? If the death certificate reports terms such as “probable COVID-19” or “likely COVID-19,” these terms would be assigned the new ICD code. It Is not likely that NCHS will follow up on these cases. If “pending COVID-19 testing” is reported on the death certificate, this would be considered a pending record. In this scenario, NCHS would expect to receive an updated record, since the code will likely result in R99. In this case, NCHS will ask the states to follow up to verify if test results confirmed that the decedent had COVID19.

The impact of this coding policy is seen in Canada’s record of Covid deaths.  From the first identified case on January 31, 2020, there were a total of 27 deaths reported as caused by Covid 19 over the 35 days up to March 24, 0.8 deaths per day.  In the last 13 days since the ICD was issued, 296 Covid 19 deaths have been added, an average of 23 per day. For context, note that in 2018 Flu and Pneumonia deaths averaged 23 a day, obviously much higher than that during winter months.

Comparing last year’s flu season to this one shows the last five weeks a sharp uptick in tests but with a sharp drop in positives . Could it be Covid19 making the difference? Note also the scale of testing is much higher this year, begiinning in January.  (Red line is Flu A, blue line is Flu B positives)

Worldometer showed on March 24, 2020, almost 19,000 Covid 19 deaths had been reported globally going back to January 23, an average of 305 per day over 62 days. After the code was announced, 50,533 Covid 19 deaths were reported in just 12 days, a daily average of 4211.

There are epidemic numbers being generated, and no doubt some places have seen hospitals overwhelmed (Lombardy, NYC, Tehran, etc.).  But is it really a pandemic (everywhere)?  And how many deaths from pneumonia and other causes are classified differently in this feverish environment?

The guidance will result in attributing deaths to Covid 19 in all cases where the virus was probably or certainly present. However, the experience so far shows that the large majority of severe cases include multiple serious conditions. Because the Mortality results are compiled more slowly (2019 is forthcoming), we have no way of knowing how many 2020 flu and pneumonia deaths have been counted as Kung Flu deaths instead of using the previous codes.

Indur M. Goklany commented on this issue: How to analyze and not analyze #COVID-19 deaths

Don’t look just at deaths from coronavirus, look at cumulative deaths from comorbidities. Since most people dying from coronavirus also exhibit comorbidities,[1] and it is unclear how deaths are assigned to the former rather than one of the co-morbidities and whether there is a uniform accepted methodology from one doctor to another (or one hospital to another or one country to another) in the assignments, it is not clear how much credence can be given to coronavirus death estimates at this time.

This also means that we shouldn’t attempt cross-country and cross-jurisdictional comparisons because they could mislead. It is best to look at (and compare) aggregate excess deaths from all co-morbidities rather than just one or another co-morbidity. I would suggest looking at excess deaths against an average over the last 5-10 years for both all-cause deaths and deaths from all coronavirus-plus- comorbidities to get an idea about how devastating coronavirus has been versus an average year.

I wouldn’t be surprised if at the end of the current period with most populated areas currently shut in by individual choice or government decree, once all the data are in, excess deaths for all causes are not negative relative to the 5- or 10-year average, since physical distancing should also reduce transmission of the flu (influenza and pneumonia kill about 50,000+ Americans annually)[2]. At least, I would hope that would be the case, so we can look back and see that some good came of our flattening our economy. At least one can hope.

Footnote: Meanwhile at least one doctor working with Covid 19 patients is questioning the medical paradigm identifying the disease as a viral pneumonia. 

Listen this short video:  Dr. Cameron Kyle-Sidell, a doctor treating COVID-19 patients in New York City’s Maimonides Medical Center, warns that the medical community may be wrong about the nature of the coronavirus and how it is said to cause acute respiratory distress syndrome (ARDS).

There’s no cooler way to get around Mazatlan, Mexico, than riding in an open air pulmonia. And yes, the name means Pneumonia in english. When these vehicles first became available and popular, traditional taxi owners started a rumor you could catch the disease from riding in them.

Canadian Flu vs. Kung Flu

With coronavirus sucking all the air out of room globally, I got interested in looking at how the Canadian national flu seasons compare with the new Wuhan virus. The analysis is important since there are many nations at higher latitudes that are in equilibrium relative to infectious diseases, but vulnerable to outbreaks of new viruses. Where I live in Canada, we have winter outbreaks every year, but are protected by a combination of sanitary practices, health care system and annual vaccines, contributing to herd immunity.

For example, 2018-19 was slightly higher than a typical year, with this pattern:
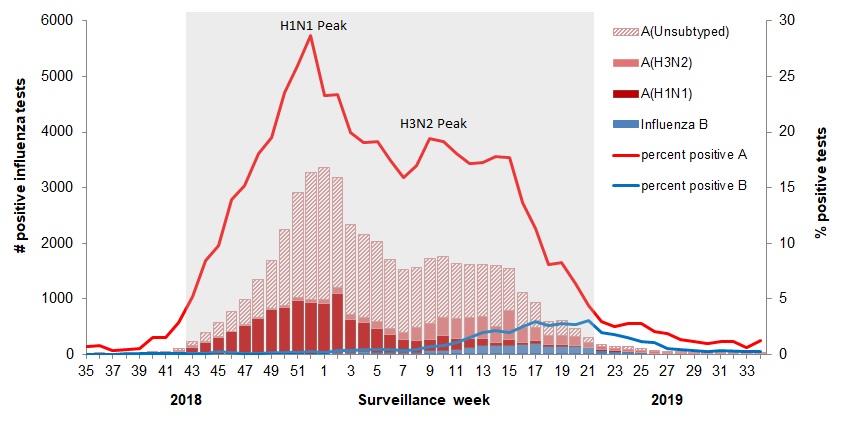
The various flu types are noted, all together making a total of 48,818 influenza detections during the 2018-19 season. A total of 946 hospitalizations were reported by CIRN-SOS sentinels that season (age = or >16).  Source:  Annual Influenza Reports

A total of 137 (14%) ICU admissions and 65 (7%) deaths were reported.  The seasonality is obvious, as is the social resilience, when we have the antibodies in place.

For further background, look at the latest Respiratory Virus Report for week 13 ending March 28, 2020. [In this Respiratory Virus Report, the number of detections of coronavirus reflects only seasonal human coronaviruses, not the novel pandemic coronavirus (SARS-CoV2) that causes COVID-19. More on Kung Flu later on.]

For the period shown in the graph, 320560 flu tests were done, resulting in 32751 type A positives and 22683 type B positives. That is a ratio of 17% of tests confirming conventional flu infection cases. Public Health Canada went on to say in reporting March 22 to 28, 2020 (week 13):
The percentage of tests positive for influenza fell below 5% this week. This suggests that Canada is nearing the end of the 2019-2020 influenza season at the national level. [Keep that 5% in mind]

Kung Flu in Canada is reported at Coronavirus disease (COVID-19): Outbreak update

From the underlying data we can see that this covid 19 outbreak started toward the end of the annual flu season. Here are the daily reported tests, cases, and deaths smoothed with 7 day averaging.

The cumulative graph shows how the proportions held during this period.
Out of a total 295,065 tests, 12537 (4.2%) cases were detected, and 187 died(1.5% of cases).

Summary:  It’s true that cases and deaths are still rising, and everyone should practice sanitary behaviors and social distancing.  But it appears that we are weathering this storm and have the resources to beat it.  Let us hope for reasonable governance, Spring weather and a return to economic normalcy.

Meet Bering and Okhotsk Seas

Now that Arctic ice peak has passed, the Pacific basins of Bering and Okhotsk take center stage, providing most of the open water reducing ice extents.  The animation above shows in the last 3 weeks Bering on the right lost half of its ice, down from 820k km2 to 450k km2 yesterday.  Meanwhile Okhotsk on the left declined from 1080k km2 to 650k km2.  Those losses make up entirely the 530k km2 Arctic deficit to average at this time.

Background on Okhotsk Sea

NASA describes Okhotsk as a Sea and Ice Factory. Excerpts in italics with my bolds.

The Sea of Okhotsk is what oceanographers call a marginal sea: a region of a larger ocean basin that is partly enclosed by islands and peninsulas hugging a continental coast. With the Kamchatka Peninsula, the Kuril Islands, and Sakhalin Island partly sheltering the sea from the Pacific Ocean, and with prevailing, frigid northwesterly winds blowing out from Siberia, the sea is a winter ice factory and a year-round cloud factory.

The region is the lowest latitude (45 degrees at the southern end) where sea ice regularly forms. Ice cover varies from 50 to 90 percent each winter depending on the weather. Ice often persists for nearly six months, typically from October to March. Aside from the cold winds from the Russian interior, the prodigious flow of fresh water from the Amur River freshens the sea, making the surface less saline and more likely to freeze than other seas and bays.


Map of the Sea of Okhotsk with bottom topography. The 200- and 3000-m isobars are indicated by thin and thick solid lines, respectively. A box denotes the enlarged portion in Figure 5. White shading indicates sea-ice area (ice concentration ⩾30%) in February averaged for 2003–11; blue shading indicates open ocean area. Ice concentration from AMSR-E is used. Color shadings indicate cumulative ice production in coastal polynyas during winter (December–March) averaged from the 2002/03 to 2009/10 seasons (modified from Nihashi and others, 2012, 2017). The amount is indicated by the bar scale. Source: Cambridge Core

Bering Sea Ice is Highly Variable

The animation above shows Bering Sea ice extents at April 2 from 2007 to 2020.  The large fluctuation is evident, much ice in 2012 -13 and almost none in 2018, other years in between.  Given the alarmist bias, it’s no surprise which two years are picked for comparison:

Source: Seattle Times ‘We’ve fallen off a cliff’: Scientists have never seen so little ice in the Bering Sea in spring.

Taking a boat trip from Hokkaido Island to see Okhotsk drift ice is a big tourist attraction, as seen in the short video below.  Al Gore had them worried back then, but not now.

Drift ice in Okhotsk Sea at sunrise.

Breaking: Onion Emergency Headline System

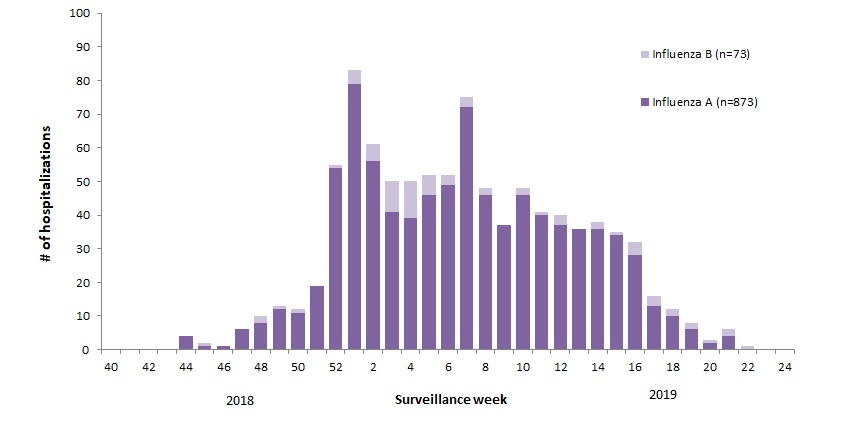
CHICAGO—WARNING WARNING ALERT ALERT ALERT ALERT, sources confirmed Thursday that this is a test of The Onion’s Emergency Headline System. Please excuse this interruption from your previously scheduled headlines while The Onion reviews its emergency content protocol. Doom doom doom doom doom doom doom doom doom doom doom doom doom doom doom doom doom doom doom doom doom doom doom. This is only a test. Doom doom doom. This is not a real article. Doom doom doom. The Onion’s Emergency Headline System is conducting a test. Doom doom doom. The Onion doom doom doom broadcasters in your area doom doom doom in voluntary cooperation doom doom doom with federal, state, and local authorities have doom doom doom developed this system doom doom doom to keep you informed doom doom doom in the event doom doom doom of a headline emergency. Doom doom doom. Several reports indicated that if you have received this article, the test was a success, no further action is required, and you may return to your regularly scheduled content

See Also:

Golden Corral Introduces Carry-Out 150-Choice Buffet

CORONAVIRUS LOCKDOWN DAY THREE: Scientists No Closer To Understanding How Pressing Buzzer Unlocks Apartment Door

‘The Onion’ Glossary To Coronavirus Pandemic Terms

Study Finds Most Restaurants Fail Within First Year Of It Becoming Illegal To Go To Them

The Impact Of Coronavirus On Education

5 Things To Do While Self-Isolating During A Health Pandemic


Why Halting Failed Auto Fuel Standards 2020 Update

Update April 2, 2020: Much in the news today is the EPA relaxing of Obama-era auto fuel standards, along with the usual Trump bashing and complaining while ignoring why the efficiency rules were ill-advised. Text from a previous post is printed below explaining this positive development.

There are deeper reasons why US auto fuel efficiency standards are and should be rolled back.  They were instituted in denial of regulatory experience and science.  First, a parallel from physics.

In the sub-atomic domain of quantum mechanics, Werner Heisenberg, a German physicist, determined that our observations have an effect on the behavior of quanta (quantum particles).

The Heisenberg uncertainty principle states that it is impossible to know simultaneously the exact position and momentum of a particle. That is, the more exactly the position is determined, the less known the momentum, and vice versa. This principle is not a statement about the limits of technology, but a fundamental limit on what can be known about a particle at any given moment. This uncertainty arises because the act of measuring affects the object being measured. The only way to measure the position of something is using light, but, on the sub-atomic scale, the interaction of the light with the object inevitably changes the object’s position and its direction of travel.

Now skip to the world of governance and the effects of regulation. A similar finding shows that the act of regulating produces reactive behavior and unintended consequences contrary to the desired outcomes.

US Fuel Economy (CAFE) Standards Have Backfired

An article at Financial Times explains about Energy Regulations Unintended Consequences  Excerpts below with my bolds.

Goodhart’s Law holds that “any observed statistical regularity will tend to collapse once pressure is placed upon it for control purposes”. Originally coined by the economist Charles Goodhart as a critique of the use of money supply measures to guide monetary policy, it has been adopted as a useful concept in many other fields. The general principle is that when any measure is used as a target for policy, it becomes unreliable. It is an observable phenomenon in healthcare, in financial regulation and, it seems, in energy efficiency standards.

When governments set efficiency regulations such as the US Corporate Average Fuel Economy standards for vehicles, they are often what is called “attribute-based”, meaning that the rules take other characteristics into consideration when determining compliance. The Cafe standards, for example, vary according to the “footprint” of the vehicle: the area enclosed by its wheels. In Japan, fuel economy standards are weight-based. Like all regulations, fuel economy standards create incentives to game the system, and where attributes are important, that can mean finding ways to exploit the variations in requirements. There have long been suspicions that the footprint-based Cafe standards would encourage manufacturers to make larger cars for the US market, but a paper this week from Koichiro Ito of the University of Chicago and James Sallee of the University of California Berkeley provided the strongest evidence yet that those fears are likely to be justified.

Mr Ito and Mr Sallee looked at Japan’s experience with weight-based fuel economy standards, which changed in 2009, and concluded that “the Japanese car market has experienced a notable increase in weight in response to attribute-based regulation”. In the US, the Cafe standards create a similar pressure, but expressed in terms of size rather than weight. Mr Ito suggested that in Ford’s decision to end almost all car production in North America to focus on SUVs and trucks, “policy plays a substantial role”. It is not just that manufacturers are focusing on larger models; specific models are also getting bigger. Ford’s move, Mr Ito wrote, should be seen as an “alarm bell” warning of the flaws in the Cafe system. He suggests an alternative framework with a uniform standard and tradeable credits, as a more effective and lower-cost option. With the Trump administration now reviewing fuel economy and emissions standards, and facing challenges from California and many other states, the vehicle manufacturers appear to be in a state of confusion. An elegant idea for preserving plans for improving fuel economy while reducing the cost of compliance could be very welcome.

The paper is The Economics of Attribute-Based Regulation: Theory and Evidence from Fuel-Economy Standards Koichiro Ito, James M. Sallee NBER Working Paper No. 20500.  The authors explain:

An attribute-based regulation is a regulation that aims to change one characteristic of a product related to the externality (the “targeted characteristic”), but which takes some other characteristic (the “secondary attribute”) into consideration when determining compliance. For example, Corporate Average Fuel Economy (CAFE) standards in the United States recently adopted attribute-basing. Figure 1 shows that the new policy mandates a fuel-economy target that is a downward-sloping function of vehicle “footprint”—the square area trapped by a rectangle drawn to connect the vehicle’s tires.  Under this schedule, firms that make larger vehicles are allowed to have lower fuel economy. This has the potential benefit of harmonizing marginal costs of regulatory compliance across firms, but it also creates a distortionary incentive for automakers to manipulate vehicle footprint.

Attribute-basing is used in a variety of important economic policies. Fuel-economy regulations are attribute-based in China, Europe, Japan and the United States, which are the world’s four largest car markets. Energy efficiency standards for appliances, which allow larger products to consume more energy, are attribute-based all over the world. Regulations such as the Clean Air Act, the Family Medical Leave Act, and the Affordable Care Act are attribute-based because they exempt some firms based on size. In all of these examples, attribute-basing is designed to provide a weaker regulation for products or firms that will find compliance more difficult.

Summary from Heritage Foundation study Fuel Economy Standards Are a Costly Mistake Excerpt with my bolds.

The CAFE standards are not only an extremely inefficient way to reduce carbon dioxide emission but will also have a variety of unintended consequences.

For example, the post-2010 standards apply lower mileage requirements to vehicles with larger footprints. Thus, Whitefoot and Skerlos argued that there is an incentive to increase the size of vehicles.

Data from the first few years under the new standard confirm that the average footprint, weight, and horsepower of cars and trucks have indeed all increased since 2008, even as carbon emissions fell, reflecting the distorted incentives.

Manufacturers have found work-arounds to thwart the intent of the regulations. For example, the standards raised the price of large cars, such as station wagons, relative to light trucks. As a result, automakers created a new type of light truck—the sport utility vehicle (SUV)—which was covered by the lower standard and had low gas mileage but met consumers’ needs. Other automakers have simply chosen to miss the thresholds and pay fines on a sliding scale.

Another well-known flaw in CAFE standards is the “rebound effect.” When consumers are forced to buy more fuel-efficient vehicles, the cost per mile falls (since their cars use less gas) and they drive more. This offsets part of the fuel economy gain and adds congestion and road repair costs. Similarly, the rising price of new vehicles causes consumers to delay upgrades, leaving older vehicles on the road longer.

In addition, the higher purchase price of cars under a stricter CAFE standard is likely to force millions of households out of the new-car market altogether. Many households face credit constraints when borrowing money to purchase a car. David Wagner, Paulina Nusinovich, and Esteban Plaza-Jennings used Bureau of Labor Statistics data and typical finance industry debt-service-to-income ratios and estimated that 3.1 million to 14.9 million households would not have enough credit to purchase a new car under the 2025 CAFE standards.[34] This impact would fall disproportionately on poorer households and force the use of older cars with higher maintenance costs and with fuel economy that is generally lower than that of new cars.

CAFE standards may also have redistributed corporate profits to foreign automakers and away from Ford, General Motors (GM), and Chrysler (the Big Three), because foreign-headquartered firms tend to specialize in vehicles that are favored under the new standards.[35] 

Conclusion

CAFE standards are costly, inefficient, and ineffective regulations. They severely limit consumers’ ability to make their own choices concerning safety, comfort, affordability, and efficiency. Originally based on the belief that consumers undervalued fuel economy, the standards have morphed into climate control mandates. Under any justification, regulation gives the desires of government regulators precedence over those of the Americans who actually pay for the cars. Since the regulators undervalue the well-being of American consumers, the policy outcomes are predictably harmful.


March Arctic Ice Plentiful

Previous posts showed 2020 Arctic Ice breaking the 15M km2 ceiling mid March before starting the Spring melt as usual later in the month. The graph above shows that the March monthly average has varied little since 2007, typically around the SII average of 14.7 Mkm2 +/-  a few %.  Of course there are regional differences as described below.

The graph above shows ice extent through March comparing 2020 MASIE reports with the 13-year average, other recent years and with SII.  After exceeding the average the first half, extents fell off the last 10 days, principally due to melting in the Pacfic basins of Bering and Okhotsk.

The table below shows the distribution of sea ice across the Arctic regions.

Region 2020091 Day 091 Average 2020-Ave. 2007091 2020-2007
 (0) Northern_Hemisphere 14282630 14713851 -431221 14158467 124163
 (1) Beaufort_Sea 1070655 1070176 479 1069711 944
 (2) Chukchi_Sea 963163 963149 14 966006 -2844
 (3) East_Siberian_Sea 1086324 1086066 258 1074213 12111
 (4) Laptev_Sea 897668 895482 2186 867162 30506
 (5) Kara_Sea 928986 916178 12808 908181 20805
 (6) Barents_Sea 688659 648978 39681 469156 219503
 (7) Greenland_Sea 709503 656533 52970 670061 39442
 (8) Baffin_Bay_Gulf_of_St._Lawrence 1320493 439783 -119290 1232093 88399
 (9) Canadian_Archipelago 854282 852731 1552 849011 5271
 (10) Hudson_Bay 1260152 1254854 5298 1229963 30189
 (11) Central_Arctic 3248013 3235482 12531 3245424 2589
 (12) Bering_Sea 484084 744587 -260503 721969 -237885
 (13) Baltic_Sea 8975 65202 -56227 45656 -36682
 (14) Sea_of_Okhotsk 753705 874501 -120796 797516 -43812

Overall NH extent March 31 was below average by 431k km2, or 3%.  The bulk of the deficit is seen in Bering and Okhotsk seas, along with Baffin Bay.  Everywhere else is slightly surplus, with the exception of the Baltic, which never froze completely this year.