 With coronavirus sucking all the air out of room globally, I got interested in looking at how the Canadian national flu seasons compare with the new Wuhan virus. The analysis is important since there are many nations at higher latitudes that are in equilibrium relative to infectious diseases, but vulnerable to outbreaks of new viruses. Where I live in Canada, we have winter outbreaks every year, but are protected by a combination of sanitary practices, health care system and annual vaccines, contributing to herd immunity.
For example, 2018-19 was slightly higher than a typical year, with this pattern:
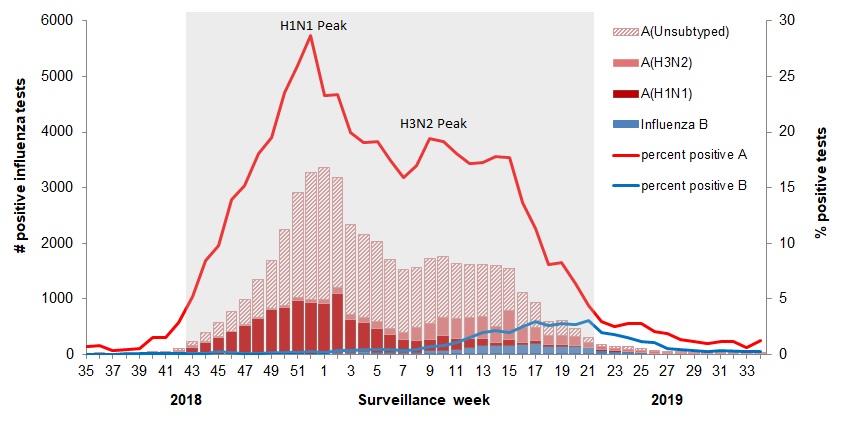 The various flu types are noted, all together making a total of 48,818 influenza detections during the 2018-19 season. A total of 946 hospitalizations were reported by CIRN-SOS sentinels that season (age = or >16). Source: Annual Influenza Reports
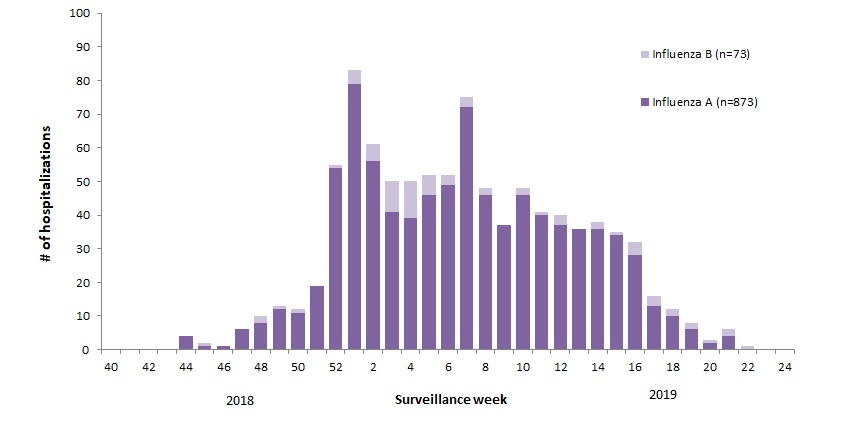
A total of 137 (14%) ICU admissions and 65 (7%) deaths were reported. The seasonality is obvious, as is the social resilience, when we have the antibodies in place.
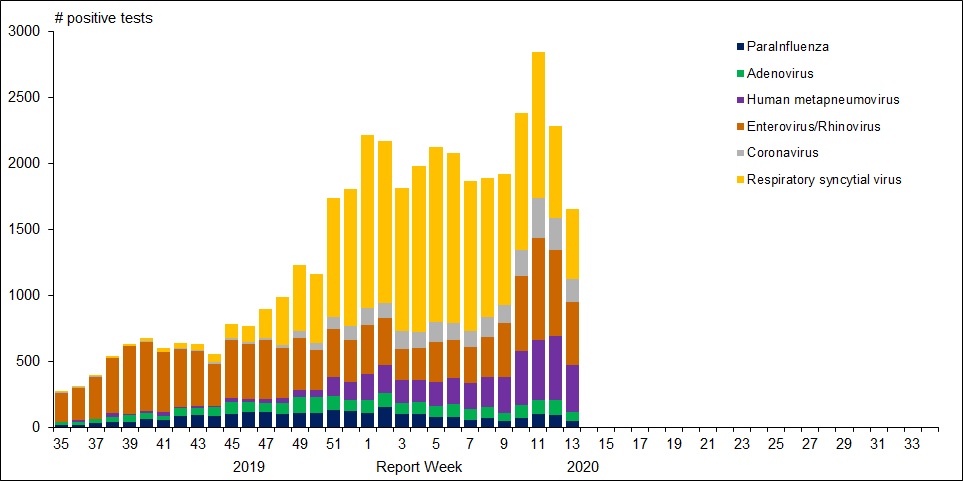
For further background, look at the latest Respiratory Virus Report for week 13 ending March 28, 2020. [In this Respiratory Virus Report, the number of detections of coronavirus reflects only seasonal human coronaviruses, not the novel pandemic coronavirus (SARS-CoV2) that causes COVID-19. More on Kung Flu later on.]
For the period shown in the graph, 320560 flu tests were done, resulting in 32751 type A positives and 22683 type B positives. That is a ratio of 17% of tests confirming conventional flu infection cases. Public Health Canada went on to say in reporting March 22 to 28, 2020 (week 13):
The percentage of tests positive for influenza fell below 5% this week. This suggests that Canada is nearing the end of the 2019-2020 influenza season at the national level. [Keep that 5% in mind]
Kung Flu in Canada is reported at Coronavirus disease (COVID-19): Outbreak update

From the underlying data we can see that this covid 19 outbreak started toward the end of the annual flu season. Here are the daily reported tests, cases, and deaths smoothed with 7 day averaging.

The cumulative graph shows how the proportions held during this period.
Out of a total 295,065 tests, 12537 (4.2%) cases were detected, and 187 died(1.5% of cases).

Summary: It’s true that cases and deaths are still rising, and everyone should practice sanitary behaviors and social distancing. But it appears that we are weathering this storm and have the resources to beat it. Let us hope for reasonable governance, Spring weather and a return to economic normalcy.

Reblogged this on HiFast News Feed.
LikeLike