 The image above shows melting of Arctic sea ice extent over the month of June 2020. As usual the process of declining ice extent follows a LIFO pattern: Last In First Out. That is, the marginal seas are the last to freeze and the first to melt. Thus at the top center and right of the image, the Pacific basins of Bering and Okohtsk seas lost what little ice they had. Meanwhile at extreme left, Hudson Bay ice retreats 300k km2 from north to south. Note center left Baffin Bay loses 320k km2 of ice during the month. The most dramatic melting is in the Russian shelf seas at the center right. Laptev and Kara Seas combined to lose 600k km2 of ice extent. The central mass of Arctic ice is intact with some fluctuations back and forth, and as well Greenland Sea and CAA (Canadian Arctic Archipelago) were slow to melt in June
The graph below shows the ice extent retreating during June compared to some other years and the 13 year average (2007 to 2019 inclusive).
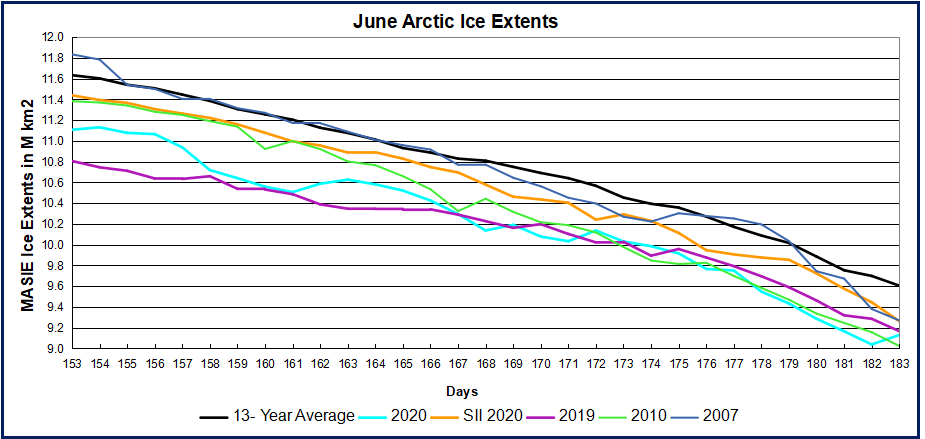 Note that the MASIE NH ice extent 13 year average loses about 2M km2 during June, down to 9.6M km2. MASIE 2019 started nearly 500k km2 lower and lost ice at a similar rate, ending 476 km2 below average. The most interesting thing was the wide divergence between SII and MASIE reports during June, SII starting the month about 500k km2 higher before narrowing at the end to exceed MASIE by 133k km2. I inquired whether NIC had experienced any measurement issues, but their response indicated nothing remarkable. It is unusual for MASIE to be the lower estimate of the two.

The table shows where the ice is distributed compared to average. Bering and Okhotsk are open water at this point and will be dropped from future monthly updates. The deficit of 476k km2 represents 5% of the total, or an ice extent melting 5 days ahead of average.
| Region | 2020183 | Day 183 Average | 2020-Ave. | 2007183 | 2020-2007 |
| (0) Northern_Hemisphere | 9128615 | 9604642 | -476028 | 9269301 | -140686 |
| (1) Beaufort_Sea | 982475 | 882878 | 99597 | 891858 | 90617 |
| (2) Chukchi_Sea | 730000 | 703162 | 26838 | 637536 | 92464 |
| (3) East_Siberian_Sea | 885090 | 1014587 | -129497 | 855267 | 29823 |
| (4) Laptev_Sea | 469839 | 704231 | -234392 | 646683 | -176844 |
| (5) Kara_Sea | 274007 | 535421 | -261414 | 596916 | -322909 |
| (6) Barents_Sea | 111016 | 106522 | 4494 | 97267 | 13749 |
| (7) Greenland_Sea | 474331 | 498794 | -24463 | 548566 | -74236 |
| (8) Baffin_Bay_Gulf_of_St._Lawrence | 438007 | 479675 | -41668 | 414283 | 23724 |
| (9) Canadian_Archipelago | 780765 | 774360 | 6405 | 759177 | 21589 |
| (10) Hudson_Bay | 739422 | 686381 | 53041 | 613940 | 125482 |
| (11) Central_Arctic | 3235174 | 3202495 | 32679 | 3202330 | 32844 |
| (12) Bering_Sea | 315 | 3673 | -3357 | 981 | -665 |
| (13) Baltic_Sea | 0 | 4 | -4 | 0 | 0 |
| (14) Sea_of_Okhotsk | 7051 | 11237 | -4185 | 2983 | 4068 |
Note that all of the deficit to average is accounted for by the Russian shelf seas of East Siberian, Laptev and Kara. Beaufort and Hudson Bay are slightly surplus.

Illustration by Eleanor Lutz shows Earth’s seasonal climate changes. If played in full screen, the four corners present views from top, bottom and sides. It is a visual representation of scientific datasets measuring Arctic ice extents.

Reblogged this on Climate Collections.
LikeLiked by 2 people