
With apologies to Paul Revere, this post is on the lookout for cooler weather with an eye on both the Land and the Sea. UAH has updated their tlt (temperatures in lower troposphere) dataset for August 2020. Previously I have done posts on their reading of ocean air temps as a prelude to updated records from HADSST3. This month also has a separate graph of land air temps because the comparisons and contrasts are interesting as we contemplate possible cooling in coming months and years.

Presently sea surface temperatures (SST) are the best available indicator of heat content gained or lost from earth’s climate system. Enthalpy is the thermodynamic term for total heat content in a system, and humidity differences in air parcels affect enthalpy. Measuring water temperature directly avoids distorted impressions from air measurements. In addition, ocean covers 71% of the planet surface and thus dominates surface temperature estimates. Eventually we will likely have reliable means of recording water temperatures at depth.
Recently, Dr. Ole Humlum reported from his research that air temperatures lag 2-3 months behind changes in SST. He also observed that changes in CO2 atmospheric concentrations lag behind SST by 11-12 months. This latter point is addressed in a previous post Who to Blame for Rising CO2?
HadSST3 results were delayed with February and March updates only appearing together end of April. For comparison we can look at lower troposphere temperatures (TLT) from UAHv6 which are now posted for August. The temperature record is derived from microwave sounding units (MSU) on board satellites like the one pictured above.
The UAH dataset includes temperature results for air above the oceans, and thus should be most comparable to the SSTs. There is the additional feature that ocean air temps avoid Urban Heat Islands (UHI). In 2015 there was a change in UAH processing of satellite drift corrections, including dropping one platform which can no longer be corrected. The graphs below are taken from the latest and current dataset, Version 6.0.
 The graph above shows monthly anomalies for ocean temps since January 2015. After all regions peaked with the El Nino in early 2016, the ocean air temps dropped back down with all regions showing the same low anomaly August 2018. Then a warming phase ensued with NH and Tropics spikes in February and May 2020. As was the case in 2015-16, the warming was driven by the Tropics and NH, with SH lagging behind. Since the peak in January 2020, all ocean regions have trended downward in a sawtooth pattern, returning to a neutral anomaly in June, close to the 0.4C average for the period. July and August are little changed with NH and SH offsetting slight bumps.
Land Air Temperatures Showing Volatility
We sometimes overlook that in climate temperature records, while the oceans are measured directly with SSTs, land temps are measured only indirectly. The land temperature records at surface stations sample air temps at 2 meters above ground. UAH gives tlt anomalies for air over land separately from ocean air temps. The graph updated for August 2020 is below.

Here we see the noisy evidence of the greater volatility of the Land temperatures, along with extraordinary departures, first by NH land with SH often offsetting. The overall pattern is similar to the ocean air temps, but obviously driven by NH with its greater amount of land surface. The Tropics synchronized with NH for the 2016 event, but otherwise follow a contrary rhythm. SH seems to vary wildly, especially in recent months. Note the extremely high anomaly last November, cold in March 2020, and then again a spike in April. In June 2020, all land regions converged, erasing the earlier spikes in NH and SH, and showing anomalies comparable to the 0.5C average land anomaly this period.
After an upward bump In July SH, land air temps in August returned to the same flat result from the prior month.
The longer term picture from UAH is a return to the mean for the period starting with 1995. 2019 average rose and caused 2020 to start warmly, but currently lacks any El Nino or NH warm blob to sustain it.
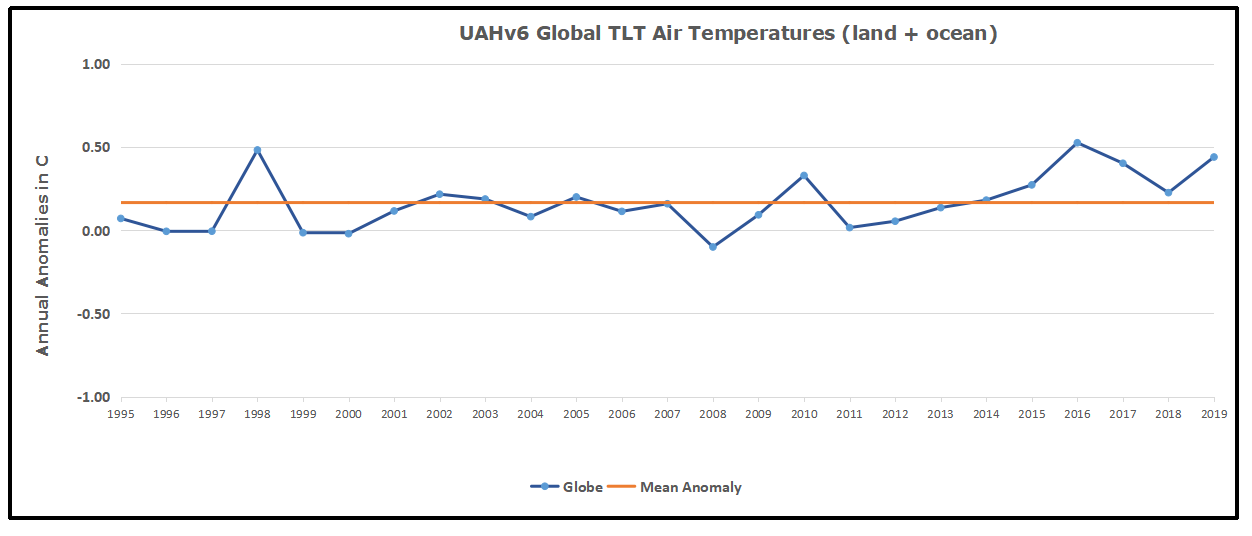
These charts demonstrate that underneath the averages, warming and cooling is diverse and constantly changing, contrary to the notion of a global climate that can be fixed at some favorable temperature.
TLTs include mixing above the oceans and probably some influence from nearby more volatile land temps. Clearly NH and Global land temps have been dropping in a seesaw pattern, NH in July more than 1C lower than the 2016 peak. TLT measures started the recent cooling later than SSTs from HadSST3, but are now showing the same pattern. It seems obvious that despite the three El Ninos, their warming has not persisted, and without them it would probably have cooled since 1995. Of course, the future has not yet been written.

Another excellent post, Ron.
Could you please give the basis used for the anomalies that you use.
LikeLike
Thanks Jack. UAH uses the period 1981-2010
as baseline for calculating anomalies.
LikeLike
Reblogged this on Climate Collections.
LikeLike
To me the most remarkable thing about the climate is the stability of sea surface temperatures (SST) which appear to be running at around a 0.05C/ decade upward trend. In my view an insignificant trend against the background of measurement, statistical analysis and natural radiation and volcanic variables.
I put this down to the fact that at the evaporative phase change of water the Planck sensitivity coefficient is zero as it occurs at constant temperature. Other factors ensure that the Latent Heat generated is dissipated up thorough the clouds and beyond and does not serve to increase the SST.
Hence the reason why the oceans never get much above 35C in spite of tens of thousands of years of solar radiation. The 35C figure stems from the water vapour pressure V temperature graph which shows a marked increase in pressure at around 25C which results in an equivalent increase in the rate of evaporation in response to incoming radiation.
I am puzzled why this aspect never appears to get mentioned in the scientific literature or get incorporated into the Models.
LikeLike
Thanks cognog for making that point. It prompted me to seek understanding, and as you say, no one talks about it in relation to the climate issue. There is information in Chemistry textbooks, where this diagram is presented.

The curve for water shows the exponential increase starting around 25C. The text says this:
“Because the molecules of a liquid are in constant motion, we can plot the fraction of molecules with a given kinetic energy (KE) against their kinetic energy to obtain the kinetic energy distribution of the molecules in the liquid, just as we did for a gas. As for gases, increasing the temperature increases both the average kinetic energy of the particles in a liquid and the range of kinetic energy of the individual molecules. If we assume that a minimum amount of energy is needed to overcome the intermolecular attractive forces that hold a liquid together, then some fraction of molecules in the liquid always has a kinetic energy greater than that. The fraction of molecules with a kinetic energy greater than this minimum value increases with increasing temperature. Any molecule with a kinetic energy greater than needed has enough energy to overcome the forces holding it in the liquid and escape into the vapor phase. Before it can do so, however, a molecule must also be at the surface of the liquid, where it is physically possible for it to leave the liquid surface; that is, only molecules at the surface can undergo evaporation (or vaporization), where molecules gain sufficient energy to enter a gaseous state above a liquid’s surface, thereby creating a vapor pressure.”
“As soon as some vapor has formed, a fraction of the molecules in the vapor phase will collide with the surface of the liquid and reenter the liquid phase in a process known as condensation. As the number of molecules in the vapor phase increases, the number of collisions between vapor-phase molecules and the surface will also increase. Eventually, a steady state will be reached in which exactly as many molecules per unit time leave the surface of the liquid (vaporize) as collide with it (condense). At this point, the pressure over the liquid stops increasing and remains constant at a particular value that is characteristic of the liquid at a given temperature.” Source: LibreText Chemistry Vaporization and Vapor Pressure
A Geology textbook adds this:
“Solar radiation is responsible for warming up the Earth, and we rely on the Earth to hold on to this heat that comes in and regulate the flow. The amount of heat required to increase the temperature of a substance by 1 degree Celcius is quantified as heat capacity, and this value determines how well a substance retains the heat.”
“When you heat up a pot of water on the stove, which one heats up first: the pot or the water? The pot heats up faster! Although you are putting the same amount of heat on both substances, the pot responds quicker than the water because water has a high heat capacity. Heat capacity is a measure of the heat required to raise the temperature of 1g of a substance by 1 Celsius. In this example, water has a very high heat capacity, which means it requires a lot of heat or energy to change temperature compared to many other substances like the pot.”
“Additionally to temperature, it takes a tremendous amount of energy to change the water molecules from one state to another. In Earth, we have all three states of water – solid, liquid, and gas – and there’s actually resistance from going back and forth from one state to another because of water’s heat capacity. This relates to our ocean since the presence of the ocean moderates our daily lives and weather quite a bit in California through the amount of water molecules in the air.”
“Water has an especially high heat capacity at 4.18 J/g*C, which means it takes more heat to warm a gram of water. This is why, throughout the course of a warm summer day, the water in the ocean does not experience a significant change. Land, on the other hand, has a much lower heat capacity, which is usually less than 1 J/g*C.”
As to your point about a ceiling on ocean SSTs, it appears that the highest SSTs are recorded in the Indian Ocean, where they go up to 90 F or 32 C.
LikeLike
Many thanks Ron. Appreciated. Yes it very much goes along with my concepts on evaporation. I have a specific graph for water from 0 to 40C which accentuates this; but don’t seem able to copy it here.
I am surprised that the maximum temperature is found to be about 32C as I thought there were some locations where higher temperatures could be found, such as the Red sea.
Additionally from the Engineering Toolbox site the rate of evaporation is given by the empirical formula
g = C*A*(V – v) where C is a coefficient relating to wind velocity, A is the area, V is the the liquid vapour pressure and v the atmospheric Partial pressure. Boiling occurs when V > the atmospheric pressure when the Partial Pressure equates to it.
Throughout therefore, the rate of evaporation closely follows the rate of energy input in still wind conditions, with the Latent Heat generated more or less balancing the radiation input.
Hence the reason why it is a waste of time trying to boil a pan of water with a blowtorch on the surface.
Similarly with solar radiation trying to heat up the oceans.
Sadly I find that raising these matters for discussion with those locked in the consensus is always met with a total inability or willingness to discuss the matter, often leading to ad hominem remarks etc.
Hence my appreciation of your response as I am keen to find out any flaws I have in my logic etc.
My regards
Alasdair
(alasdairfairbairn220@gmail.com)
LikeLike
Thanks for the further thoughts. My temperature reference was to ocean SSTs. Indeed, the Red Sea goes hotter, but is a special situation given its salinity.
My additional comment is that the increased evaporation triggers negative feedbacks in the hydrology cycle. Additional water vapor causes clouds which block solar energy like a sunscreen. Also precipitation (and storms) ensue, since 87% of evaporation comes from the oceans. And much of it falls back upon the sea surface, providing cooling especially to the equatorial oceans.
Another feedback is acceleration of oceanic convection, since increasing SSTs cause upwelling of cooler water from lower layers to absorb the available heat. And of course, overnight the day’s heat dissipates as currents move warmer water from lower to higher latitudes.
All of these natural cooling feedbacks prevent higher SSTs.
LikeLike
Yes there are indeed other factors involved apart from the specific aspects I am raising. Trade winds being particularly significant in their influence on evaporation rate. I suggest It is even more complex than you suggest as I am concentrating merely on the sea level situation. Obviously the same principles apply going up through the atmosphere but with marked changes in the variables involved particularly in the the clouds and even within the clouds.
Overall, however the steam tables tell us that for every kilogram of water evaporated at the the surface some 694 Watthrs of energy (the latent heat) gets dissipated up through the clouds and beyond before returning to earth. How much of that gets dissipated to space is another matter; but at least we know that the fact that the ice crystals in those cirrus clouds nudging the tropopause are growing, means that they must be losing energy to space. All this quite apart from CO2 levels etc.
It is not surprising that the IPCC et al avoids getting involved in these complexities; but IMO this is no justification for the simplistic conclusion that water provides a positive feedback to the GHE
LikeLike