
Just like the Arizona road in the image, Arctic ice extent has dipped in September and is on the rise again. The graph below shows how September monthly extent averages compare for the years since 2007.
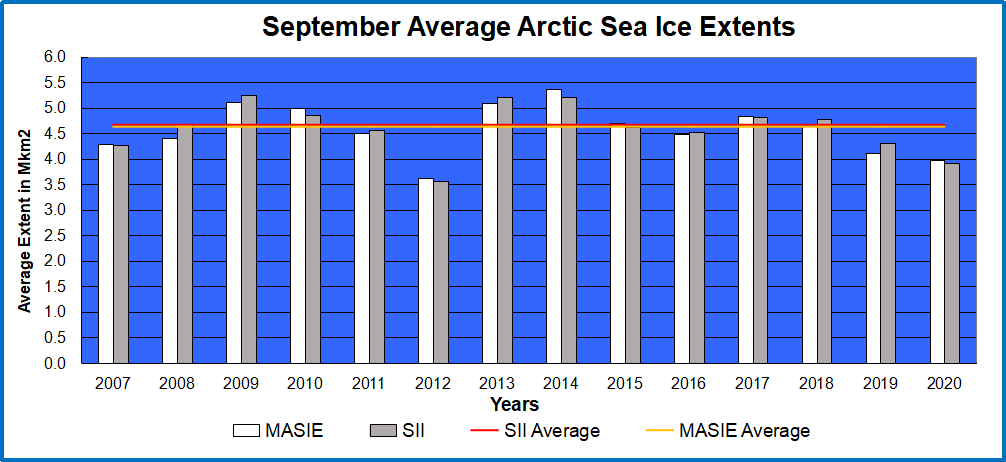
Overall it resembles the Arizona roadway. Two low years are followed by two high years, then two low years and so on. The last two years are low, comparable to 2007, and may portend higher ice extent ahead. As usual MASIE and SII are showing for 2020 nearly the same monthly averages, 4.0M km2 for MASIE and 3.9M km2 for SII. The graph below shows how the ice dipped and recovered in 2020 compared to the 13-year average and some notable years.

September 2020 daily minimum was lower than all previous years except for 2012. As noted previously this year’s anomaly was the hot Siberian summer melting out the Eurasian shelf seas and the bordering parts of the Central Arctic Sea. In 2012 it was the Great Arctic Cyclone in August of that year. After day 255, ice recovered strongly in 2020 ending the month higher than 2007, close to 2019 and about 150k km2 less than the average daily minimum on day 260, 4.4M km2

The table shows monthly extent averages for the regions with ice in September for several years and the 13-year average for each region.
| Sept. Monthly Averages | 2007 | 2012 | 2019 | 2020 | Average | SD % |
| (0) Northern_Hemisphere | 4286957 | 3622648 | 4124035 | 3969085 | 4630779 | 10% |
| (1) Beaufort_Sea | 558424 | 212051 | 382779 | 620409 | 487498 | 31% |
| (2) Chukchi_Sea | 49690 | 52539 | 111412 | 77598 | 172143 | 53% |
| (3) East_Siberian_Sea | 1251 | 53411 | 73023 | 121408 | 287777 | 63% |
| (4) Laptev_Sea | 246278 | 44336 | 87121 | 28 | 141604 | 81% |
| (5) Kara_Sea | 49502 | 717 | 166 | 13063 | 24612 | 102% |
| (6) Barents_Sea | 6782 | 0 | 13238 | 0 | 18757 | 183% |
| (7) Greenland_Sea | 334147 | 263899 | 173116 | 235216 | 197263 | 33% |
| (8) Baffin_Bay_Gulf_of_St._Lawrence | 33043 | 15591 | 16589 | 20361 | 32926 | 50% |
| (9) Canadian_Archipelago | 252140 | 198502 | 265335 | 339996 | 299817 | 30% |
| (10) Hudson_Bay | 10998 | 9502 | 0 | 2783 | 7947 | 135% |
| (11) Central_Arctic | 2743433 | 2771014 | 3000459 | 2537271 | 2959458 | 6% |
The last column shows the Standard Deviation % for each region and for NH as a whole. Over this period the NH fluctuations have been +/- 10%. The most variable is Barents Sea, which can be zero or over 100k km2. Hudson Bay and Kara likewise either melt out or retain significant ice. The Central Arctic varies little from year to year.

Illustration by Eleanor Lutz shows Earth’s seasonal climate changes. If played in full screen, the four corners present views from top, bottom and sides. It is a visual representation of scientific datasets measuring Arctic ice extents.

Reblogged this on Climate Collections.
LikeLiked by 1 person