An important statement from Martin Kulldorff, co-author of the Great Barrington Declaration referenced in previous post reprinted below. Reported in Newsweek, (here)
In an email sent to Newsweek, one of the petitions co-authors, Dr. Martin Kulldorff wrote, “We are very pleased with the reception that the Great Barrington Declaration has received, with over 75,000 co-signers in less than two days, including over 3,000 Medical and Public Health Scientists and over 4,000 Medical Practitioners.”
“We are not advocating a ‘herd immunity strategy.’ Herd immunity is not a strategy, but a scientifically proven phenomena, just like gravity.
And you would not say that an airplane pilot is using a ‘gravity strategy’ to land a plane. No matter what strategy is used, we will reach herd immunity sooner or later, just as an airplane will reach the ground one way or another,” Kulldorff’s email said. “The key is to minimize the number of deaths until we reach herd immunity and that is what the Great Barrington Declaration is about.”
H/T to Reference Frame for a clarifying post on herd immunity drawing on experience in Prague and Czech Republic. Lubos Motl writes: Excerpts in italics with my bolds.
At this moment, Czechia is by far the most Covid-active country in the world, a fact that is caused by Czechs’ not being afraid of this disease now, despite the efforts of the prime minister, minister of health, and a few others who would like to reignite the fear. We still had concerts, ice-hockey matches with thousands of fans etc. last night, the life is continuing normally. Culture, sports, and fun will be banned for two weeks from next Monday; after the totally free July and August, we basically added another month of almost complete freedom in which it was already clear that the disease was quickly growing.
If you want to know, the deaths are a bit above 900 now, growing ~30 a day. Hospitalizations are at ~1900, growing ~150 per day. Serious cases are above ~400, growing by 10-50 a day. 800 mild hospitalized patients will be moved to hotels, a smart move, especially because hotels are surely under-utilized now. While only ~400 ICU-like beds are used by Covid patients now, we have some ~800 available – the system is ready for another tripling of the serious Covid cases. Claims about the cracking Czech healthcare system are exaggerated (a euphemism for “complete lies”).
The death-to-cases ratios is much lower than it was in spring, pretty much proving that the disease is comparable to flu in average.
Maybe a less severe variant of the virus has spread; maybe people are getting lower doses now; and maybe it’s because of the treatment. In Czechia, doctors use all kinds of treatments, obviously oxygen, mechanical ventillation, and favipiravir, convalescent plasma, isoprinosine, corticosteroids, and… especially remdesivir.
Czechia will go through another month of this elevated Covid activity. Many of us will be afraid, some of us will have to be saddened. A vaccine may arrive and the minister of health has declared his intention to strip you of the face mask duties if you are vaccinated (it should apply to all other restrictions; and to the immune Covid alumni, too). This is a sensible incentive to get vaccinated. But the current fatality rate due to Covid is so much smaller than in spring (also due to remdesivir) that we should simply go through this unpleasant experience at full speed.
The Czech doctors’ petition against the hysteria and restrictions has over 64,000 signatures now. I am disappointed (and surprised) that our government doesn’t just accept this fact – that the penetration comparable to herd immunity is unavoidable – and doesn’t try to make everyone sure that it can really manage it.
On Oct. 4, 2020, three preeminent experts — Dr. Martin Kulldorff, professor of medicine at Harvard University; Dr. Sunetra Gupta, an epidemiologist at Oxford University; and Dr. Jay Bhattacharya, a physician and epidemiologist at Stanford University — delivered the following declaration, calling for a different approach to dealing with the novel coronavirus than the lockdown model:
As infectious-disease epidemiologists and public-health scientists, we have grave concerns about the damaging physical and mental-health impacts of the prevailing COVID-19 policies and recommend an approach we call Focused Protection.
Coming from both the left and right, and around the world, we have devoted our careers to protecting people. Current lockdown policies are producing devastating effects on short- and long-term public health.
The results (to name a few) include lower childhood-vaccination rates, worsening cardiovascular-disease outcomes, fewer cancer screenings and deteriorating mental health — leading to greater excess mortality in years to come, with the working class and younger members of society carrying the heaviest burden. Keeping students out of school is a grave injustice.
Keeping these measures in place until a vaccine is available will cause irreparable damage, with the underprivileged disproportionately harmed.
Fortunately, our understanding of the virus is growing. We know that vulnerability to death from COVID-19 is more than a thousand-fold higher in the old and infirm than the young. Indeed, for children, COVID-19 is less dangerous than many other harms, including influenza.
As immunity builds in the population, the risk of infection to all — including the vulnerable — falls. We know that all populations will eventually reach herd immunity — that is, the point at which the rate of new infections is stable — and that this can be assisted by (but is not dependent upon) a vaccine. Our goal should, therefore, be to minimize mortality and social harm until we reach herd immunity.
The most compassionate approach that balances the risks and benefits of reaching herd immunity is to allow those who are at minimal risk of death to live their lives normally to build up immunity to the virus through natural infection, while better protecting those who are at highest risk. This is Focused Protection.
Adopting measures to protect the vulnerable should be the central aim of public-health responses to COVID-19. By way of example, nursing homes should use staff with acquired immunity and perform frequent polymerase-chain-reaction testing of other staff and all visitors. Staff rotation should be minimized.
Retired people living at home should have groceries and other essentials delivered to their homes. When possible, they should meet family members outside, rather than inside. A comprehensive and detailed list of measures, including approaches to multigenerational households, can be implemented and is well within the scope and capability of public-health professionals.
Those who are not vulnerable should immediately be allowed to resume life as normal. Simple hygiene measures, such as handwashing and staying home when sick, should be practiced by everyone to reduce the herd immunity threshold.
Schools and universities should be open for in-person teaching. Extracurricular activities, such as sports, should be resumed. Young, low-risk adults should work normally, rather than from home. Restaurants and other businesses should open. Arts, music, sport and other cultural activities should resume. People who are more at risk may participate if they wish, while society as a whole enjoys the protection conferred upon the vulnerable by those who have built up herd immunity.
Since the declaration was published, more than 2,000 public-health scientists and more than 2,000 medical practitioners have signed it, as have nearly 40,000 members of the general public. You can add your signature to the declaration online at https://gbdeclaration.org.
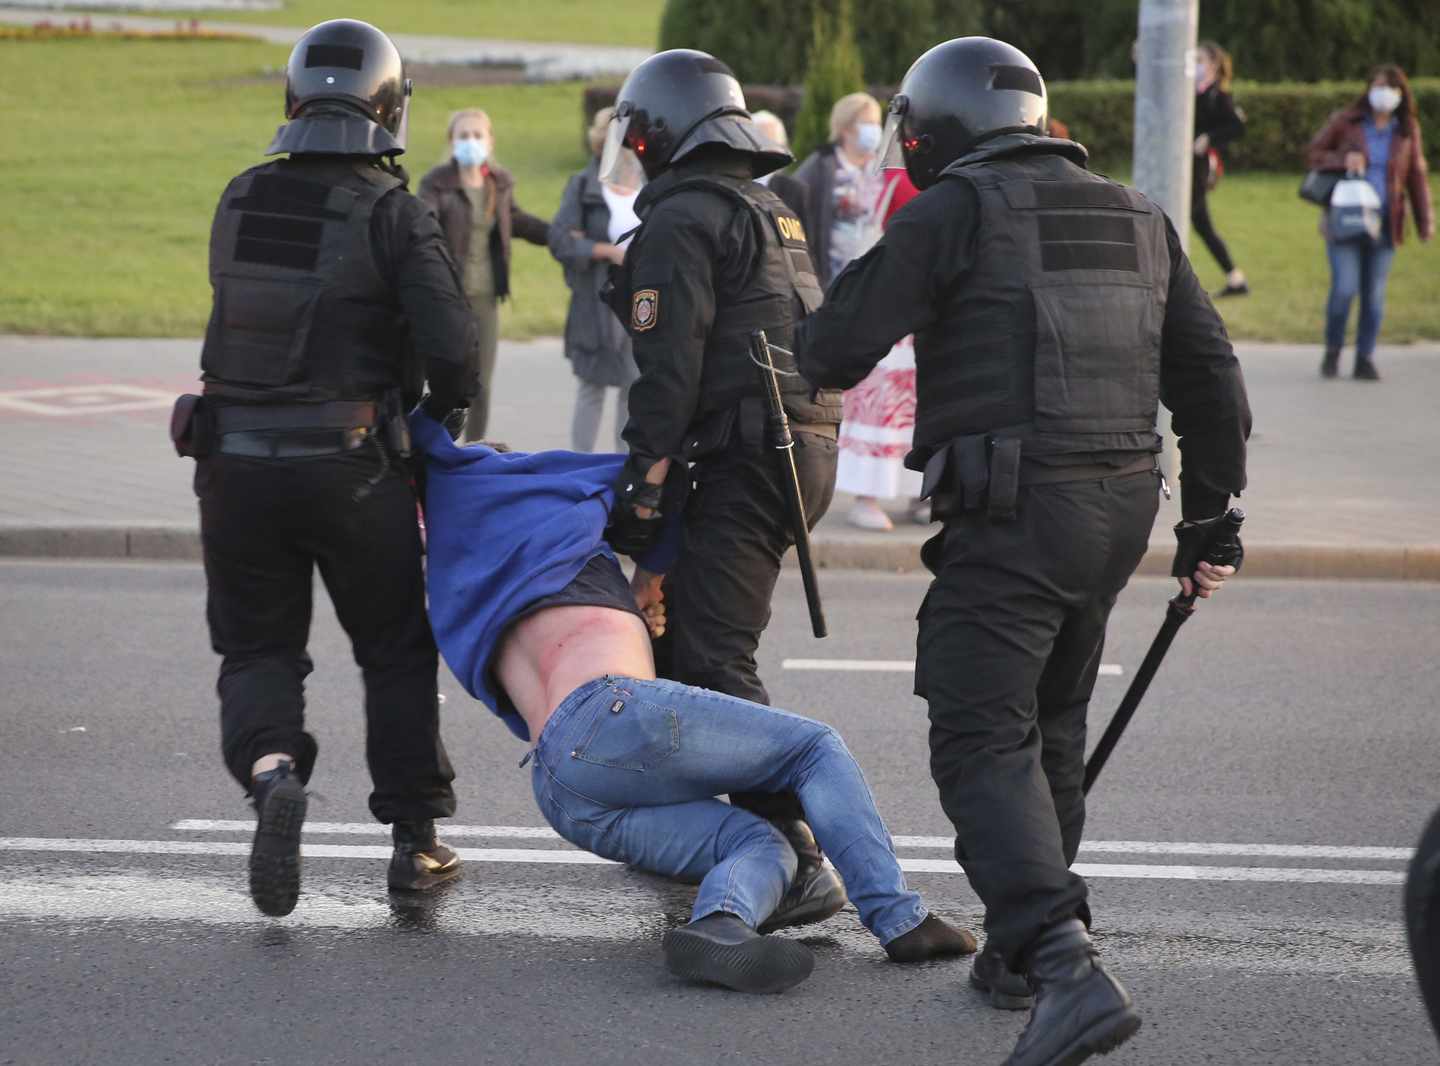
In recent months, some demonstrators in Quebec have denounced what they consider government fear campaigns over COVID-19. The new measures included a mandatory rule on wearing masks during demonstrations. (Graham Hughes/The Canadian Press)
“We have to make sacrifices in order to, as I said yesterday, to save our health network,” he said.
The province’s caseload has reached 82,992 while the death toll attributed to the virus has reached 5,915. [Labels people as “cases” when they have no symptoms and are not infectious. Ignores recoveries, and hides the currently small rate of deaths after testing positive for the virus. ]
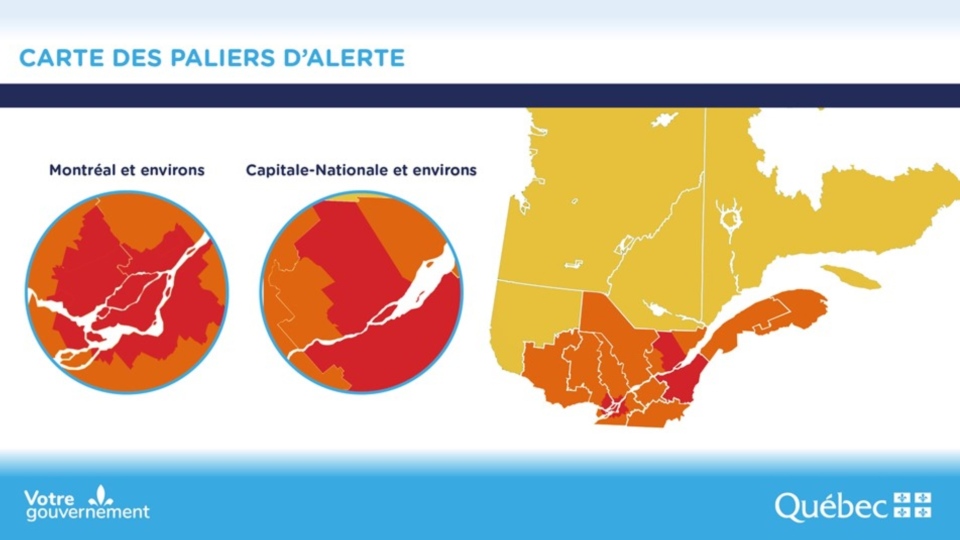
Health Minister Christian Dubé announced five more Regional Municipal Counties, including Bécancour, Nicolet-Yamaska, Drummond, Trois-Rivières, and Portneuf, are being added to the province’s coronavirus red zones.
Dubé said with the addition of the new regions, most of the St-Lawrence Valley between Quebec City and Montreal has gone red, with a few exceptions.
The recent uptick in cases and growing spread of the virus has also led to more hospitalizations in the last week. The resurgence has also prompted officials to ask Quebecers to stay home to ease pressure on the health-care network.
As of Thursday, Legault said the number of patients jumped by 16 for a total of 425. Of those patients, 68 are in intensive care — an increase of six. [No context was provided for those numbers. For that see discussion from previous post below.]
Note: As we shall see later on, Quebec covid numbers mislead because officials only do addition; subtraction is not allowed lest fears be undermined. The media obsesses over cumulative statistics generated months ago, hiding the present facts on the ground.
The coronavirus pandemic began as a global health crisis. It spawned an economic crisis. Now COVID-19 is also fueling a crisis for democracy and human rights.
Leaders around the world are using the virus as cover to reduce transparency, increase surveillance, arrest dissidents, repress marginalized populations, embezzle public resources, restrict media, and undermine fair elections.
Quebec premier clarified the province’s new COVID-19 measures in red zones
Quebec Premier François Legault says police in the province’s red zones — regions where COVID-19 cases are surging — will be issuing $1,000 fines to those who violate newly strengthened public health rules.
With fees, those fines will top $1,500 and can be issued for gathering in private residences or protesting without a face covering.
Speaking during a late-afternoon news conference on Wednesday just hours before the new rules went into effect, Legault said the negligence of a few has led to the crackdown.
“Lives are at stake. We want to keep our children in schools,” Legault said. “We also want to protect our health network”
Quebec reported 838 new cases of COVID-19 but no new deaths Wednesday. Since the start of the pandemic, there have been 74,288 confirmed cases and 5,834 people have died in the province.
Home gatherings can lead to fines
Beyond the few exceptions, such as for caregivers or romantic relations, house guests are not allowed, Legault said.
Police are authorized to demand proof of residency and if residents refuse entry, officers will be able to obtain warrants faster through a new, virtual system that was established in collaboration with the Crown, the premier said.
“We had to give the police the means to intervene,” said Public Security Minister Geneviève Guilbault.
Protestors to be fined for refusing to wear masks
Quebec made masks mandatory inside public spaces, like bars and shops, on July 18, but there have been several protests since.
Now, anti-maskers will have to cover up if they want to march or police will be issuing fines.
All gatherings prohibited, travel discouraged
Legault said all gatherings will be banned, even outside in public parks — an activity that has grown more popular in places like Montreal during the pandemic.
“Police officers will start by trying to disperse the gatherings, but if people don’t co-operate, fines can be given,” he said.
Legault said people from red zones cannot travel to orange zones to eat in a restaurant or gather in a home. They will face fines if they do.
He said restaurants will not be required to verify residency, but police can issue a ticket if they catch people violating the rules.
People should not travel between regions to pick up groceries or run similar errands, Legault said. People can go to their cottage, for example, as long as they bring their provisions with them.
The new restrictions take effect 12:01 a.m. ET on Thursday and are set to last for 28 days, until Oct. 28, in the red zones. The restrictions are:
A ban on home gatherings, with some exceptions, such as a single caregiver, babysitter, tradesperson or technician, allowed per visit.
All bars and casinos are closed. Restaurants can offer only takeout.
Museums, cinemas and theatres are closed.
Being less than two metres apart will be prohibited. Masks will be mandatory during demonstrations.
Houses of worship and venues for events, such as funerals and weddings, will have a 25-person limit.
Hair salons, hotels and other such businesses will stay open.
Schools will remain open.
What is the Emergency Requiring Virtual Quarantine of Healthy People?
Each Friday the Quebec health research institute (INESSS) provides a statistical update of the Covid19 situation with projections regarding the key concern: Capacity of the system to care for actual Covid cases requiring in-hospital treatment. Here is the latest information.
On the left is the history of Covid hospitalizations in Quebec to end of September. Note that presently there about 20 people per day are admitted to hospital with Covid19. As of Oct. 1, Quebec reported 276 people in hospital (including 46 in ICU) out of covid bed capacity of 1750. If the 20/day new admissions rate since July 1 continued, and assuming an average length of stay of 12 days, the net of covid beds occupied should not increase and more likely would go down. So the projections on the right side have a wide range, but even with an upward bias, the capacity is not reached. And as the lower right shows, ICU capacity is even less likely to be overwhelmed.
In Quebec, the hospitalization rate for COVID-19 patients has dropped sharply since the beginning of the pandemic. During the first wave, about 13 per cent of cases ended up in hospital. From Aug. 10 to Sept. 6, the rate was just 5 per cent. At a technical briefing on Wednesday, researchers and officials from Quebec’s institute of excellence in health and social services (INESSS) projected that the rate for COVID-19 patients in early September would fall again to 3.8 per cent.
The drop can be explained by the relative youth of Quebeckers contracting the virus in its second wave and their relative lack of comorbidities. By contrast, in the spring, the virus tore through long-term care homes in the province, killing 4,914 elderly residents.
As a result of this shift, Quebec will not exceed its hospital capacity of about 2,000 beds in the next four weeks, according to the INESSS projections. But officials warned that a faster spread of the virus caused by careless behaviour could still put pressure on the health care system.
Above is the outlook for October from INESSS. For both ICU and covid hospital beds observations are tracking a forecast showing slight increases. It appears that the precautionary principle is being applied without regard for the costs of locking down: social, economic and personal well-being seem not to be part of the equation.
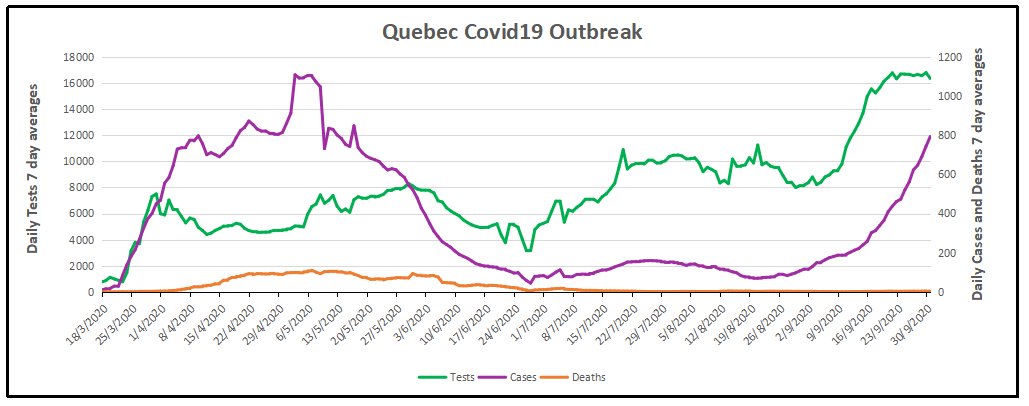
Quebec Situation Update October 1, 2020
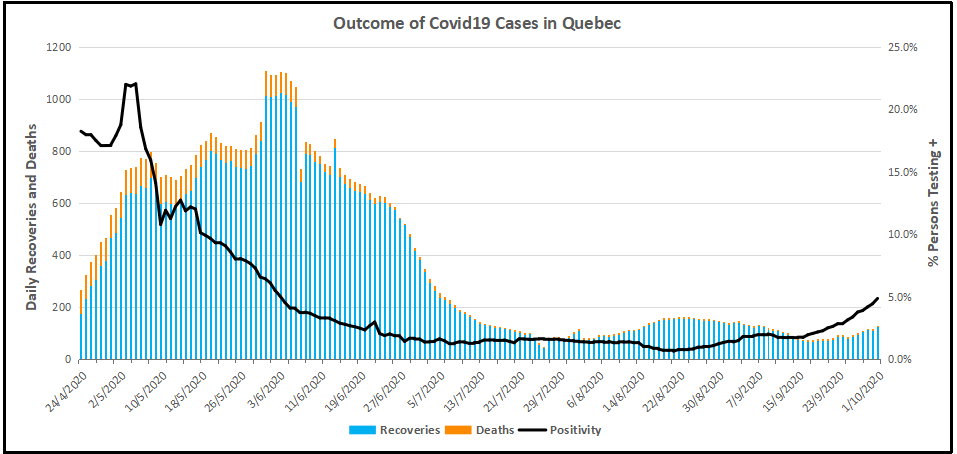
Note that testing has quadrupled since July and the number of new cases followed, especially in the last month. Meanwhile daily deaths are unchanged at less than five a day, compared to Quebec losing 186 lives every day from all causes.. Recoveries are not reported to the public, perhaps due to the large number of people testing positive but without symptoms or only mild illness and no professional treatment. The graph below estimates recoveries assuming that people not dying 28 days after a positive test can be counted as cured or in recovery.
Recoveries are the number of people testing positive (misleadingly termed “cases”) minus deaths 28 days later. Obviously, the death rate was high early on, and now is barely visible. Meanwhile the Positivity rate (% of people testing positive out of all subjects) went down to 1% for several months before rising recently. Since there is a lag of 28 days, we don’t yet see the outcome of the rise in positives along with the increased testing.
Summary
Premier Legault and his medical advisors had done well up to now. The first goal was to prevent deaths, and that has been achieved. 186 Quebecers die every day from all causes, and now about 5 are dying having tested positive for SARS CV2. The other goal was to prevent overwhelming the health care system with Covid cases. This too is under control. On October 1, there were 276 patients hospitalized with covid, including 46 in ICUs. The capacity is 1750 beds and 370 ICU beds. Since July there have been about 20 new admissions daily, offset by recoveries released from hospital.
Unfortunately, now the authorities have spooked themselves and applied a lockdown at the wrong time. Their goal has shifted to stopping new positives, which have increased because testing has quadrupled and positivity rates gone up from 1% to 5%. These are younger people who are not getting sick and certainly not dying from the virus. As many epidemiologists have said, you won’t get rid of this virus, you live with it by getting herd immunity, which leaves too few susceptible people for the virus to spread. If you kill off all the PME businesses and put people out of work, poverty and social decay will kill people, not to mention the interruption of medical treatments which save those with the real deadly diseases: cancers, heart, arteries, lungs, and so on.
This post comes from a Florida newspaper who dig into facts rather than amplify fears. Fortunately Florida has leadership who have taken a balanced and reasoned approach to the contagion, but there are many in that state and around the world who are freaked out and want others to also be alarmed. An article by Len Cabrera at the Alachua Chronicle (near Gainesville) provides insight into the twisting of data by fear mongers: Increasing percentage of Florida’s COVID data is questionable. Excerpts in italics with my bolds.
When government-provided data is used to support increasing government power, we should all question its validity. Because we know that all lab tests have false positives and that PCR tests pick up fragments of the virus that may or may not indicate infection, COVID deaths should be certified by physicians, not matched to names in the list of people who previously had a positive test.
48% of the entries in the Florida Department of Health (FDOH) COVID-19 case line data have “UNKNOWN” or blanks in the fields for emergency department visit or hospitalization, indicating that FDOH has not been able to collect information about them. Thus, we don’t know whether they ever had symptoms, much less whether they were hospitalized and/or died because of COVID. The percentage of FDOH-reported COVID deaths that have “UNKNOWN” or blank entries is increasing, suggesting that these recently-reported deaths (many from months ago) may not be valid COVID-19 deaths.
Cases started inexplicably rising in Florida in early June despite mask mandates, business closures, and capacity limits across the state (driven by county commissions and/or mayors, not state-wide policy). When scientists, reporters, or private citizens questioned the validity of the data, they were told to shut up and trust the judgment of government “experts” that these are valid cases, not just positive tests.
Documented studies (summarized here) show that PCR tests are too sensitive to properly identify cases when they use a cycle threshold over 34, and almost all labs in the United States use at least 37, if not 40. The New York Times reported that these tests can produce 40% to 90% false positive results. (If you don’t have a subscription you can read the summary from Apoorva Mandavilli’s Twitter account.)
The push for more and more testing, especially of asymptomatic people returning to work or school, has driven this artificial casedemic. Don’t read something I’m not saying. This does not mean COVID doesn’t exist or isn’t real but that a good portion of the FDOH “cases” are just people with positive tests, not people actively infected (and infectious) with COVID.
To try to get a handle on these suspicious cases, I looked at the case line data to determine the number of “cases” that have “UNKNOWN” or blank entries for both emergency department visit or hospitalization. Contact tracers attempt to get this data when they interview individuals with positive tests, and they enter “NO” if the person has not visited an emergency room or been hospitalized. (This can be changed later if those events occur.) Sometimes the individual is not cooperative, so there can be cases in which a contact tracer enters “UNKNOWN” after an interview, but most of the time, “UNKNOWN” indicates that contact tracing was not successful (i.e., FDOH was not able to interview the person who tested positive).
The number of records with “UNKNOWN” or missing information in both of these fields allows us to estimate the number of questionable “cases.”
Using the most recent (as I write this) FDOH case line file (10/3), there are 714,591 “cases,” but 305,953 (43%) have “UNKNOWN” or blanks for both emergency room visit or hospitalization. Considering records with either category as unknown or blank increases the suspected bad data to 48%.
Breaking it down by case date, the percentage of records missing data in both fields increased dramatically in June, as asymptomatic testing increased. (The 55% in October is probably not meaningful since it’s only 3 days and interviews may not have been completed, but there’s no reason why July should be 52%.)
However, deaths are often reported months after the date of the positive test, and for people who roll around in the data every day, it’s obvious that the percentage of reported deaths with unknown data is getting worse; the most recent reports are much higher than the 24-25% of the last couple months. The table above is categorized on case date (the date the test result was received by FDOH), but looking at the death data by reporting date suggests that officials are farming death certificates for people who died with a positive COVID test rather than adding deaths that were legitimately caused by COVID.
The graph at the top shows that there is clearly an increasing trend in the percentage of deaths that are probably not true COVID cases because of missing or unknown information. While the overall percentage (by case date) was 20%, the percentage of bad data since August 3 (by report date) was 32%; over the last four weeks, it was 40%.
Remember, health officials assure us that these are actual cases of COVID-19, not simply positive tests. They tell us they’re contacting them and interviewing them to weed out false positives. At the very least, when someone who died a few months ago is matched to a positive COVID test and declared a COVID death, we should expect investigators to determine whether they visited an emergency room, were hospitalized, or were ever treated for any COVID-19 complications. The increasing percentage of bad data does not paint a good picture of the FDOH. It is possible that FDOH is overwhelmed and cannot properly complete the data, but it would be better to report correct data more slowly than to rush exaggerated numbers that fuel public panic and overreactions from elected officials.
If breathing into a paper bag doesn’t help, try this prayer at bedtime.
With apologies to Paul Revere, this post is on the lookout for cooler weather with an eye on both the Land and the Sea. UAH has updated their tlt (temperatures in lower troposphere) dataset for September 2020. Previously I have done posts on their reading of ocean air temps as a prelude to updated records from HADSST3. This month also has a separate graph of land air temps because the comparisons and contrasts are interesting as we contemplate possible cooling in coming months and years.
Presently sea surface temperatures (SST) are the best available indicator of heat content gained or lost from earth’s climate system. Enthalpy is the thermodynamic term for total heat content in a system, and humidity differences in air parcels affect enthalpy. Measuring water temperature directly avoids distorted impressions from air measurements. In addition, ocean covers 71% of the planet surface and thus dominates surface temperature estimates. Eventually we will likely have reliable means of recording water temperatures at depth.
Recently, Dr. Ole Humlum reported from his research that air temperatures lag 2-3 months behind changes in SST. He also observed that changes in CO2 atmospheric concentrations lag behind SST by 11-12 months. This latter point is addressed in a previous post Who to Blame for Rising CO2?
HadSST3 results were delayed with February and March updates only appearing together end of April. For comparison we can look at lower troposphere temperatures (TLT) from UAHv6 which are now posted for September. The temperature record is derived from microwave sounding units (MSU) on board satellites like the one pictured above.
The UAH dataset includes temperature results for air above the oceans, and thus should be most comparable to the SSTs. There is the additional feature that ocean air temps avoid Urban Heat Islands (UHI). In 2015 there was a change in UAH processing of satellite drift corrections, including dropping one platform which can no longer be corrected. The graphs below are taken from the latest and current dataset, Version 6.0.
The graph above shows monthly anomalies for ocean temps since January 2015. After all regions peaked with the El Nino in early 2016, the ocean air temps dropped back down with all regions showing the same low anomaly August 2018. Then a warming phase ensued peaking with NH and Tropics spikes in February, and a lesser rise May 2020. As was the case in 2015-16, the warming was driven by the Tropics and NH, with SH lagging behind. Since the peak in February 2020, all ocean regions have trended downward in a sawtooth pattern, returning to a flat anomaly in the three Summer months, close to the 0.4C average for the period. A small rise occurred in September, mostly due to SH.
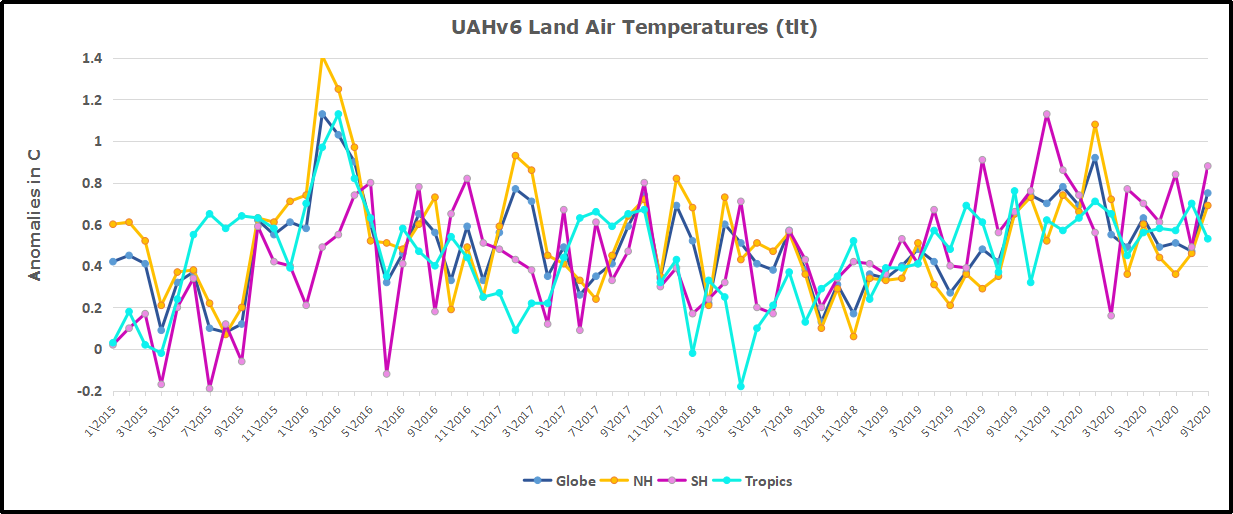
Land Air Temperatures Showing Volatility
We sometimes overlook that in climate temperature records, while the oceans are measured directly with SSTs, land temps are measured only indirectly. The land temperature records at surface stations sample air temps at 2 meters above ground. UAH gives tlt anomalies for air over land separately from ocean air temps. The graph updated for September 2020 is below.
Here we see the noisy evidence of the greater volatility of the Land temperatures, along with extraordinary departures, first by NH land with SH often offsetting. The overall pattern is similar to the ocean air temps, but obviously driven by NH with its greater amount of land surface. The Tropics synchronized with NH for the 2016 event, but otherwise follow a contrary rhythm. SH seems to vary wildly, especially in recent months.
Note the extremely high anomaly last November, cold in March 2020, and then again a spike in April. In June 2020, all land regions converged, erasing the earlier spikes in NH and SH, and showing anomalies comparable to the 0.5C average land anomaly this period. After a relatively quiet Summer, land air temps rose Globally in September with spikes in both NH and SH.
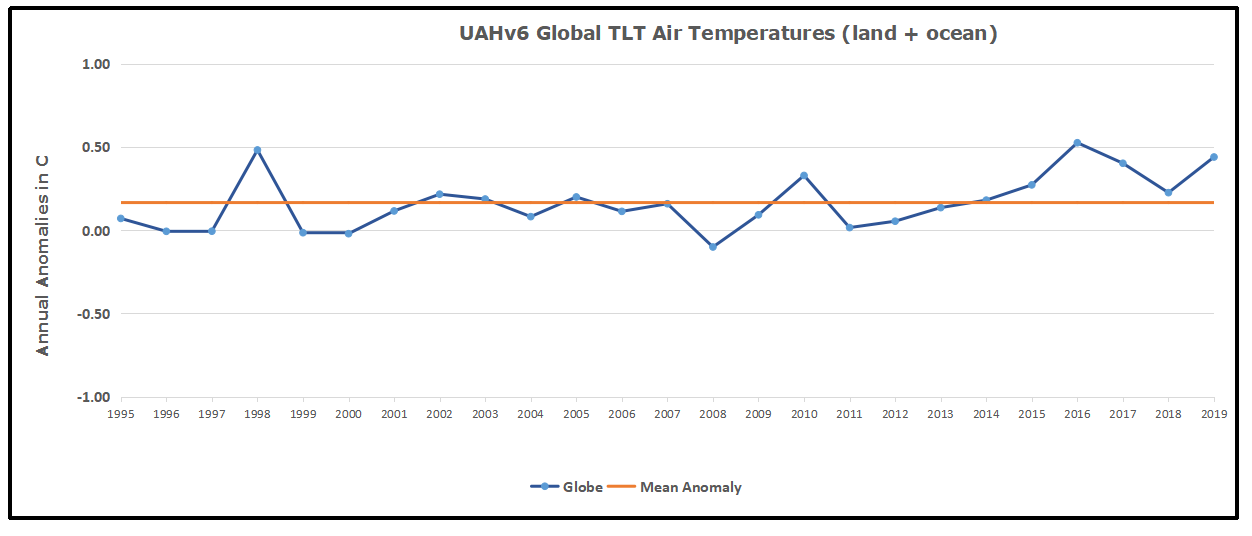
The longer term picture from UAH is a return to the mean for the period starting with 1995. 2019 average rose and caused 2020 to start warmly, but currently lacks any El Nino or NH warm blob to sustain it.
These charts demonstrate that underneath the averages, warming and cooling is diverse and constantly changing, contrary to the notion of a global climate that can be fixed at some favorable temperature.
TLTs include mixing above the oceans and probably some influence from nearby more volatile land temps. Clearly NH and Global land temps have been dropping in a seesaw pattern, NH in July more than 1C lower than the 2016 peak. TLT measures started the recent cooling later than SSTs from HadSST3, but are now showing the same pattern. It seems obvious that despite the three El Ninos, their warming has not persisted, and without them it would probably have cooled since 1995. Of course, the future has not yet been written.
On Oct. 4, 2020, three preeminent experts — Dr. Martin Kulldorff, professor of medicine at Harvard University; Dr. Sunetra Gupta, an epidemiologist at Oxford University; and Dr. Jay Bhattacharya, a physician and epidemiologist at Stanford University — delivered the following declaration, calling for a different approach to dealing with the novel coronavirus than the lockdown model:
As infectious-disease epidemiologists and public-health scientists, we have grave concerns about the damaging physical and mental-health impacts of the prevailing COVID-19 policies and recommend an approach we call Focused Protection.
Coming from both the left and right, and around the world, we have devoted our careers to protecting people. Current lockdown policies are producing devastating effects on short- and long-term public health.
The results (to name a few) include lower childhood-vaccination rates, worsening cardiovascular-disease outcomes, fewer cancer screenings and deteriorating mental health — leading to greater excess mortality in years to come, with the working class and younger members of society carrying the heaviest burden. Keeping students out of school is a grave injustice.
Keeping these measures in place until a vaccine is available will cause irreparable damage, with the underprivileged disproportionately harmed.
Fortunately, our understanding of the virus is growing. We know that vulnerability to death from COVID-19 is more than a thousand-fold higher in the old and infirm than the young. Indeed, for children, COVID-19 is less dangerous than many other harms, including influenza.
As immunity builds in the population, the risk of infection to all — including the vulnerable — falls. We know that all populations will eventually reach herd immunity — that is, the point at which the rate of new infections is stable — and that this can be assisted by (but is not dependent upon) a vaccine. Our goal should, therefore, be to minimize mortality and social harm until we reach herd immunity.
The most compassionate approach that balances the risks and benefits of reaching herd immunity is to allow those who are at minimal risk of death to live their lives normally to build up immunity to the virus through natural infection, while better protecting those who are at highest risk. This is Focused Protection.
Adopting measures to protect the vulnerable should be the central aim of public-health responses to COVID-19. By way of example, nursing homes should use staff with acquired immunity and perform frequent polymerase-chain-reaction testing of other staff and all visitors. Staff rotation should be minimized.
Retired people living at home should have groceries and other essentials delivered to their homes. When possible, they should meet family members outside, rather than inside. A comprehensive and detailed list of measures, including approaches to multigenerational households, can be implemented and is well within the scope and capability of public-health professionals.
Those who are not vulnerable should immediately be allowed to resume life as normal. Simple hygiene measures, such as handwashing and staying home when sick, should be practiced by everyone to reduce the herd immunity threshold.
Schools and universities should be open for in-person teaching. Extracurricular activities, such as sports, should be resumed. Young, low-risk adults should work normally, rather than from home. Restaurants and other businesses should open. Arts, music, sport and other cultural activities should resume. People who are more at risk may participate if they wish, while society as a whole enjoys the protection conferred upon the vulnerable by those who have built up herd immunity.
Since the declaration was published, more than 2,000 public-health scientists and more than 2,000 medical practitioners have signed it, as have nearly 40,000 members of the general public. You can add your signature to the declaration online at https://gbdeclaration.org.
President Donald Trump has been infected by the COVID-19 virus, and no doubt there are thousands out there saying it serves him right, that he has shrugged his shoulders at the pandemic, even refused to wear face masks and has caused thousands of deaths.
I would say something different, that this is still another event marking 2020 as one of the strangest years in American history, one that signals good reasons to shake and shiver, and not only because of a frightful pandemic and an ultra-bizarre president.
Have you noticed principle-shattering leftists, bureaucratic rot, a racial justice movement overtaken by unjust riots, the war on law enforcement, congressional extremism, media degeneration, social media mayhem, and that some of the science deniers about climate change are the totalitarian alarmists?
Yes, Trump has been a helter-skelter messenger on the pandemic, an occasional absurdity promoter and a misleading dueler with a gotcha press. In the early going, he seemed almost as unconcerned as Gov. Andrew Cuomo of New York, Joe Biden and half of everyone else. But the administration was up to all kinds of meaningful, media-neglected actions early on, with some of the goofs actually coming from the CDC.
Trump was definitively instructed by critics that he had no authority over the states. That is correct, and it is the states that have made the mistakes in resolving this deadly medical mystery, not him.
The Washington Free Beacon recently ran a list of Biden’s phony campaign assertions about Trump and the virus, and keep them in mind in assessing how miswrought his own leadership could be. He said Trump silenced a CDC expert when he didn’t, that he called the virus a “hoax” when he was referring to Democratic shenanigans, that he eliminated a pandemic office that had instead been reconstituted, that he put no pressure on China when he did, that he reduced our CDC scientists in China when he didn’t and that he refused virus test kits from the World Health Organization that never said we could have them.
I know, only Trump “lies” are important, but he is not lying when he says it is crucial to get the economy started again. If you think that doesn’t matter as much as virus dangers, look at the white working class in which 150,000 people have long been dying of alcohol, drugs and suicide each year at least partly in reaction to economic shifts taking away jobs. We could have years of struggle if we don’t get started while at least being as careful as Sweden that has handled the virus pretty well without a shutdown.
Trump helped put together an outstanding economy before the virus while Biden wants debt more than Trump does and taxes and more regulations that would in effect be another shutdown that he says he might call for anyway.
Biden also says he might favor packing of the Supreme Court, an extreme leftist position that could lead to parties rearranging the court and thereby destroying it whenever they resumed control of the White House and Senate. This is the Democrats today, the party that worked with the FBI to indulge in a farcical investigation of the Trump campaign coordinating with the Russians in illegal means of winning in 2016. Information is mounting about the connivance in all of this.
It’s no small thing to try to unseat a president illegitimately and intimidate governance for more than two years, and the current treatment of Biden’s conflicts of interest as nothing much shows a morally twisted prejudice.
My point in all of this is that the election-year issues aren’t as straightforward as some pretend, that, while Trump is scary, the other side is in some ways far scarier, that preserving Republican control of the Senate is imperative and that the public should consider varied points of view. Meanwhile, I wish Trump, his wife and other virus victims the best while hoping he may return for another debate with a touch of humility.
Many expert voices are challenging the notion of a coronavirus “second wave”. H/T LockdownSceptics
Dr. Mike Yeadon, a former Vice President and Chief Science Officer for Pfizer for 16 years, says that half or even “almost all” of tests for COVID are false positives. Dr. Yeadon also argues that the threshold for herd immunity may be much lower than previously thought, and may have been reached in many countries already.
In an interview last week Dr. Yeadon was asked: “we are basing a government policy, an economic policy, a civil liberties policy, in terms of limiting people to six people in a meeting…all based on, what may well be, completely fake data on this coronavirus?” Dr. Yeadon answered with a simple “yes.”
Dr. Yeadon said in the interview that, given the “shape” of all important indicators in a worldwide pandemic, such as hospitalizations, ICU utilization, and deaths, “the pandemic is fundamentally over.”
“Were it not for the test data that you get from the TV all the time, you would rightly conclude that the pandemic was over, as nothing much has happened. Of course people go to the hospital, moving into the autumn flu season…but there is no science to suggest a second wave should happen.”
Dr. Mike Yeadon on new paper:
I never expected to be writing something like this. I am an ordinary person, recently semi-retired from a career in the pharmaceutical industry and biotech, where I spent over 30 years trying to solve problems of disease understanding and seek new treatments for allergic and inflammatory disorders of lung and skin. I’ve always been interested in problem solving, so when anything biological comes along, my attention is drawn to it. Come 2020, came SARS-CoV-2. I’ve written about the pandemic as objectively as I could. The scientific method never leaves a person who trained and worked as a professional scientist. Please do read that piece. My co-authors & I will submit it to the normal rigours of peer review, but that process is slow and many pieces of new science this year have come to attention through pre-print servers and other less conventional outlets.
Evidence presented in this paper indicates that the severe acute respiratory syndrome coronavirus 2 pandemic as an event in the UK is essentially complete, with ongoing and anticipated challenges well within the capacity of a normalised NHS to cope. The virus infection has passed through the bulk of the population as a result of wholly natural processes and evidence indicates that in the UK and other heavily infected European countries the spread of the virus has been all but halted by a substantial reduction in the susceptible population. This has occurred because the level of infection required to introduce enough immunity into the population to reduce the reproduction number (R) permanently below 1 occurred at markedly lower infection rates and loss of life than had been initially anticipated. The evidence presented in this paper indicates that there should be no expectation of a large scale ‘second wave’ with smaller localised outbreaks when the virus contacts pockets of previously uninfected populations.
Current mass testing using the PCR test is inappropriate in its current form. If it is to continue, then results and reporting should be refined to meet the gold standard of testing methodology to give clinicians improved information so that they are able to make appropriate clinical decisions. Positive tests should be confirmed by testing a second sample and all positive tests should be reported along with the Cycle Threshold (Ct) obtained during the test to aid assessment of a patient’s viral load.
It is recommended that a greater focus be placed on evidence-based medicine rather than highly sensitive theoretical modelling based on assumptions and unknowns. Current evidence allows for a greatly improved understanding of positive infectious patients and using the evidence to improve measurements and understanding can lead to sensitive measurements of active cases to give a more accurate warning of escalating cases and potential issues and outbreaks.
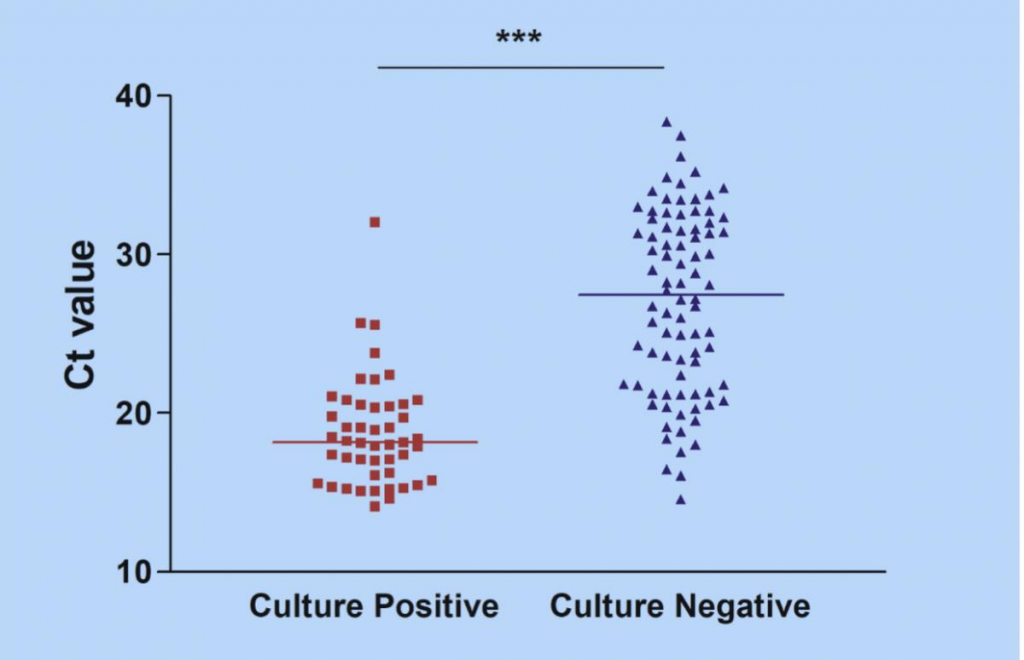
It is important to recall what it is that the PCR test measures, and it is simply the presence of partial RNA sequences present in the intact virus. This means that even a true positive does not necessarily indicate the presence of viable virus. In limited studies to date, many researchers have shown that some subjects remain PCR-positive long after the ability to culture virus from swabs has disappeared. We term this a ‘cold positive’ (to distinguish it from a ‘hot positive’, someone actually infected with intact virus). The key point about ‘cold positives’ is that they are not ill, not symptomatic, not going to become symptomatic and, furthermore, are unable to infect others. As each PCR test that is carried out returns the Cycle Threshold (Ct) used to obtain a positive result, it is important that this Ct is reported with every positive result. The Ct gives strong evidence of the viral load and aids clinicians in determining if a patient has a “hot” infectious positive result or a “cold” non-infectious positive result. Gniazdowski et al (2020) studied 161 positive PCR test samples with a Ct value below 23 that yielded 91.5% of virus isolates and the study showed a strong correlation between recovery of SARS-CoV-2 infectious virus on cell culture and Ct values. Ct values above 30 returned negative cultures in all except one case.
Note that recent so-called ’spikes’ were never accompanied or followed by people getting ill, going to hospital and dying in elevated numbers. Consequently, it is possible that most of the positives from mass testing are either false positives or ‘cold positives’ (fragments of real virus which are not intact and incapable of replication or of causing disease or infecting others) and therefore begs the question of whether mass testing of patients without symptoms is in fact helpful or misleading? It may be of relevance to note that, on August 24th the US CDC changed its guidance on when PCR testing is appropriate. They now recommend not testing people with no symptoms who are not contacts in a contact-tracing activity.
Read the linked paper for full description of the supporting evidence and analysis. Reprinted below is are remarks from Dr. Mina that I found accessible explaining the issue.
Background from previous post On Non-Infectious Covid Positives
Elevated ‘cycle thresholds’ may be detecting virus long after it is past the point of infection.
A growing body of research suggests that a significant number of confirmed COVID-19 infections in the U.S. — perhaps as many as 9 out of every 10 — may not be infectious at all, with much of the country’s testing equipment possibly picking up mere fragments of the disease rather than full-blown infections.
Yet a burgeoning line of scientific inquiry suggests that many confirmed infections of COVID-19 may actually be just residual traces of the virus itself, a contention that — if true — may suggest both that current high levels of positive viruses are clinically insignificant and that the mitigation measures used to suppress them may be excessive.
Background from previous post: New Better and Faster Covid Test
Kevin Pham reports on a breakthrough in coronavirus testing. Excerpts in italics with my bolds.
Another new test for COVID-19 was recently authorized — and this one could be a game-changer.
The Abbot Diagnostics BinaxNOW antigen test is a new point-of-care test that reportedly costs only $5 to administer, delivers results in as little as 15 minutes, and requires no laboratory equipment to perform. That means it can be used in clinics far from commercial labs or without relying on a nearby hospital lab.
That last factor is key. There are other quick COVID-19 tests on the market, but they have all required lab equipment that can be expensive to maintain and operate, and costs can be prohibitive in places that need tests most.
This kind of test is reminiscent of rapid flu tests that are ubiquitous in clinics. They’ll give providers tremendous flexibility in testing for the disease in not just clinics, but with trained and licensed medical professionals, in schools, workplaces, camps, or any other number of places.
So what’s new about this test? Most of the current tests detect viral RNA, the genetic material of SARS-CoV-2. This is a very accurate way of detecting the virus, but it requires lab equipment to break apart the virus and amplify the amount of genetic material to high enough levels for detection.
The BinaxNOW test detects antigens — proteins unique to the virus that are usually detectable whenever there is an active infection.
Abbott says it intends to produce 50 million tests per month starting in October. That’s far more than the number tested in July, when we were breaking new testing records on a daily basis with approximately 23 million tests recorded.
There’s a more important reason to be encouraged by this test coming available. The viral load is not amplified by the test, so a positive is actually a person needing isolation and treatment. As explained in a previous post below, the PCR tests used up to now clutter up the record by showing as positive people with viral loads too low to be sick or to infect others.
Background from Previous Post The Truth About CV Tests
The peoples’ instincts are right, though they have been kept in the dark about this “pandemic” that isn’t. Responsible citizens are starting to act out their outrage from being victimized by a medical-industrial complex (to update Eisenhower’s warning decades ago). The truth is, governments are not justified to take away inalienable rights to life, liberty and the pursuit of happiness. There are several layers of disinformation involved in scaring the public. This post digs into the CV tests, and why the results don’t mean what the media and officials claim.
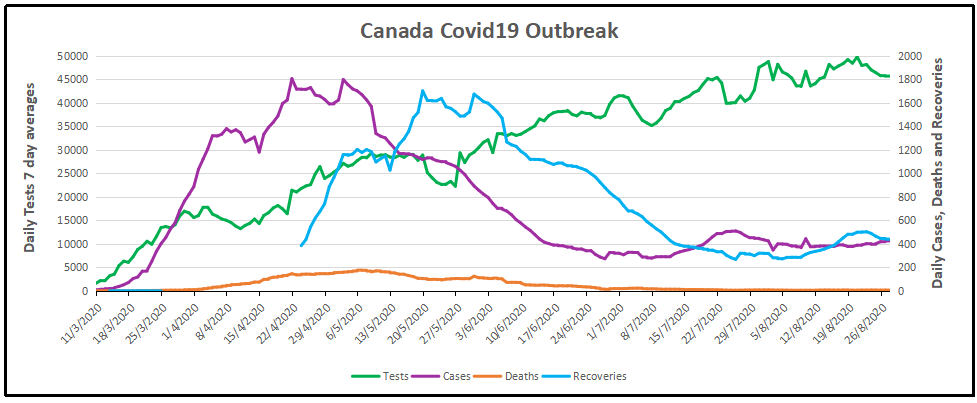
For months now, I have been updating the progress in Canada of the CV outbreak. A previous post later on goes into the details of extracting data on tests, persons testing positive (termed “cases” without regard for illness symptoms) and deaths after testing positive. Currently, the contagion looks like this.
The graph shows that deaths are less than 5 a day, compared to a daily death rate of 906 in Canada from all causes. Also significant is the positivity ratio: the % of persons testing positive out of all persons tested each day. That % has been fairly steady for months now: 1% positive means 99% of people are not infected. And this is despite more than doubling the rate of testing.
But what does testing positive actually mean? Herein lies more truth that has been hidden from the public for the sake of an agenda to control free movement and activity. Background context comes from Could Rapid Coronavirus Testing Help Life Return To Normal?, an interview at On Point with Dr. Michael Mina. Excerpts in italics with my bolds. H/T Kip Hansen
A sign displays a new rapid coronavirus test on the new Abbott ID Now machine at a ProHEALTH center in Brooklyn on August 27, 2020 in New York City. (Spencer Platt/Getty Images)
Dr. Michael Mina:
COVID tests can actually be put onto a piece of paper, very much like a pregnancy test. In fact, it’s almost exactly like a pregnancy test. But instead of looking for the hormones that tell if somebody is pregnant, it looks for the virus proteins that are part of SA’s code to virus. And it would be very simple: You’d either swab the front of your nose or you’d take some saliva from under your tongue, for example, and put it onto one of these paper strips, essentially. And if you see a line, it means you’re positive. And if you see no line, it means you are negative, at least for having a high viral load that could be transmissible to other people.
An antigen is one of the proteins in the virus. And so unlike the PCR test, which is what most people who have received a test today have generally received a PCR test. And looking those types of tests look for the genome of the virus to RNA and you could think of RNA the same way that humans have DNA. This virus has RNA. But instead of looking for RNA like the PCR test, these antigen tests look for pieces of the protein. It would be like if I wanted a test to tell me, you know, that somebody was an individual, it would actually look for features like their eyes or their nose. And in this case, it is looking for different parts of the virus. In general, the spike protein or the nuclear capsid, these are two parts of the virus.
The reason that these antigen tests are going to be a little bit less sensitive to detect the virus molecules is because there’s no step that we call an amplification step. One of the things that makes the PCR test that looks for the virus RNA so powerful is that it can take just one molecule, which the sensor on the machine might not be able to detect readily, but then it amplifies that molecule millions and millions of times so that the sensor can see it. These antigen tests, because they’re so simple and so easy to use and just happen on a piece of paper, they don’t have that amplification step right now. And so they require a larger amount of virus in order to be able to detect it. And that’s why I like to think of these types of tests having their primary advantage to detect people with enough virus that they might be transmitting or transmissible to other people.”
Similar PCR tests for other viruses nearly always offer some measure of the amount of virus. But yes/no isn’t good enough, Mina added. “It’s the amount of virus that should dictate the infected patient’s next steps. “It’s really irresponsible, I think, to [ignore this]” Dr. Mina said, of how contagious an infected patient may be.
“We’ve been using one type of data for everything,” Mina said. “for [diagnosing patients], for public health, and for policy decision-making.”
The PCR test amplifies genetic matter from the virus in cycles; the fewer cycles required, the greater the amount of virus, or viral load, in the sample. The greater the viral load, the more likely the patient is to be contagious.
This number of amplification cycles needed to find the virus, called the cycle threshold, is never included in the results sent to doctors and coronavirus patients, although if it was, it could give them an idea of how infectious the patients are.
One solution would be to adjust the cycle threshold used now to decide that a patient is infected. Most tests set the limit at 40, a few at 37. This means that you are positive for the coronavirus if the test process required up to 40 cycles, or 37, to detect the virus.
Any test with a cycle threshold above 35 is too sensitive, Juliet Morrison, a virologist at the University of California, Riverside told the New York Times. “I’m shocked that people would think that 40 could represent a positive,” she said.
A more reasonable cutoff would be 30 to 35, she added. Dr. Mina said he would set the figure at 30, or even less.
Another solution, researchers agree, is to use even more widespread use of Rapid Diagnostic Tests (RDTs) which are much less sensitive and more likely to identify only patients with high levels of virus who are a transmission risk.
Comment: In other words, when they analyzed the tests that also reported cycle threshold (CT), they found that 85 to 90 percent were above 30. According to Dr. Mina a CT of 37 is 100 times too sensitive (7 cycles too much, 2^7 = 128) and a CT of 40 is 1,000 times too sensitive (10 cycles too much, 2^10 = 1024). Based on their sample of tests that also reported CT, as few as 10 percent of people with positive PCR tests actually have an active COVID-19 infection. Which is a lot less than reported.
Here is a graph showing how this applies to Canada.
It is evident that increased testing has resulted in more positives, while the positivity rate is unchanged. Doubling the tests has doubled the positives, up from 300 a day to nearly 600 a day presently. Note these are PCR results. And the discussion above suggests that the number of persons with an active infectious viral load is likely 10% of those reported positive: IOW up from 30 a day to 60 a day. And in the graph below, the total of actual cases in Canada is likely on the order of 13,000 total from the last 7 months, an average of 62 cases a day.
WuFlu Exposes a Fundamental Flaw in US Health System
Dr. Mina goes on to explain what went wrong in US response to WuFlu:
In the U.S, we have a major focus on clinical medicine, and we have undervalued and underfunded the whole concept of public health for a very long time. We saw an example of this for, for example, when we tried to get the state laboratories across the country to be able to perform the PCR tests back in March, February and March, we very quickly realized that our public health infrastructure in this country just wasn’t up to the task. We had very few labs that were really able to do enough testing to just meet the clinical demands. And so such a reduced focus on public health for so long has led to an ecosystem where our regulatory agencies, this being primarily the FDA, has a mandate to approve clinical medical diagnostic tests. But there’s actually no regulatory pathway that is available or exists — and in many ways, we don’t even have a language for it — for a test whose primary purpose is one of public health and not personal medical health
That’s really caused a problem. And a lot of times, it’s interesting if you think about the United States, every single test that we get, with the exception maybe of a pregnancy test, has to go through a physician. And so that’s a symptom of a country that has focused, and a society really, that has focused so heavily on the medical industrial complex. And I’m part of that as a physician. But I also am part of the public health complex as an epidemiologist. And I see that sometimes these are at odds with each other, medicine and public health. And this is an example where because all of our regulatory infrastructure is so focused on medical devices… If you’re a public health person, you can actually have a huge amount of leeway in how your tests are working and still be able to get epidemics under control. And so there’s a real tension here between the regulations that would be required for these types of tests versus a medical diagnostic test.
Footnote: I don’t think the Chinese leaders were focusing on the systemic weakness Dr. MIna mentions. But you do have to bow to the inscrutable cleverness of the Chinese Communists releasing WuFlu as a means to set internal turmoil within democratic capitalist societies. On one side are profit-seeking Big Pharma, aided and abetted by Big Media using fear to attract audiences for advertising revenues. The panicked public demands protection which clueless government provides by shutting down the service and manufacturing industries, as well as throwing money around and taking on enormous debt. The world just became China’s oyster.
Background from Previous Post: Covid Burnout in Canada August 28
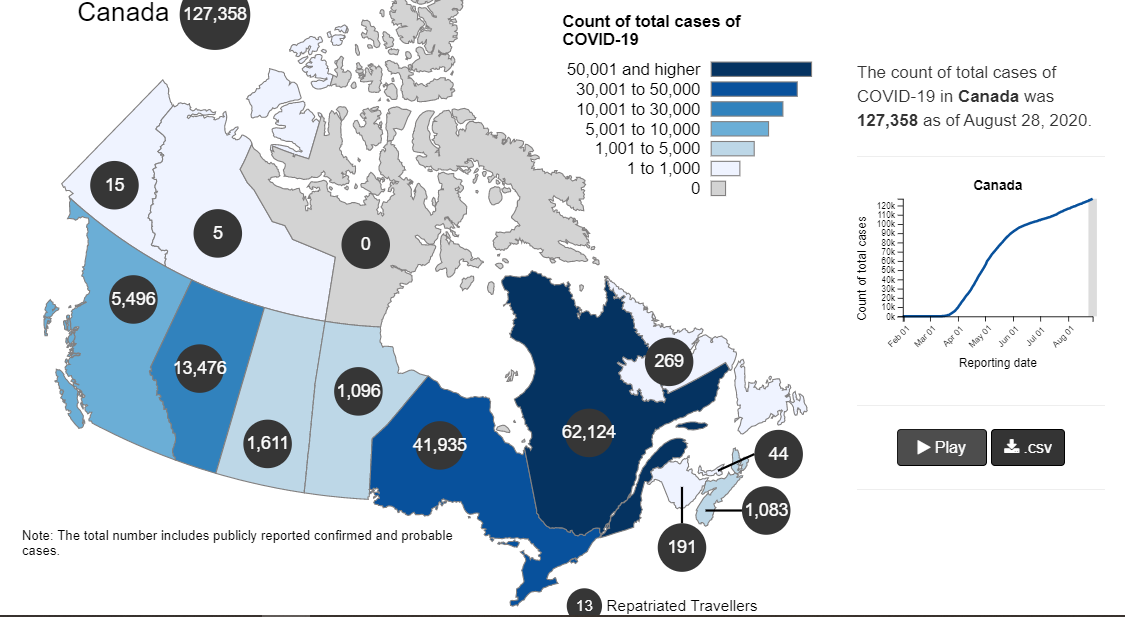
The map shows that in Canada 9108 deaths have been attributed to Covid19, meaning people who died having tested positive for SARS CV2 virus. This number accumulated over a period of 210 days starting January 31. The daily death rate reached a peak of 177 on May 6, 2020, and is down to 6 as of yesterday. More details on this below, but first the summary picture. (Note: 2019 is the latest demographic report)
Canada Pop
Ann Deaths
Daily Deaths
Risk per Person
2019
37589262
330786
906
0.8800%
Covid 2020
37589262
9108
43
0.0242%
Over the epidemic months, the average Covid daily death rate amounted to 5% of the All Causes death rate. During this time a Canadian had an average risk of 1 in 5000 of dying with SARS CV2 versus a 1 in 114 chance of dying regardless of that infection. As shown later below the risk varied greatly with age, much lower for younger, healthier people.
Background Updated from Previous Post
In reporting on Covid19 pandemic, governments have provided information intended to frighten the public into compliance with orders constraining freedom of movement and activity. For example, the above map of the Canadian experience is all cumulative, and the curve will continue upward as long as cases can be found and deaths attributed. As shown below, we can work around this myopia by calculating the daily differentials, and then averaging newly reported cases and deaths by seven days to smooth out lumps in the data processing by institutions.
A second major deficiency is lack of reporting of recoveries, including people infected and not requiring hospitalization or, in many cases, without professional diagnosis or treatment. The only recoveries presently to be found are limited statistics on patients released from hospital. The only way to get at the scale of recoveries is to subtract deaths from cases, considering survivors to be in recovery or cured. Comparing such numbers involves the delay between infection, symptoms and death. Herein lies another issue of terminology: a positive test for the SARS CV2 virus is reported as a case of the disease COVID19. In fact, an unknown number of people have been infected without symptoms, and many with very mild discomfort.
August 7 in the UK it was reported (here) that around 10% of coronavirus deaths recorded in England – almost 4,200 – could be wiped from official records due to an error in counting. Last month, Health Secretary Matt Hancock ordered a review into the way the daily death count was calculated in England citing a possible ‘statistical flaw’. Academics found that Public Health England’s statistics included everyone who had died after testing positive – even if the death occurred naturally or in a freak accident, and after the person had recovered from the virus. Numbers will now be reconfigured, counting deaths if a person died within 28 days of testing positive much like Scotland and Northern Ireland…
Professor Heneghan, director of the Centre for Evidence-Based Medicine at Oxford University, who first noticed the error, told the Sun:
‘It is a sensible decision. There is no point attributing deaths to Covid-19 28 days after infection…
For this discussion let’s assume that anyone reported as dying from COVD19 tested positive for the virus at some point prior. From the reasoning above let us assume that 28 days after testing positive for the virus, survivors can be considered recoveries.
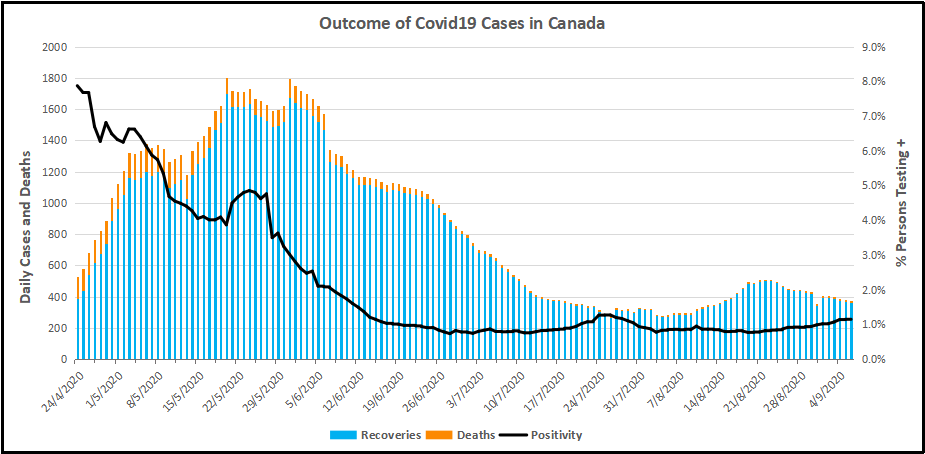
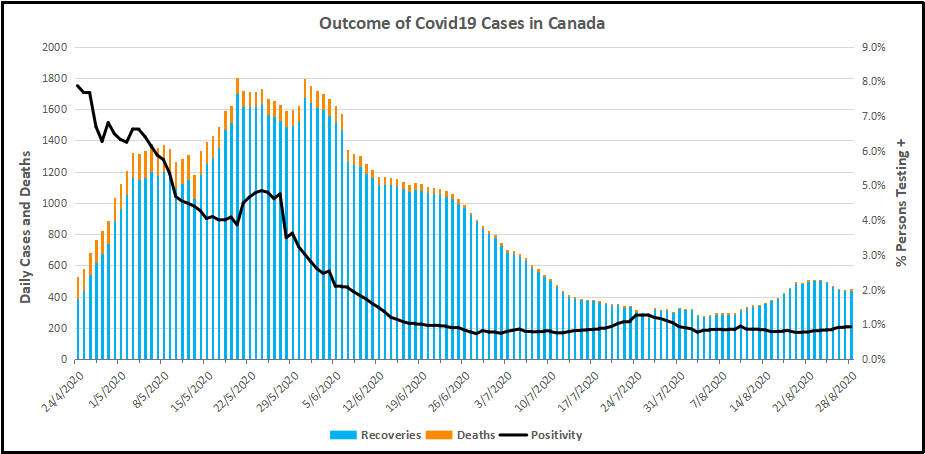
Recoveries are calculated as cases minus deaths with a lag of 28 days. Daily cases and deaths are averages of the seven days ending on the stated date. Recoveries are # of cases from 28 days earlier minus # of daily deaths on the stated date. Since both testing and reports of Covid deaths were sketchy in the beginning, this graph begins with daily deaths as of April 24, 2020 compared to cases reported on March 27, 2020.
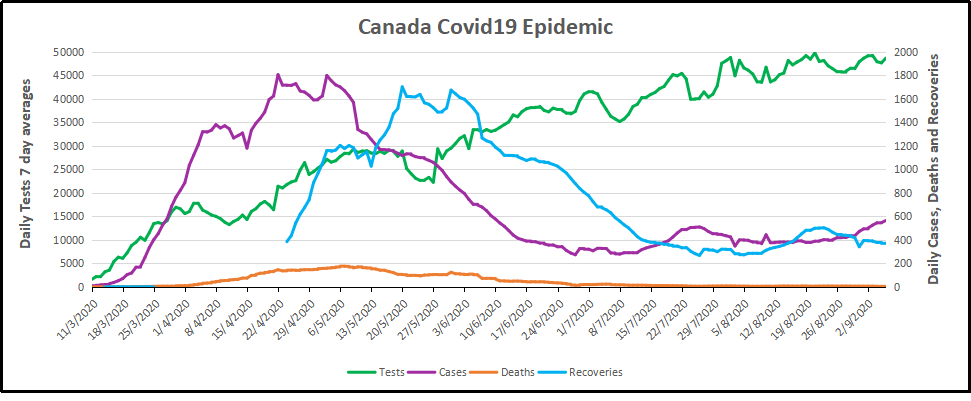
The line shows the Positivity metric for Canada starting at nearly 8% for new cases April 24, 2020. That is, for the 7 day period ending April 24, there were a daily average of 21,772 tests and 1715 new cases reported. Since then the rate of new cases has dropped down, now holding steady at ~1% since mid-June. Yesterday, the daily average number of tests was 45,897 with 427 new cases. So despite more than doubling the testing, the positivity rate is not climbing. Another view of the data is shown below.
The scale of testing has increased and now averages over 45,000 a day, while positive tests (cases) are hovering at 1% positivity. The shape of the recovery curve resembles the case curve lagged by 28 days, since death rates are a small portion of cases. The recovery rate has grown from 83% to 99% steady over the last 2 weeks, so that recoveries exceed new positives. This approximation surely understates the number of those infected with SAR CV2 who are healthy afterwards, since antibody studies show infection rates multiples higher than confirmed positive tests (8 times higher in Canada). In absolute terms, cases are now down to 427 a day and deaths 6 a day, while estimates of recoveries are 437 a day.
The key numbers:
99% of those tested are not infected with SARS CV2.
99% of those who are infected recover without dying.
Summary of Canada Covid Epidemic
It took a lot of work, but I was able to produce something akin to the Dutch advice to their citizens.
The media and governmental reports focus on total accumulated numbers which are big enough to scare people to do as they are told. In the absence of contextual comparisons, citizens have difficulty answering the main (perhaps only) question on their minds: What are my chances of catching Covid19 and dying from it?
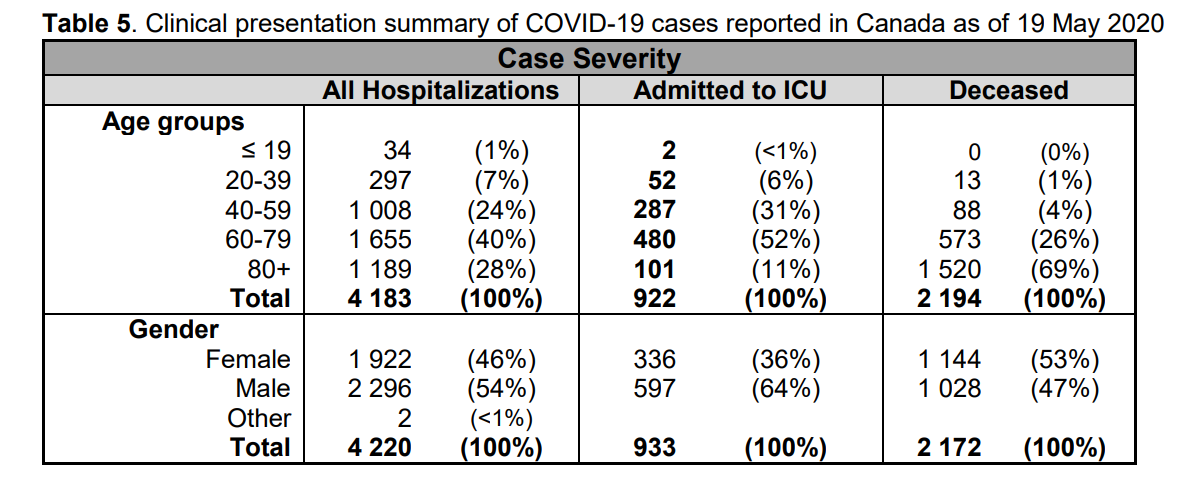
A previous post reported that the Netherlands parliament was provided with the type of guidance everyone wants to see.
The table presents only those cases with a full clinical documentation, which included some 2194 deaths compared to the 5842 total reported. The numbers show that under 60 years old, few adults and almost no children have anything to fear.
Update May 20, 2020
It is really quite difficult to find cases and deaths broken down by age groups. For Canadian national statistics, I resorted to a report from Ontario to get the age distributions, since that province provides 69% of the cases outside of Quebec and 87% of the deaths. Applying those proportions across Canada results in this table. For Canada as a whole nation:
Age
Risk of Test +
Risk of Death
Population per 1 CV death
<20
0.05%
None
NA
20-39
0.20%
0.000%
431817
40-59
0.25%
0.002%
42273
60-79
0.20%
0.020%
4984
80+
0.76%
0.251%
398
In the worst case, if you are a Canadian aged more than 80 years, you have a 1 in 400 chance of dying from Covid19. If you are 60 to 80 years old, your odds are 1 in 5000. Younger than that, it’s only slightly higher than winning (or in this case, losing the lottery).
As noted above Quebec provides the bulk of cases and deaths in Canada, and also reports age distribution more precisely, The numbers in the table below show risks for Quebecers.
Age
Risk of Test +
Risk of Death
Population per 1 CV death
0-9 yrs
0.13%
0
NA
10-19 yrs
0.21%
0
NA
20-29 yrs
0.50%
0.000%
289,647
30-39
0.51%
0.001%
152,009
40-49 years
0.63%
0.001%
73,342
50-59 years
0.53%
0.005%
21,087
60-69 years
0.37%
0.021%
4,778
70-79 years
0.52%
0.094%
1,069
80-89
1.78%
0.469%
213
90 +
5.19%
1.608%
62
While some of the risk factors are higher in the viral hotspot of Quebec, it is still the case that under 80 years of age, your chances of dying from Covid 19 are better than 1 in 1000, and much better the younger you are.
Science in the U.S. is under assault by postmodernism, political partisanship, and trial lawyers. Without a change in the direction of our culture, American technological supremacy is facing an existential threat.
I’ve always been bullish about American scientific and technological supremacy, not in some starry-eyed, jingoistic way, but due to the simple reality that the United States remains the world’s research and development engine.
This is true for at least four reasons, which I detailed previously: (1) Superior higher education; (2) A cultural attitude that encourages innovation; (3) Substantial funding and financial incentives; and (4) A legal framework that protects intellectual property and tolerates failure through efficient bankruptcy laws. There’s a fifth, fuzzier reason, namely that smart and talented people have long gravitated toward the U.S.
But while Americans believe in unalienable rights endowed by our Creator, we are not similarly guaranteed everlasting technological supremacy. China is already challenging the U.S. in computer science, chemistry, engineering, and robotics. Without a consistent and relentless pursuit of excellence, the eagle risks losing its perch.
Unfortunately, there are a confluence of factors that, when combined, constitute an existential threat to American science: Postmodernism, political partisanship, and trial lawyers.
Postmodernism.
Though nobody can actually define postmodernism, it is characterized by a rejection of objective truth. This toxic ideology is rampant in academia and gaining popularity in the broader culture. Its most nefarious manifestation is Critical Theory, which derives from Marxism and posits that society is nothing but a hierarchy of oppressors and the oppressed. Out of this nonsense comes the absurd belief that the scientific method and even knowledge itself are tools of the white patriarchy.
Does this all sound too ridiculous to be real? Alas, it is. Until it received a public backlash, the Smithsonian published a web page claiming that an “emphasis on the scientific method” and a focus on “objective, rational linear thinking” are examples of “white culture.” Investigations into the biological differences between men and women (of which there are many) are deemed sexist. Information of any kind that offends the listener is labeled “fake news.”
In reality, a nation that can no longer tell the difference between truth and lies may be facing societal decline.
Political partisanship.
There was a time when scientists knew better than to deal in politics. That time is now gone. Openly cheering for one side of the political spectrum over the other, scientists and science media outlets are gambling with their reputation.
For the first time in its 175-year history, Scientific American foolishly endorsed a presidential candidate, apparently blind to the fact that the once esteemed magazine avoided politics for nearly two centuries for a very good reason. Not to be left behind, the editor-in-chief of the internationally renowned journal Science penned an editorial about why he doesn’t like President Trump. 314 Action, a political group that seeks to elect scientists into public office, doesn’t even bother reaching out to the other side of the aisle.
This will all backfire. One of the quickest ways to destroy one’s credibility is by being overtly political, yet more of the scientific community is doing precisely that. Once credibility is lost, trust and funding often go along with it.
Trial lawyers.
Like vultures hunting for a carcass on a desert highway, trial lawyers lurk in the background, swooping down to win jackpot verdicts against large firms, often those in the agricultural technology and pharmaceutical industries. The pattern is always the same: Activists blame chemical X for causing disease Y, usually based on very flimsy evidence, and then lawyers sue the largest multi-billion-dollar company they can find in the hope of making it rain money. Because of this, we have termed this cabal the activist-legal complex. Its arsenal of pseudoscientific tricks often works. Just ask Monsanto or Johnson & Johnson.
Worse, trial lawyers undermine the integrity of science by pitting one scientist against another. Usually, one of them is correct and endorses the scientific consensus, while the other is spouting nonsense. (As it turns out, you can find a crackpot on just about any given topic. There are a handful of biologists who deny that HIV causes AIDS, for instance.) This gives juries and judges (and the public) the impression that scientific analysis is simply one opinion among many.
Self-Inflicted Wounds Cut the Deepest
Societal decline is a choice. So is the coming decline of American technological supremacy. The good news is that, though these self-inflicted wounds are substantial, they are not irreversible. Postmodernism could be an intellectual fad that evaporates in the coming years. Likewise, political partisanship has waxed and waned over the decades and will hopefully wane once again. Laws can be implemented that put a leash on trial lawyers.
But these things require effort and a change in mindset. Barring a substantial shift in the cultural winds, we may be witnessing the slow suicide of American science.
In recent months, some demonstrators in Quebec have denounced what they consider government fear campaigns over COVID-19. The new measures included a mandatory rule on wearing masks during demonstrations. (Graham Hughes/The Canadian Press)
The coronavirus pandemic began as a global health crisis. It spawned an economic crisis. Now COVID-19 is also fueling a crisis for democracy and human rights.
Leaders around the world are using the virus as cover to reduce transparency, increase surveillance, arrest dissidents, repress marginalized populations, embezzle public resources, restrict media, and undermine fair elections.
Quebec premier clarified the province’s new COVID-19 measures in red zones
Quebec Premier François Legault says police in the province’s red zones — regions where COVID-19 cases are surging — will be issuing $1,000 fines to those who violate newly strengthened public health rules.
With fees, those fines will top $1,500 and can be issued for gathering in private residences or protesting without a face covering.
Speaking during a late-afternoon news conference on Wednesday just hours before the new rules went into effect, Legault said the negligence of a few has led to the crackdown.
“Lives are at stake. We want to keep our children in schools,” Legault said. “We also want to protect our health network”
Quebec reported 838 new cases of COVID-19 but no new deaths Wednesday. Since the start of the pandemic, there have been 74,288 confirmed cases and 5,834 people have died in the province.
Home gatherings can lead to fines
Beyond the few exceptions, such as for caregivers or romantic relations, house guests are not allowed, Legault said.
Police are authorized to demand proof of residency and if residents refuse entry, officers will be able to obtain warrants faster through a new, virtual system that was established in collaboration with the Crown, the premier said.
“We had to give the police the means to intervene,” said Public Security Minister Geneviève Guilbault.
Protestors to be fined for refusing to wear masks
Quebec made masks mandatory inside public spaces, like bars and shops, on July 18, but there have been several protests since.
Now, anti-maskers will have to cover up if they want to march or police will be issuing fines.
All gatherings prohibited, travel discouraged
Legault said all gatherings will be banned, even outside in public parks — an activity that has grown more popular in places like Montreal during the pandemic.
“Police officers will start by trying to disperse the gatherings, but if people don’t co-operate, fines can be given,” he said.
Legault said people from red zones cannot travel to orange zones to eat in a restaurant or gather in a home. They will face fines if they do.
He said restaurants will not be required to verify residency, but police can issue a ticket if they catch people violating the rules.
People should not travel between regions to pick up groceries or run similar errands, Legault said. People can go to their cottage, for example, as long as they bring their provisions with them.
The new restrictions take effect 12:01 a.m. ET on Thursday and are set to last for 28 days, until Oct. 28, in the red zones. The restrictions are:
A ban on home gatherings, with some exceptions, such as a single caregiver, babysitter, tradesperson or technician, allowed per visit.
All bars and casinos are closed. Restaurants can offer only takeout.
Museums, cinemas and theatres are closed.
Being less than two metres apart will be prohibited. Masks will be mandatory during demonstrations.
Houses of worship and venues for events, such as funerals and weddings, will have a 25-person limit.
Hair salons, hotels and other such businesses will stay open.
Schools will remain open.
What is the Emergency Requiring Virtual Quarantine of Healthy People?
Each Friday the Quebec health research institute (INESSS) provides a statistical update of the Covid19 situation with projections regarding the key concern: Capacity of the system to care for actual Covid cases requiring in-hospital treatment. Here is the latest information.
On the left is the history of Covid hospitalizations in Quebec to end of September. Note that presently there about 20 people per day are admitted to hospital with Covid19. As of Oct. 1, Quebec reported 276 people in hospital (including 46 in ICU) out of covid bed capacity of 1750. If the 20/day new admissions rate since July 1 continued, and assuming an average length of stay of 12 days, the net of covid beds occupied should not increase and more likely would go down. So the projections on the right side have a wide range, but even with an upward bias, the capacity is not reached. And as the lower right shows, ICU capacity is even less likely to be overwhelmed.
In Quebec, the hospitalization rate for COVID-19 patients has dropped sharply since the beginning of the pandemic. During the first wave, about 13 per cent of cases ended up in hospital. From Aug. 10 to Sept. 6, the rate was just 5 per cent. At a technical briefing on Wednesday, researchers and officials from Quebec’s institute of excellence in health and social services (INESSS) projected that the rate for COVID-19 patients in early September would fall again to 3.8 per cent.
The drop can be explained by the relative youth of Quebeckers contracting the virus in its second wave and their relative lack of comorbidities. By contrast, in the spring, the virus tore through long-term care homes in the province, killing 4,914 elderly residents.
As a result of this shift, Quebec will not exceed its hospital capacity of about 2,000 beds in the next four weeks, according to the INESSS projections. But officials warned that a faster spread of the virus caused by careless behaviour could still put pressure on the health care system.
Above is the outlook for October from INESSS. For both ICU and covid hospital beds observations are tracking a forecast showing slight increases. It appears that the precautionary principle is being applied without regard for the costs of locking down: social, economic and personal well-being seem not to be part of the equation.
Quebec Situation Update October 1, 2020
Note that testing has quadrupled since July and the number of new cases followed, especially in the last month. Meanwhile daily deaths are unchanged at less than five a day, compared to Quebec losing 186 lives every day from all causes.. Recoveries are not reported to the public, perhaps due to the large number of people testing positive but without symptoms or only mild illness and no professional treatment. The graph below estimates recoveries assuming that people not dying 28 days after a positive test can be counted as cured or in recovery.
Recoveries are the number of people testing positive (misleadingly termed “cases”) minus deaths 28 days later. Obviously, the death rate was high early on, and now is barely visible. Meanwhile the Positivity rate (% of people testing positive out of all subjects) went down to 1% for several months before rising recently. Since there is a lag of 28 days, we don’t yet see the outcome of the rise in positives along with the increased testing.
Summary
Premier Legault and his medical advisors had done well up to now. The first goal was to prevent deaths, and that has been achieved. 186 Quebecers die every day from all causes, and now about 5 are dying having tested positive for SARS CV2. The other goal was to prevent overwhelming the health care system with Covid cases. This too is under control. On October 1, there were 276 patients hospitalized with covid, including 46 in ICUs. The capacity is 1750 beds and 370 ICU beds. Since July there have been about 20 new admissions daily, offset by recoveries released from hospital.
Unfortunately, now the authorities have spooked themselves and applied a lockdown at the wrong time. Their goal has shifted to stopping new positives, which have increased because testing has quadrupled and positivity rates gone up from 1% to 5%. These are younger people who are not getting sick and certainly not dying from the virus. As many epidemiologists have said, you won’t get rid of this virus, you live with it by getting herd immunity, which leaves too few susceptible people for the virus to spread. If you kill off all the PME businesses and put people out of work, poverty and social decay will kill people, not to mention the interruption of medical treatments which save those with the real deadly diseases: cancers, heart, arteries, lungs, and so on.
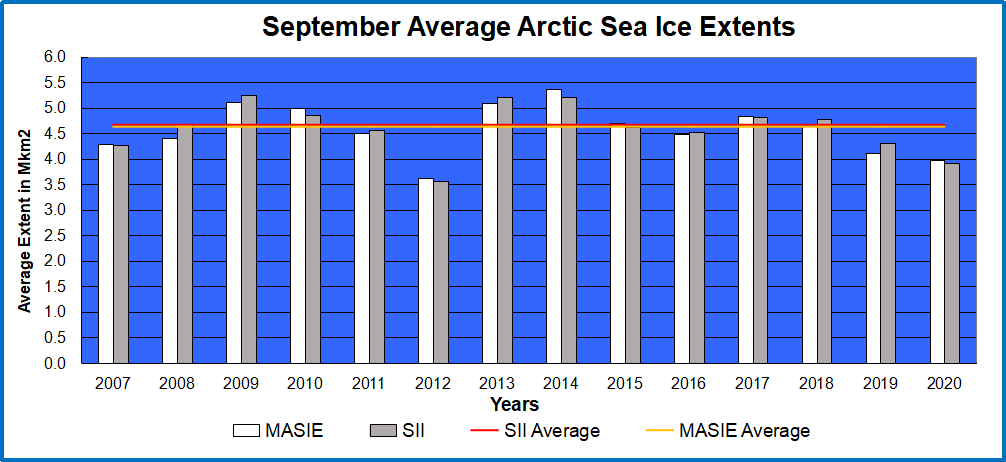
Just like the Arizona road in the image, Arctic ice extent has dipped in September and is on the rise again. The graph below shows how September monthly extent averages compare for the years since 2007.
Overall it resembles the Arizona roadway. Two low years are followed by two high years, then two low years and so on. The last two years are low, comparable to 2007, and may portend higher ice extent ahead. As usual MASIE and SII are showing for 2020 nearly the same monthly averages, 4.0M km2 for MASIE and 3.9M km2 for SII. The graph below shows how the ice dipped and recovered in 2020 compared to the 13-year average and some notable years.
September 2020 daily minimum was lower than all previous years except for 2012. As noted previously this year’s anomaly was the hot Siberian summer melting out the Eurasian shelf seas and the bordering parts of the Central Arctic Sea. In 2012 it was the Great Arctic Cyclone in August of that year. After day 255, ice recovered strongly in 2020 ending the month higher than 2007, close to 2019 and about 150k km2 less than the average daily minimum on day 260, 4.4M km2
The table shows monthly extent averages for the regions with ice in September for several years and the 13-year average for each region.
Sept. Monthly Averages
2007
2012
2019
2020
Average
SD %
(0) Northern_Hemisphere
4286957
3622648
4124035
3969085
4630779
10%
(1) Beaufort_Sea
558424
212051
382779
620409
487498
31%
(2) Chukchi_Sea
49690
52539
111412
77598
172143
53%
(3) East_Siberian_Sea
1251
53411
73023
121408
287777
63%
(4) Laptev_Sea
246278
44336
87121
28
141604
81%
(5) Kara_Sea
49502
717
166
13063
24612
102%
(6) Barents_Sea
6782
0
13238
0
18757
183%
(7) Greenland_Sea
334147
263899
173116
235216
197263
33%
(8) Baffin_Bay_Gulf_of_St._Lawrence
33043
15591
16589
20361
32926
50%
(9) Canadian_Archipelago
252140
198502
265335
339996
299817
30%
(10) Hudson_Bay
10998
9502
0
2783
7947
135%
(11) Central_Arctic
2743433
2771014
3000459
2537271
2959458
6%
The last column shows the Standard Deviation % for each region and for NH as a whole. Over this period the NH fluctuations have been +/- 10%. The most variable is Barents Sea, which can be zero or over 100k km2. Hudson Bay and Kara likewise either melt out or retain significant ice. The Central Arctic varies little from year to year.
Illustration by Eleanor Lutz shows Earth’s seasonal climate changes. If played in full screen, the four corners present views from top, bottom and sides. It is a visual representation of scientific datasets measuring Arctic ice extents.