The images above come from MASIE showing ice extents on day 260, the lowest daily extent on average the last 14 years. Note that 2012 was the lowest in this period and 2021 is now the highest, surpassing 2014. The abundance of ice this year contrasts with both 2007 and 2020. Clearly, the location of remaining ice in September varies greatly from year to year. The marginal seas are open water, including the Pacific basins, Canadian Bays (Hudson and Baffin), and the Atlantic basins for the most part. As discussed later on, other regions retain considerable ice at the annual minimum, with differences year to year.
The annual competition between ice and water in the Arctic ocean is now at the maximum for water, which typically occurs mid September. After that, diminishing energy from the slowly setting sun allows oceanic cooling causing ice to regenerate. Those interested in the dynamics of Arctic sea ice can read numerous posts here. This post provides a look at September from 2007 to yesterday as a context for understanding this year’s annual minimum. Note that for climate purposes the annual minimum is measured by the September monthly average ice extent, since the daily extents vary and will go briefly lowest on or about day 260. In a typical year the overall ice extent will end September slightly higher than at the beginning.
The melting season in September up to yesterday shows 2021 melted much less than average and so day 260 extents are much higher than average.
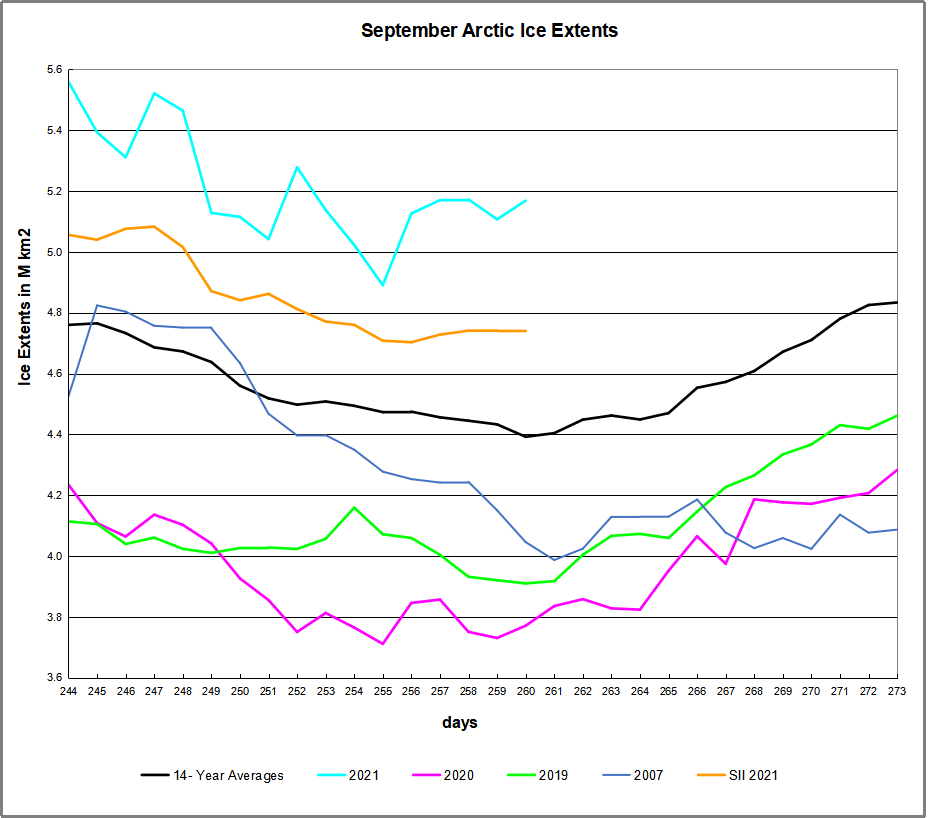
2021 ice extents begin September 800k km2 above the 14-year average and on day 260 remained 776k km2 higher. SII was lower than MASIE by 427k km2. The table for day 260 shows how large are the 2021 surpluses and how the ice is distributed across the various seas comprising the Arctic Ocean. The surplus this year over 2007 is more than 1 Wadham (1M km2).
| Region | 2021260 | Day 260 Average | 2021-Ave. | 2007260 | 2021-2007 |
| (0) Northern_Hemisphere | 5168253 | 4392025 | 776228 | 4045776 | 1122477 |
| (1) Beaufort_Sea | 715340 | 463613 | 251727 | 481384 | 233956 |
| (2) Chukchi_Sea | 493208 | 132989 | 360219 | 22527 | 470681 |
| (3) East_Siberian_Sea | 338189 | 248694 | 89495 | 311 | 337878 |
| (4) Laptev_Sea | 32974 | 114492 | -81518 | 235869 | -202895 |
| (5) Kara_Sea | 95956 | 17336 | 78619 | 44067 | 51888 |
| (6) Barents_Sea | 18 | 18201 | -18183 | 7420 | -7402 |
| (7) Greenland_Sea | 50718 | 192388 | -141670 | 333181 | -282463 |
| (8) Baffin_Bay_Gulf_of_St._Lawrence | 35493 | 28885 | 6609 | 26703 | 8791 |
| (9) Canadian_Archipelago | 452857 | 270948 | 181909 | 225526 | 227331 |
| (10) Hudson_Bay | 4504 | 5318 | -814 | 2270 | 2233 |
| (11) Central_Arctic | 2948362 | 2898150 | 50213 | 2665244 | 283118 |
The main deficits to average are in Laptev and Greenland Seas, overwhelmed by surpluses almost everywhere, especially in BCE (Beaufort, Chukchi, East Siberian seas), Kara and Canadian Archipelago. And as discussed below, the marginal basins have little ice left to lose.
The Bigger Picture
We are close to the annual Arctic ice extent minimum, which typically occurs on or about day 260 (mid September). Some take any year’s slightly lower minimum as proof that Arctic ice is dying, but the image above shows the Arctic heart is beating clear and strong.
Over this decade, the Arctic ice minimum has not declined, but since 2007 looks like fluctuations around a plateau. By mid-September, all the peripheral seas have turned to water, and the residual ice shows up in a few places. The table below indicates where ice is found in September. Numbers are area units of Mkm2 (millions of square kilometers).
| Day 260 | 14 year | ||||||||||
| Arctic Regions | 2007 | 2010 | 2012 | 2014 | 2015 | 2017 | 2018 | 2019 | 2020 | 2021 | Average |
| Central Arctic Sea | 2.67 | 3.16 | 2.64 | 2.98 | 2.93 | 3.07 | 2.91 | 2.97 | 2.50 | 2.95 | 2.90 |
| BCE | 0.50 | 1.08 | 0.31 | 1.38 | 0.89 | 0.84 | 1.16 | 0.46 | 0.65 | 1.55 | 0.89 |
| LKB | 0.29 | 0.24 | 0.02 | 0.19 | 0.05 | 0.26 | 0.02 | 0.11 | 0.01 | 0.13 | 0.16 |
| Greenland & CAA | 0.56 | 0.41 | 0.41 | 0.55 | 0.46 | 0.52 | 0.41 | 0.36 | 0.59 | 0.50 | 0.46 |
| B&H Bays | 0.03 | 0.03 | 0.02 | 0.02 | 0.10 | 0.07 | 0.05 | 0.01 | 0.02 | 0.04 | 0.04 |
| NH Total | 4.05 | 4.91 | 3.40 | 5.13 | 4.44 | 4.76 | 4.56 | 3.91 | 3.77 | 5.17 | 4.48 |
The table includes some early years of note along with the last 5 years compared to the 14 year average for five contiguous arctic regions. BCE (Beaufort, Chukchi and East Siberian) on the Asian side are quite variable as the largest source of ice other than the Central Arctic itself. Greenland Sea and CAA (Canadian Arctic Archipelago) together hold almost 0.5M km2 of ice at annual minimum, fairly consistently. LKB are the European seas of Laptev, Kara and Barents, a smaller source of ice, but a difference maker some years, as Laptev was in 2016. Baffin and Hudson Bays are inconsequential as of day 260.
2021 stands out from lower ice years by the higher extents in Central Arctic, BCE and LKB, especially Kara Sea this year.

Resources: Climate Compilation II Arctic Sea Ice


Reblogged this on Climate Collections.
LikeLike
Where is “global warming”?
LikeLiked by 1 person
Paulo, see
https://rclutz.com/2021/05/08/adios-global-warming/
LikeLike
Reblogged this on Climatism and commented:
Paging… jOe biDeN… ?
LikeLike