A previous post reported that Arctic Sea Ice has persisted this year despite a wavy Polar Vortex this spring, bringing cold down to mid-latitudes, and warming air into Arctic regions. Now in June, after tracking in deficit the sea ice extent is matching the 14-year average on day 159. Note that SII (Sea Ice Index) since mid-May has been showing 200 to 400k km2 more ice than MASIE, and currently the two datasets have converged on a value of ~11.25 M km2.
Note that on the 14-year average, during this period ~1.7M km2 of ice extent is lost, which 2021 is matching, as did 2007. Both 2020 and 2019 were much lower than average at this date, by ~600k and ~700k respectively.
Why is this important? All the claims of global climate emergency depend on dangerously higher temperatures, lower sea ice, and rising sea levels. The lack of additional warming is documented in a post Adios, Global Warming
Counting the dead used to be the work of epidemiologists, statisticians and demographers. So was analyzing the numbers and drawing conclusions. In the past year many are counting deaths, but the numbers have no meaning without the context of a relevant time period, population and history. That is, epidemiology.
The most counted country is probably Sweden, a stubborn dissenter that refused lockdowns, mask mandates and contact tracing. By the time of this writing, 14,349 Swedes have reportedly died from the coronavirus.
Has the Swedish model failed? Were the lockdowns justified? Were the economic and social upheavals in most of the world an unavoidable necessity?
The answer to all is a resounding no. The first (and not the only) witness: Sweden. To understand the testimony, we need to learn only two concepts: “flu year” and “excess mortality”.
“Flu year” versus calendar year
Many calculate mortality statistics according to the Gregorian calendar, but December 31st is not a meaningful end date for winter mortality in the northern hemisphere. The flu wave and the associated wave of mortality reach the peak at various dates, and sometimes secondary waves appear. Furthermore, the use of the Gregorian calendar combines the mortality in the first part of one winter (sometimes mild) with mortality in the second part of the previous winter (sometimes severe). There is no scientific justification for this grouping when analyzing historical trends.
The statistical alternative, which may be called “flu year”, contains a full winter season.Annual mortality is calculated from the beginning of the flu season, which is usually counted from week 40 (early October), till week 39 in the following year (end of September). Thus, the coronavirus waves in the spring and summer of 2020 belong to the 2019–2020 flu year, whereas the last winter wave belongs to the current flu year which will end in September.
Excess mortality
The concept of “excess mortality” is a little abstract. We need to compare actual mortality with “expected mortality”, but the latter is a theoretical idea that cannot be verified: what would the mortality in the 2019–2020 flu year have been, had there not been a pandemic? How do we calculate “expected mortality”?
One method uses a statistical model called linear regression. We fit a line to the mortality data from previous years, check its past performance, and use the continuation of the line to compute expected mortality. The distance between a data point of actual mortality and expected mortality on the line is excess mortality (or “mortality deficit”).
Mortality in Sweden by flu year
The graph shows the annual mortality in Sweden per million people in the last 22 flu years, where each flu year is labeled according to the calendar year in which it ends. For example, the last data point on the graph is mortality between October 2019 and September 2020: 9,234 per million people (95,365 deaths). To magnify, the vertical axis starts at 7,000. Source: SCB.SE
It is easy to see that the points are located close to a straight line, until the flu year that ended in September 2018. The general downward trend reflects a consistent increase in life expectancy in Sweden for many years.
Experienced data analysts will attest that the fluctuations around the line are generally small and expected until 2018 (explained variation: 0.96). In contrast, both the flu year that preceded the pandemic (2018–2019) and the pandemic year (2019–2020) substantially deviate from the line: the former — in lower than expected mortality, and the latter — in higher than expected mortality.
Excess mortality in Sweden in flu year 2019–2020
Continuation of the line, which was fit by the statistical model, yields the following estimates: In 2018–2019 there was “mortality deficit” in Sweden of 300 per million people (-3.3%) whereas in 2019–2020, the pandemic year, there was excess mortality of 364 per million people (+4.1%). Excess mortality following mortality deficit, and vice versa, are well known and expected, as the main source of mortality is an elderly population with limited life expectancy. (The sequence “excess after deficit” is, of course, better than the reverse order.)
Assuming the excess mortality in 2019–2020 “fully balanced” the mortality deficit in the previous flu year, the true excess mortality in Sweden was less than 1% (about 700 deaths). And if we assume, absurdly, that the mortality in 2019–2020 was not affected at all by the mortality deficit in the previous flu year, then the excess mortality in Sweden did not exceed 4.1% (about 3,800 deaths). Excess mortality of a few percentage points, or more, has been calculated in many countries where life has been severely disrupted. Part of that excess has been attributed to lockdown and panic.
To remind us, the hysterical response to the pandemic was not due to fear of an excess annual mortality of 4% or even 10%. The apocalyptic forecasts, which caused the world to shut down, predicted about 90,000 deaths from the coronavirus in Sweden by the summer of 2020: 100% excess mortality! No wonder policy makers around the world prefer to forget those predictions.
Mortality in Sweden in the current flu year
The final summary of the current flu year (October 2020 — September 2021) will be known in the fall, but the data accumulated more than halfway through allow for interim conclusions. As many know, the coronavirus replaced the flu viruses this year, and there was no flu in Sweden, either. Nor were there apocalyptic predictions; only warnings about the number of accumulated deaths.
I chose to compare the mortality in Sweden in the current flu year (week 40, 2020 till week 15, 2021) to the corresponding mortality in 2017–2018. Two reasons for this choice: First, Europe experienced a severe flu season in that winter, which makes it an appropriate comparison. Second, although the flu season was severe in Sweden compared to previous years, it was still substantially milder than in Europe as a whole.
The graph shows a low mortality wave at the end of 2017 and a noticeable wave in February-March 2018 (another example of why a December 31st cutoff might distort historical trends). This winter, the mortality wave coincided with the coronavirus wave and its peak in late December. (In 2020 there were 53 weeks, so the dates do not exactly match.) A secondary coronavirus wave, which appeared in mid-February, half way through the decline of the former, did not result in a secondary mortality wave.
The all-cause death toll in Sweden in the first 29 weeks of the current flu year is 56,452 (5,441 per million people) compared to 55,967 (5,544 per million people) in the same period in 2017–2018. In that winter, the excess mortality rate in Europe attributed to the flu was at least twice as high as in Sweden.
Sweden proved right in the retest.
A colossal mistake
The pandemic has taken its death toll, ranging from large to small in different countries and within countries, and mostly affected the frail elderly. But the lockdowns and panic were unsubstantiated, prevented nothing, and caused indescribable damage to society. Sweden’s statistics tell us, unequivocally, that in much of the world lives have been lost and livelihoods have been destroyed — in vain.
Will anyone, in any country, be held accountable?
Eyal Shahar,
Professor Emeritus of Public Health (University of Arizona); MD (Tel-Aviv University, Israel); MPH, Epidemiology (University of Minnesota)
Another school year has come to a close at colleges and universities across the country, but before the class of 2021 turned the tassel to begin their journey as new graduates, they were given some sage – and in some cases, pretty strange – advice by leading politicians, academics, diplomats, and captains of industry. You may have missed most of this year’s most notable commencement addresses, so AMAC Newsline has compiled the highlights–and the lowlights–of this year’s speeches.
“The Biggest Risk Of All Is That We Stop Taking Risks At All”
Former Republican Governor of Indiana Mitch Daniels and current President of Purdue University gave perhaps the best commencement address of the season. Daniels discussed how, during the past year, America had witnessed not only a public health pandemic but also a pandemic of fear that had paralyzed America’s leaders and caused them to flinch in the face of making difficult decisions. Daniels challenged his Boilermakers to have “the courage to act on the conclusions you reach.” Here are some of the best parts of the speech:
“The risk of failure, of a hit to one’s reputation, or just that the gains don’t outweigh the costs, all these can deter or even paralyze a person out of fulfilling the responsibility someone has entrusted to them.”
“This last year, many of your elders failed this fundamental test of leadership. They let their understandable human fear of uncertainty overcome their duty to balance all the interests they were responsible for. They hid behind the advice of experts in one field but ignored the warnings of experts in other realms that they might do harm beyond the good they hoped to accomplish. Sometimes they let what might be termed the mad pursuit of zero, in this case, zero risks of anyone contracting the virus, block out other competing concerns, like the protection of mental health, the educational needs of small children, or the survival of small businesses. Pursuing one goal to the utter exclusion of all others is not to make a choice but to run from it. It’s not leadership; it’s abdication.”
“Maybe the great historian Jacques Barzun summed it up best: ‘The last degree of caution is cowardice.’ Certainty is an illusion. Perfect safety is a mirage. Zero is always unattainable, except in the case of absolute zero where, as you remember, all motion and life itself stop.”
“Your Most Important Titles Will Be Wife, Husband, Mother, Father, Follower Of Christ.”
Former Secretary of State Mike Pompeo gave an inspirational commencement address to students at Regent University in Virginia. What set Pompeo’s speech apart from others was the fact that it challenged the class of 2021 to put faith and family at the center of their career rather than just purely professional accolades and material accomplishments.
“You should all know that life will offer you lots of ways to use your talents, your education, industry, your intelligence to achieve personal success, how you define it, in your chosen life, in your chosen professions. And it will also offer you chances to know a far more lasting happiness by serving someone far greater than yourself or your self-interest – your God.”
“Our country must remember that no one can enjoy the pursuit of happiness if you cannot own the fruits of your own labor. And no society can retain its legitimacy or a virtuous character without religious freedom.”
“We must cherish our freedom, particularly this freedom to practice our faith, not just for the opportunities it provides to each of us, but for the goodness of living a life in accordance with God without oppression that it makes possible. And when government oppresses that freedom, we must stand up. Each of you have that responsibility. It is a big burden.”
“Our Goal Is An Independent Mind, In The Service Of Truth Instead Of Fads Or Groupthink.”
Joe Biden was originally supposed to speak at the University of Notre Dame in South Bend, Indiana. But Biden snubbed the Catholic school, apparently choosing to stay away from Notre Dame after more than 4,400 Notre Dame students and alumni wrote a letter noting that Mr. Biden had embraced “the most pro-abortion and anti-religious liberty public policy program in history.”
Instead, Jimmy Dunne gave the commencement address to Notre Dame graduates. Dunne works for an investment company that was once located on the 104th floor of 2 World Trade Center. Many of the company’s employees died on 9/11, but Dunne has worked tirelessly to help the sons and daughters of his former coworkers get the scholarships they need to attend colleges across the country, including Notre Dame.
In an emotional speech, Dunne showed the moral courage to say the things that every college student needs to hear, but no one would ever hear in a commencement address delivered by Mr. Biden. Dunne asserted that the real purpose of education is to teach about the “permanent things” to build “character, not just knowledge, moral aspiration, not just ambition.” Dunne appeared to call out cancel culture and woke college campuses as “fads” and “groupthink.” Dunne concluded his remarks with a memorable line calling out Joe Biden for not showing up. He said: “It almost makes me feel bad for the President, because he missed this wonderful sight of a graduating class as promising as any in America.”
“The mark of a great university is that you learn more than they’re teaching. Here, we talk about forming ‘the whole person,’ and it’s a true commitment grounded in real things, permanent things. The aim is character, not just knowledge, moral aspiration, not just ambition. You’ve all got degrees in different disciplines, but you have a single major in common – and that is leadership. The fashions that wash over higher education don’t get far at this university. Our goal is an independent mind, in the service of truth instead of fads or groupthink. The great problems and moral obligations of life are not suddenly discovered here. Those obligations have been the core purpose from the start.”
“You are a quiet — you’re a really dull class. I mean, come on, man. Is the sun getting to you?”
Joe Biden gave what was easily the worst commencement address of any U.S. President in recent memory to cadets at the Coast Guard Academy. Biden started the speech by asserting: “[W]e’re going to speak for about four hours” and “I thought I was hot in a blue suit.” Biden mispronounced the name of a distinguished cadet, butchered a reference to a cadet handbook, and quoted a Chinese dictator.
On two occasions, Biden asked that the cadets clap for him. Early on, Biden tried to make a joke by chiding cadets for spending “a little too much time at the Slice,” a local pizza restaurant. But Biden did not get the laughs and applause he wanted, so he instructed the cadets: “You can clap. Come on, man.” On another occasion, Biden again demanded applause: “Congratulations the Bravo Company, by the way, on your victory. You can clap. It’s okay. Even if you’re lost, you gotta clap.”
The worst moment of the speech, though, occurred when Biden tried to tell a joke about the Navy that fell totally flat. Instead of just moving on, the man who is supposed to be America’s commander in chief directly insulted the very people who have pledged to fight and, if necessary, die to keep America safe. The actual White House transcript records Biden as saying: “You are a quiet — you’re a really dull class. I mean, come on, man. Is the sun getting to you? I would think you’d have an opportunity when I say that about the Navy to clap, but — but being here together.”
“Just Ask Any Marine Today, Would She Rather Carry 20 Pounds Of Batteries Or A Rolled Up Solar Panel, and I am positive she will tell you a solar panel, and so would he.”
Kamala Harris followed up Biden’s brutally bad commencement speech with a woke dud of her own. Harris, addressing graduates at the Naval Academy, showed where the Biden administration’s priorities truly are in terms of national defense when she asserted that “climate change” is a “very real threat to our national security.” Harris never once mentioned China, Russia, Iran, North Korea, or any of the other “real threats” to American national security during the course of her remarks. On the topic of climate change, Harris’s comments were laughable but not in the way Harris intended them to be. She told the Navy midshipmen and Marines:
“You are ocean engineers who will help navigate ships through thinning ice. You are mechanical engineers who will help reinforce sinking bases. You are electrical engineers who will soon help convert solar and wind energy into power, convert solar and wind energy into combat power. And just ask any Marine today, would she rather carry 20 pounds of batteries or a rolled up solar panel, and I am positive she will tell you a solar panel, and so would he.”
But, solar panels store energy in batteries. The Marine, regardless of gender, will still have to carry a battery along with the solar panel. That technicality aside, these bizarre remarks were delivered by Harris as part of a commencement address on Memorial Day weekend. The sacrifices that Navy midshipmen have made for this country throughout history were never mentioned during the course of the remarks. Rather, Harris sounded like she had shown up to give a speech at the National Resources Defense Council instead of the U.S. Naval Academy. She used her time to issue veiled threats like, “One country’s carbon emissions can threaten the sustainability of the whole earth.” The likelihood that Navy graduates can actually learn something from such statements that will help them as they defend this country is doubtful at best, which is why this commencement address earns last place for the 2021 season.
A recent paper employed expert statistical analysis to prove that currently climate models fail to reproduce fluctuations of sea surface temperatures in the North Atlantic, a key region affecting global weather and climate. H/T to David Whitehouse at GWPF for posting a revew of the paper. I agree with him that the analysis looks solid and the findings robust. However, as I will show below, neither Whitehouse nor the paper explicitly drew the most important implication.
A new paper by Timothy DelSole of George Mason University and Michael Tippett of Columbia University looks into this by attempting to quantify the consistency between climate models and observations using a novel statistical approach. It involves using a multivariate statistical framework whose usefulness has been demonstrated in other fields such as economics and statistics. Technically, they are asking if two time series such as observations and climate model output come from the same statistical source.
To do this they looked at the surface temperature of the North Atlantic which is variable over decadal timescales. The reason for this variability is disputed, it could be related to human-induced climate change or natural variability. If it is internal variability but falsely accredited to human influences then it could lead over estimates of climate sensitivity. There is also the view that the variability is due to anthropogenic aerosols with internal variability playing a weak role but it has been found that models that use external forcing produce inconsistencies in such things as the pattern of temperature and ocean salinity. These things considered it’s important to investigate if climate models are doing well in accounting for variability in the region as the North Atlantic is often used as a test of a climate model’s capability.
The researchers found that when compared to observations, almost every CMIP5 model fails, no matter whether the multidecadal variability is assumed to be forced or internal. They also found institutional bias in that output from the same model, or from models from the same institution, tended to be clustered together, and in many cases differ significantly from other clusters produced by other institutions. Overall only a few climate models out of three dozen considered were found to be consistent with the observations.
We now apply our test tocompare North Atlantic sea surface temperature (NASST) variability between models and observations. In particular, we focus on comparing multi-year internal variability. The question arises as to how to extract internal variability from observations. There is considerable debate about the magnitude of forced variability in this region, particularly the contribution due to anthropogenic aerosols (Booth et al., 2012; Zhang et al., 2013). Accordingly, we consider two possibilities: that the forced response is well represented by (1) a second-order polynomial or (2) a ninth-order polynomial over 1854-2018. These two assumptions will be justified shortly.
If NASST were represented on a typical 1◦ × 1◦ grid, then the number of grid cells would far exceed the available sample size. Accordingly, some form of dimension reduction is necessary. Given our focus on multi-year predictability, we consider only large-scale patterns. Accordingly, we project annual-mean NASST onto the leading eigenvectors of the Laplacian over the Atlantic between 0 0 60◦N. These eigenvectors form an orthogonal set of patterns that can be ordered by a measure of length scale from largest to smallest.
Figure 1. Laplacian eigenvectors 1,2,3,4,5,6 over the North Atlantic between the equator and 60◦N, where dark red and dark blue indicate extreme positive and negative values, respectively
The first six Laplacian eigenvectors are shown in fig. 1 (these were computed by the method of DelSole and Tippett, 2015). The first eigenvector is spatially uniform. Projecting data onto the first Laplacian eigenvector is equivalent to taking the area-weighted average in the basin. In the case of SST, the time series for the first Laplacian eigenvector is merely an AMV index (AMV stands for “Atlantic Multidecadal Variability”). The second and third eigenvectors are dipoles that measure the large-scale gradient across the basin. Subsequent eigenvectors capture smaller scale patterns. For model data, we use pre-industrial control simulations of SST from phase 5 of the Coupled Model Intercomparison Project (CMIP5 Taylor et al., 2012). Control simulations use forcings that repeat year after year. As a result, interannual variability in control simulations come from internal dynamical mechanisms, not from external forcing.
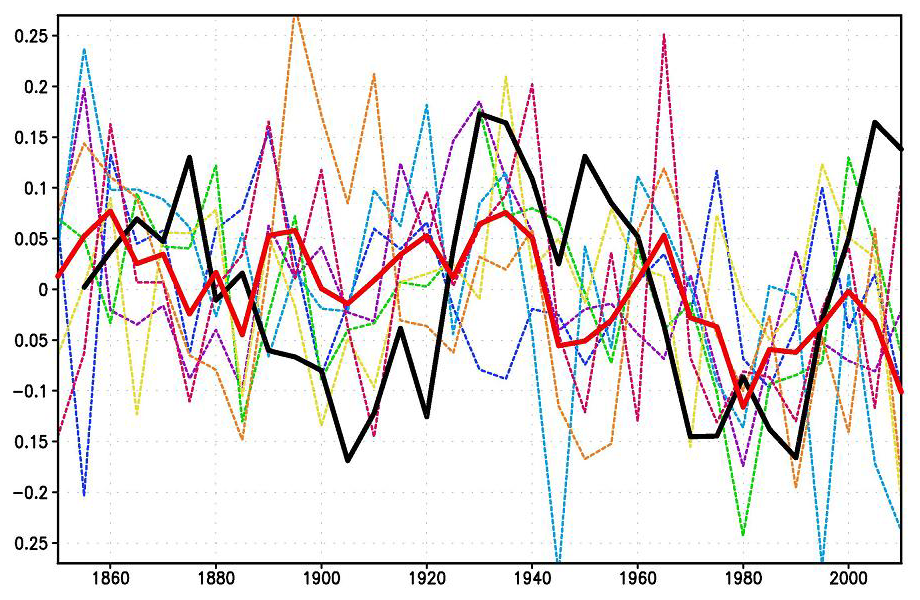
Figure 2. AMV index from ERSSTv5 (thin grey), and polynomial fits to a second-order (thick black) and ninth-order (red) polynomial.
For observational data, we use version 5 of the Extended Reconstructed SST dataset (ERSSTv5 Huang et al., 2017). We consider only the 165-year period 1854-2018. We first focus on time series for the first Laplacian eigenvector, which we call the AMV index. The corresponding least squares fit to second- and ninth-order polynomials in time are shown in fig. 2. The second-order polynomial captures the secular trend toward warmer temperatures but otherwise has weak multidecadal variability. In contrast, the ninth-order polynomial captures both the secular trend and multidecadal variability. There is no consensus as to whether this multidecadal variability is internal or forced.
Figure 4. Deviance between ERSSTv5 1854-1935 and 82-year segments from 36 CMIP5 pre-industrial control simulations. Also shown is the deviance between ERSSTv5 1854-1935 and ERSSTv5 1937-2018 (first item on x-axis). The black and red curves show, respectively, results after removing a second- and ninth-order polynomial in time over 1854-2018 before evaluating the deviance. The models have been ordered on the x-axis from smallest to largest deviance after removing a second-order polynomial in time.
Conclusion:
The test was illustrated by using it to compare annual mean North Atlantic SST variability in models and observations. When compared to observations, almost every CMIP5 model differs significantly from ERSST. This conclusion holds regardless of whether a second- or ninth-order polynomial in time is regressed out. Thus, our conclusion does not depend on whether multidecadal NASST variability is assumed to be forced or internal. By applying a hierarchical clustering technique, we showed that time series from the same model, or from models from the same institution, tend to be clustered together, and in many cases differ significantly from other clusters. Our results are consistent with previous claims (Pennell and Reichler, 2011; Knutti et al., 2013) that the effective number of independent models is smaller than the actual number of models in a multi-model ensemble.
The Elephant in the Room
Now let’s consider the interpretation reached by model builders after failing to match observations of Atlantic Multidecadal Variability. As an example consider INMCM4, whose results deviated greatly from the ERSST5 dataset. In 2018, Evgeny Volodin and Andrey Gritsun published Simulation of observed climate changes in 1850–2014 with climate model INM-CM5. Included in those simulations is a report of their attempts to replicate North Atlantic SSTs. Excerpts in italics with my bolds.
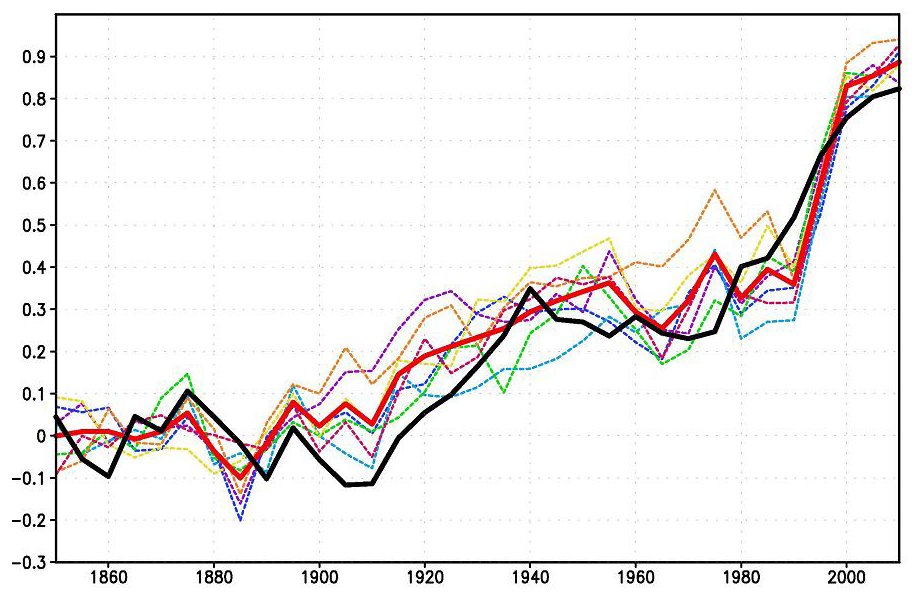
Figure 4 The 5-year mean AMO index (K) for ERSSTv4 data (thick solid black); model mean (thick solid red). Dashed thin lines represent data from individual model runs. Colors correspond to individual runs as in Fig. 1.
Keeping in mind the argument that the GMST slowdown in the beginning of the 21st century could be due to the internal variability of the climate system, let us look at the behavior of the AMO and PDO climate indices. Here we calculated the AMO index in the usual way, as the SST anomaly in the Atlantic at latitudinal band 0–60∘ N minus the anomaly of the GMST. The model and observed 5-year mean AMO index time series are presented in Fig. 4. The well-known oscillation with a period of 60–70 years can be clearly seen in the observations. Among the model runs, only one (dashed purple line) shows oscillation with a period of about 70 years, but without significant maximum near year 2000. In other model runs there is no distinct oscillation with a period of 60–70 years but a period of 20–40 years prevails. As a result none of the seven model trajectories reproduces the behavior of the observed AMO index after year 1950 (including its warm phase at the turn of the 20th and 21st centuries).
One can conclude that anthropogenic forcing is unable to produce any significant impact on the AMO dynamics as its index averaged over seven realization stays around zero within one sigma interval (0.08). Consequently, the AMO dynamics are controlled by the internal variability of the climate system and cannot be predicted in historic experiments. On the other hand, the model can correctly predict GMST changes in 1980–2014 having the wrong phase of the AMO (blue, yellow, orange lines in Figs. 1 and 4).
Figure 1 The 5-year mean GMST (K) anomaly with respect to 1850–1899 for HadCRUTv4 (thick solid black); model mean (thick solid red). Dashed thin lines represent data from individual model runs: 1 – purple, 2 – dark blue, 3 – blue, 4 – green, 5 – yellow, 6 – orange, 7 – magenta. In this and the next figures numbers on the time axis indicate the first year of the 5-year mean.
The Bottom Line
Since the models incorporate AGW in the form of CO2 sensitivity, they are unable to replicate Atlantic Multidecadal Variability. Thus, the logical conclusion is that variability of North Atlantic SSTs is an internal, natural climate factor.
After in recent months crude oil prices have clearly recovered from their COVID-19 slump on steadily increasing demand, Russian Deputy Prime Minister Alexander Novak addressed the much anticipated decision-making at the upcoming OPEC+ conference set for August and the expectation that it will decide to raise output significantly beyond the current pandemic-induced strategy of gradually releasing more barrels into a strengthening oil market.
Novak said in his Thursday remarks at the St Petersburg International Economic Forum that while it remains “premature” to talk about output decisions for August, he affirmed “The current oil price is good enough for Russia,” adding: “Oil prices reflect the balance of supply and demand,” and noted it’s expected the seasonal oil demand will increase in the third quarter of the year. On Wednesday Brent crude futures touched their highest price since September 2019 at $71.99, with the international benchmark gaining 1.6%, following the day prior the benchmark seeing a rise of almost 3%.
Novak confirmed the upcoming OPEC+ conference will address and finalize oil output for August and other months, while stressing that oil prices shooting too high “may force users to switch to other energy sources.”
On that front in particular, he blasted current IEA proposals and a “road map” being pushed which in the end could lead to $200 a barrel oil(!):
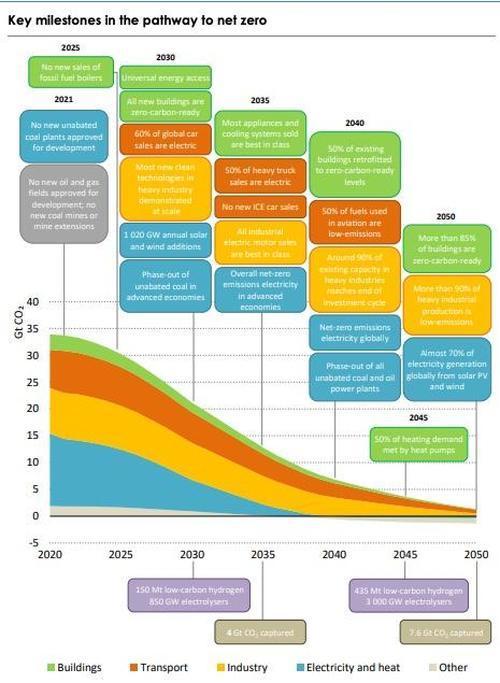
If the world were to follow the International Energy Agency’s controversial road map, which said investment in new fields would have to stop immediately to achieve net-zero carbon emissions by 2050, “the price for oil will go to, what, $200? Gas prices will skyrocket,” Novak said.
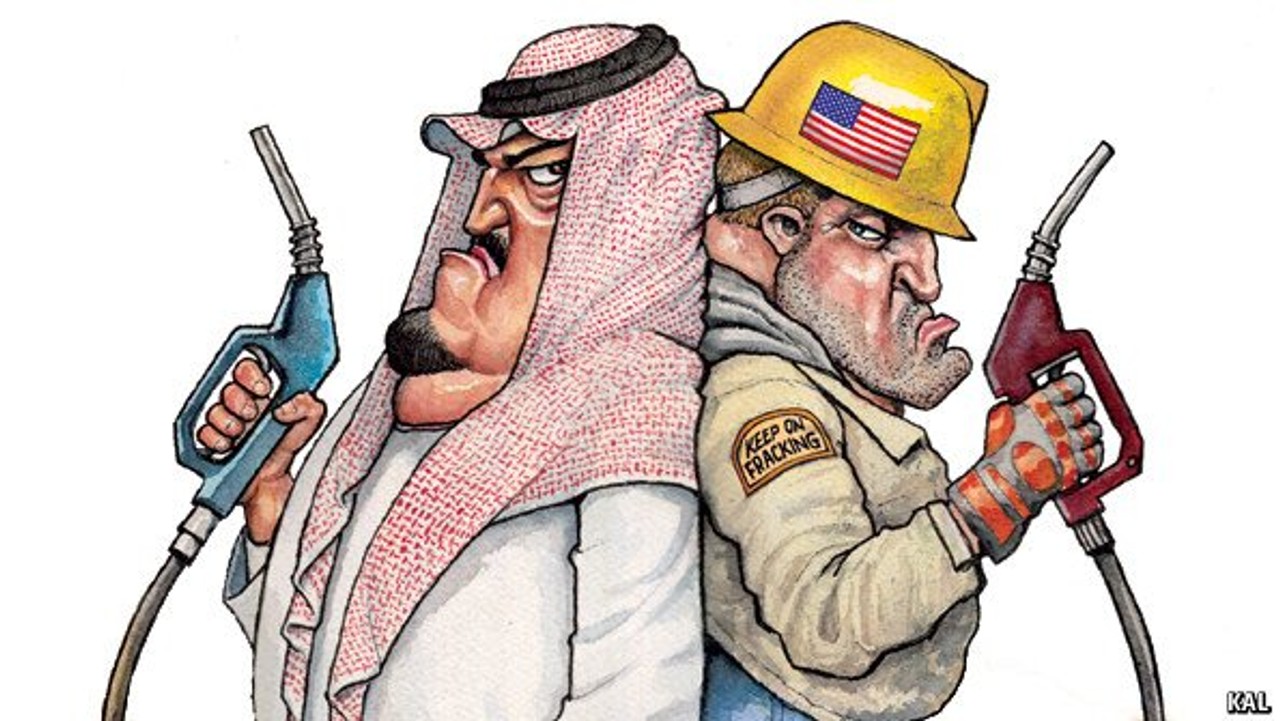
Sheikhs vs. Shale
And naturally Qatar and Saudi Arabia seconded that dire assessment, vowing to continue expanding their oil and gas facilities while pointing the finger at the climate activists for seeking to starve industry cash. Bloomberg presents the Gulf statements Thursday as follows:
The “euphoria” around the transition to clean energy is “dangerous,” Qatar’s Energy Minister Saad Sherida Al Kaabi said at the St Petersburg International Economic Forum in Russia on Thursday.
“When you deprive the business from additional investments, you have big spikes” in prices, he stressed further.
As a reminder, IEA’s roadmap set out in the Paris Accords for achieving net zero carbon emissions by 2050 requires reducing emissions as much as possible then offsetting the rest with “carbon removal” plans financed by carbon credits.
However as we’ve detailed before, with economists expecting global growth to expand at even faster rates thanks to the infusion of stimulus inspired by the pandemic, it follows that energy demand will also increase more quickly. Despite this, many economists and scientists expect that improvements in energy efficiency and the shift to renewables means that global energy demand will be around 8% smaller than it is today in 2050, even though the global economy will be more than twice as large as it is today.
With this in mind, it was perhaps the recent Saudi comments from St. Petersburg which put it best, dismissing the “la-la-land” scenario in an earlier statement…
“Saudi Energy Minister Prince Abdulaziz bin Salman has already dismissed the IEA road map, which would limit the average increase in global temperatures to 1.5 Celsius, calling it a la-la-land scenario,” he said according to Bloomberg. “When asked on Thursday if oil is dead, he responded by saying the kingdom is increasing its production capacity.”
Fifteen Republican State Treasurers sent a warning that they will pull assets from financial institutions if they give in to Federal pressure to de-carbonize and “refuse to lend to or invest in” the fossil fuel and coal industry.
The letter (pdf), led by West Virginia Treasurer Riley Moore, is directed at Special Presidential Envoy for Climate John Kerry. It expresses concerns over reports that Kerry and other members of the Biden administration have been “privately pressuring” U.S. banks to stifle the fossil fuel industry.
“We are writing today to express our deep concern with recent reports that you, and other members of the Biden Administration, are privately pressuring U.S. banks and financial institutions to refuse to lend to or invest in coal, oil, and natural gas companies, as part of a misguided strategy to eliminate the fossil fuel industry in our country,” the letter reads.
The State Treasurers sent a plain message to financial institutions, telling them not to submit to the present administration’s coercion to deny investment and lending for the natural resources.
Furthermore, they assert that the approaches will “discriminate against law-abiding U.S. energy companies and their employees, impede economic growth, and drive up consumer costs,” adding that the strategy in question would make the free market submit to the will of politicians.
The signees of the letter are representing collectively more than $600 billion in assets, according to Axios.
They are backing some of the largest fossil fuel producers in the country.
“As a collective, we strongly oppose command-and-control economic policies that attempt to bend the free market to the political will of government officials,” they write. “It is simply antithetical to our nation’s position as a democracy and a capitalist economy for the Executive Branch to bully corporations into curtailing legal activities. The Biden Administration’s top-down tactics of picking economic winners and losers deprives the real determinate group in our society—the people—of essential choice and agency.
We refuse to allow the federal government to pick our critical industries as losers, based purely on President Biden’s own radical political preferences and ideologies.
The Obama administration’s previous conflict with American coal and natural gas industries is mentioned as an attack on jobs, tax revenue, and health insurance provided to families across the country, specifically hard-working middle-class families.
“As the chief financial officers of our respective states, we entrust banks and financial institutions with billions of our taxpayers’ dollars. It is only logical that we will give significant weight to the fact that an institution engaged in tactics that will harm the people whose money they are handling before entering into or extending any contract,” they warned.
The Epoch Times reached out to the White House for comment.
Todd Blodgett writes at the Des Moines Register Biden paving the way for Trump to win again. (Full disclosure: My mother, Dagmar Henningsen was born near Des Moinres, and I am 1/2 Danish because of her.) Excerpts in italics with my bolds.
Only a smidgeon of popular votes would flip the few states needed for Trump to net 270 electoral votes.
In 2020, had 23,000 votes, spread across Wisconsin, Arizona and Georgia, flipped, the Electoral College would’ve been tied, at 269-269. And with Republicans holding a majority of the states’ congressional delegations, the U.S. House of Representatives would’ve chosen Donald Trump as president.
But after five months, Joe Biden’s agenda and actions on several critical issues are diminishing Democratic prospects for 2024, and even for 2022. If the GOP retakes the House next year, it will be disastrous for the Biden-Harris administration.
But even if that doesn’t happen, the border crisis that Biden singlehandedly created has already caused many of his voters to suffer a severe case of buyers’ remorse. Nixing the Keystone pipeline was stupid and killed tens of thousands of jobs and indicated to oil-producing nations that the United States is impeding domestic petroleum production — which, under Trump’s policies, made us net energy-independent.
Increasingly, many Americans now see that Trump was the kind of president that they always wanted — but they didn’t realize they had.
After all, most Americans appreciate straight talk from their elected officials and distrust career politicians, especially lawyers. Many voters prefer no-nonsense, business-style governance. Most Americans also favor “America First” policies and expect their president to prioritize their interests above those of foreign nationals — particularly lawbreakers. As well, most Americans despise clueless leftists who advocate defunding the police. Polls reveal that most likely voters want presidents to appoint judges who are pro-victim, not pro-perpetrator, and who favor taxpayers over indolent, able-bodied, welfare scammers.
Americans expect their leader to understand that China not only isn’t our friend, but represents a clear and present danger to us.
Trump, not Biden, was that president.
Most taxpayers also strongly oppose Biden’s unprecedented, irresponsible spending spree. Even some Democrats detest Biden’s planned tax hikes and his costly boondoggles, which includes fancy hotels for immigrants, bailouts that discourage employees from returning to work, and paying the disreputable World Health Organization $200 million to reinstate America’s membership. Biden’s absurd claim that Trump caused this border disaster only exacerbates the scorn which scores of millions of Americans have for this liar.
Biden even released Mexico from its agreement — negotiated by Trump — to post federales (troops) on Mexico’s side of the border, to block border-crashing immigrants. As the Washington Post reported on May 25: “Under new Biden administration rules curtailing immigration enforcement, ICE carried out 3,000 deportations last month, the lowest level on record. Biden has placed ICE deportation officers on a leash so tight that some say their work is being functionally abolished.”
As Biden and Kamala Harris foment this destructive insanity, many pro-USA citizens justifiably feel like horrified, handcuffed, blindfolded passengers in the back seat of a vehicle being driven by a drunkard at 100 mph. When Ronald Reagan visited Des Moines in the fall of 1980, he told me that his opponent, President Jimmy Carter, made it “easy” for him, “because of how badly he’s screwed things up.” Will Biden do the same?
Trump will be the same age (78) in 2024 that Biden is now. However, Trump moves, acts, and looks 15 years younger than Biden — who, in 2024, will be 82. By 2024, old Joe could easily look like Jimmy Carter. If so, his predecessor may well become his successor. Only a smidgeon of popular votes would flip the few states needed for Trump to net 270 electoral votes.
Biden is basically setting the stage for Trump’s comeback.
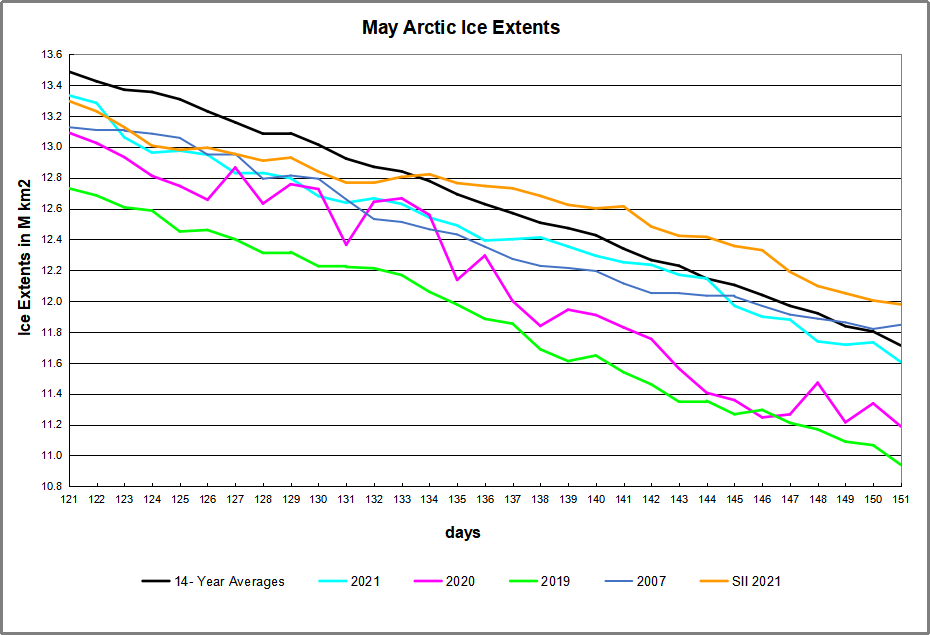
A previous post reported that Arctic Sea Ice has persisted this year despite a wavy Polar Vortex this spring, bringing cold down to mid-latitudes, and warming air into Arctic regions. Now in May, the sea ice extent matched the 14-year average on day 144, tracking alongside until month end. Surprisingly SII (Sea Ice Index) is showing ~400k km2 more ice, which is also ~70k km2 higher than the 14-year average for SII on day 151 (not shown in chart).
Note that on the 14-year average, May loses ~2M km2 of ice extent, which 2021 matched, as did 2007. Both 2020 and 2019 finished lower than average, by 300k and 400k respectively. In contrast SII shows a May loss of only 1.3M km2.
Why is this important? All the claims of global climate emergency depend on dangerously higher temperatures, lower sea ice, and rising sea levels. The lack of additional warming is documented in a post Adios, Global Warming
The table below shows the distribution of Sea Ice across the Arctic Regions, on average, this year and 2007.
Region
2021151
Day 151 Average
2021-Ave.
2007151
2021-2007
(0) Northern_Hemisphere
11605537
11733260
-127723
11846659
-241122
(1) Beaufort_Sea
1034779
992955
41825
1059461
-24682
(2) Chukchi_Sea
900868
861978
38891
894617
6251
(3) East_Siberian_Sea
1051959
1065828
-13869
1069198
-17239
(4) Laptev_Sea
738294
831217
-92923
754651
-16357
(5) Kara_Sea
824068
831440
-7373
895678
-71610
(6) Barents_Sea
325745
322981
2765
323801
1944
(7) Greenland_Sea
615174
567365
47810
591919
23255
(8) Baffin_Bay_Gulf_of_St._Lawrence
812548
908759
-96211
934257
-121709
(9) Canadian_Archipelago
811040
811378
-338
818055
-7015
(10) Hudson_Bay
1084892
1098368
-13476
1077744
7148
(11) Central_Arctic
3232324
3219180
13144
3230109
2215
(12) Bering_Sea
89124
122512
-33388
112353
-23228
(13) Baltic_Sea
0
161
-161
0
0
(14) Sea_of_Okhotsk
83572
97612
-14040
83076
495
The overall deficit to average happened yesterday, being an extent 1% lower, and two days earlier than average. The largest deficits to average are in Baffin Bay and Laptev Sea, along with Bering and Okhotsk. These are partly offset by surpluses elsewhere, mostly in Beaufort, Chukchi, and Greenland Seas.
The sordid story is about big pharma aided and abetted by big media and tech protecting their pandemic payday by banishing mention or acknowledgement of ivermectin’s success fighting Covid19. H/T Jo Nova article It’s the biggest medical scandal since 1850. Excerpt in italics:
Michael Capuzzo, a New York Times best-selling author , has just published an article titled “The Drug That Cracked Covid”. … But unfortunately most reporters are not interested in telling the other side of the story. Even if they were, their publishers would probably refuse to publish it.
That may explain why Capuzzo, a six-time Pulitzer-nominated journalist best known for his New York Times-bestselling nonfiction books Close to Shore and Murder Room, ended up publishing his article on ivermectin in Mountain Home, a monthly local magazine for the people of the Pennsylvania mountains and New York Finger Lakes region, of which Capuzzo’s wife is the editor.
When my daughter Grace, a vice president at a New York advertising agency, came down with COVID-19 recently, she was quarantined in a “COVID hotel” in Times Square with homeless people and quarantining travelers. The locks on her room door were removed. Nurses prowled the halls to keep her in her room and wake her up every night to check her vitals—not to treat her, because there is no approved treatment for COVID-19; only, if her oxygen plummeted, to move her to the hospital, where there is only a single effective approved treatment for COVID-19, steroids that may keep the lungs from failing.
The absence of treatments for COVID-19 is a global crisis, Dr. Francis Collins, director of the National Institutes of Health, said recently on 60 Minutes, for vaccines “are not enough.” Dangerous variants sweep the globe after mutating in the world’s poor and unvaccinated, lockdowns persist, and millions more are likely to die. The wondrous m-RNA vaccines need a cop buddy.
Fortunately, I knew of an early treatment for Grace. It’s a cheap generic drug, safer than Tylenol, FDA-approved to treat scabies and lice in children and the elderly, with many other uses that make Ivermectin a “wonder drug.” In fifty-five clinical trials with 445 scientists and 17,730 patients around the world, Ivermectin has been shown to be the most powerful drug to eradicate COVID-19 in all stages of the disease, including prevention and early treatment.
It’s what the world desperately needs now, according to Dr. Pierre Kory, a former professor at the University of Wisconsin, Madison medical school, whose research group, the nonprofit Frontline COVID-19 Critical Care Alliance, has developed the most effective non-vaccine treatments in the world from safe, FDA-approved generics. They have saved the lives of hundreds of thousands of people, including eighty-year-old Judy Smentkiewicz of Buffalo, the star of this month’s cover story. Judy’s remarkable story is a “miracle,” her family says, thanks to Pierre Kory, science, and God.
Grace researched Ivermectin and was surprised that it is not FDA-approved as an anti-viral to treat COVID-19, although it is FDA-approved as an anti-parasitic agent. This would be an “off-label use,” a routine thing in medicine comprising some 20 percent of all prescriptions—aspirin to prevent heart attack or stroke, for instance, is “off label.” This is called doctoring. And it was routine until COVID-19, when a big pharma-dominated health system tried to eliminate all generic competition to protect its biggest payday of all time.
Judy had the choice to fight back or die. A worldwide revolution that will determine the future of medicine and who lives and dies from COVID-19—the battle of Ivermectin—is fighting back, fighting for life. Grace, I’m happy to say, was prescribed Ivermectin and got better fast.
I got onto this story on Mother’s Day, 2020, when my wife Teresa, who many know as the publisher and editor of Mountain Home, and I watched Dr. Kory testify to the U.S. Senate about his group’s first breakthrough, a steroid treatment that was saving 95 percent of COVID-19 patients when 80 percent were dying in New York City and the world was in panic. To our surprise, as longtime journalists—we met at The Philadelphia Inquirer—Dr. Kory was cancelled by a global news blackout. Was not a treatment that could save the world news?
While Teresa puts out the magazine, I’ve written two New York Times-bestselling books, Close to Shore and The Murder Room, featuring some of the world’s most brilliant scientists. Now I’ve spent months interviewing Kory and his colleagues, and I’ve seen unthinkable things. When professor Joe Varon, a top critical care doctor and Mexican-American hero recently honored with “Joseph Varon Day” in Houston for his COVID-19 treatments that are saving the city’s sickest poor, black, Mexican, and immigrants, invited journalists from CNN, The Associated Press, and Reuters to his COVID-19 ICU to get out the news of his life-saving treatment, all the journalists fictionalized the story to make it seem like most everyone was dying when in fact most everyone was living. The happy story, the truth, didn’t fit the official government science.
We live in a remarkable media age where a positive story on CNN, perhaps more so than a peer review in The New England Journal of Medicine, will instantly encourage doctors in two hundred countries to use a perfectly safe and legal drug and save humanity. I call on my fellow colleagues, including former colleagues and friends at The Washington Post and The New York Times, to open their hearts and minds to legitimate, unreported doctors and therapies and write about all sides of the Ivermectin story, like journalists always have. It is a historic opportunity.
For the first time in the long journey from Gutenberg to Google, journalists may be the ones to save the world.
If only we lived in fairytale land, where the little boy’s observation that the emperor has no clothes snapped the people back to reality. In modern America, however, the exposure of delusional prevarications is met with a shrug by the powers that be, who simply move on to the peddling of other untruths.
For more than a year, government experts and their stenographers at our most prestigious media outlets denied what was clear to anybody with a modicum of common sense – that the COVID-19 pandemic that had originated in Wuhan, China, could have originated in the Wuhan lab where scientists were performing dangerous research into coronaviruses.
And now a video from Dr. Lawrence Sellin:
Transcript from closed captions in italics with my bolds.
I am Dr Lawrence Sellin. First I would like to thank all the young anti-communist chinese men and women who have worked with me to expose the truth about the laboratory origin of covid 19. Yes, covid 19 was created in a laboratory and it was a product of the People’s Liberation Army’s bio warfare program. I no longer use the word leak to describe what happened because that infers negligence but innocence of intent. The Chinese Communist Party and the People’s Liberation Army are not innocent so it does not matter how covid 19 was released because it was part of an evil plan with evil intent.
Together we have proven that covid 19 came from a laboratory, and because of our hard work, the world is beginning to accept that fact. The creation of covid19 was part of a process that has been underway for decades, but one that was greatly accelerated in 2016 by the fusion of military and civilian research as directed by the CCP’s 13th five-year plan.
Since the beginning of the pandemic it has been our goal to discover how covid19 was made and who made it. The answers to those questions reside in an analysis of the structure and organization of the PLA’s bio warfare program. As you know we have been using a technique I call virus research network analysis. It is a modification of traffic analysis, a method developed during the early days of world war II by Britain’s Gordon Welchman at Bletchley Park, which contributed to the breaking of Germany’s enigma code.
Let us now review what we know. The PLA’s biowarfare program has three levels: First there is a core secret military level layered on top of that are china’s universities and civilian institutions. It is that middle layer which gives the PLA access to the knowledge and skills of the international virus research community. Overall command and control of the PLA’s biowarfare program is done through the academy of military medical sciences in coordination with china’s ostensibly civilian academy of science and the Centers for Disease Control.
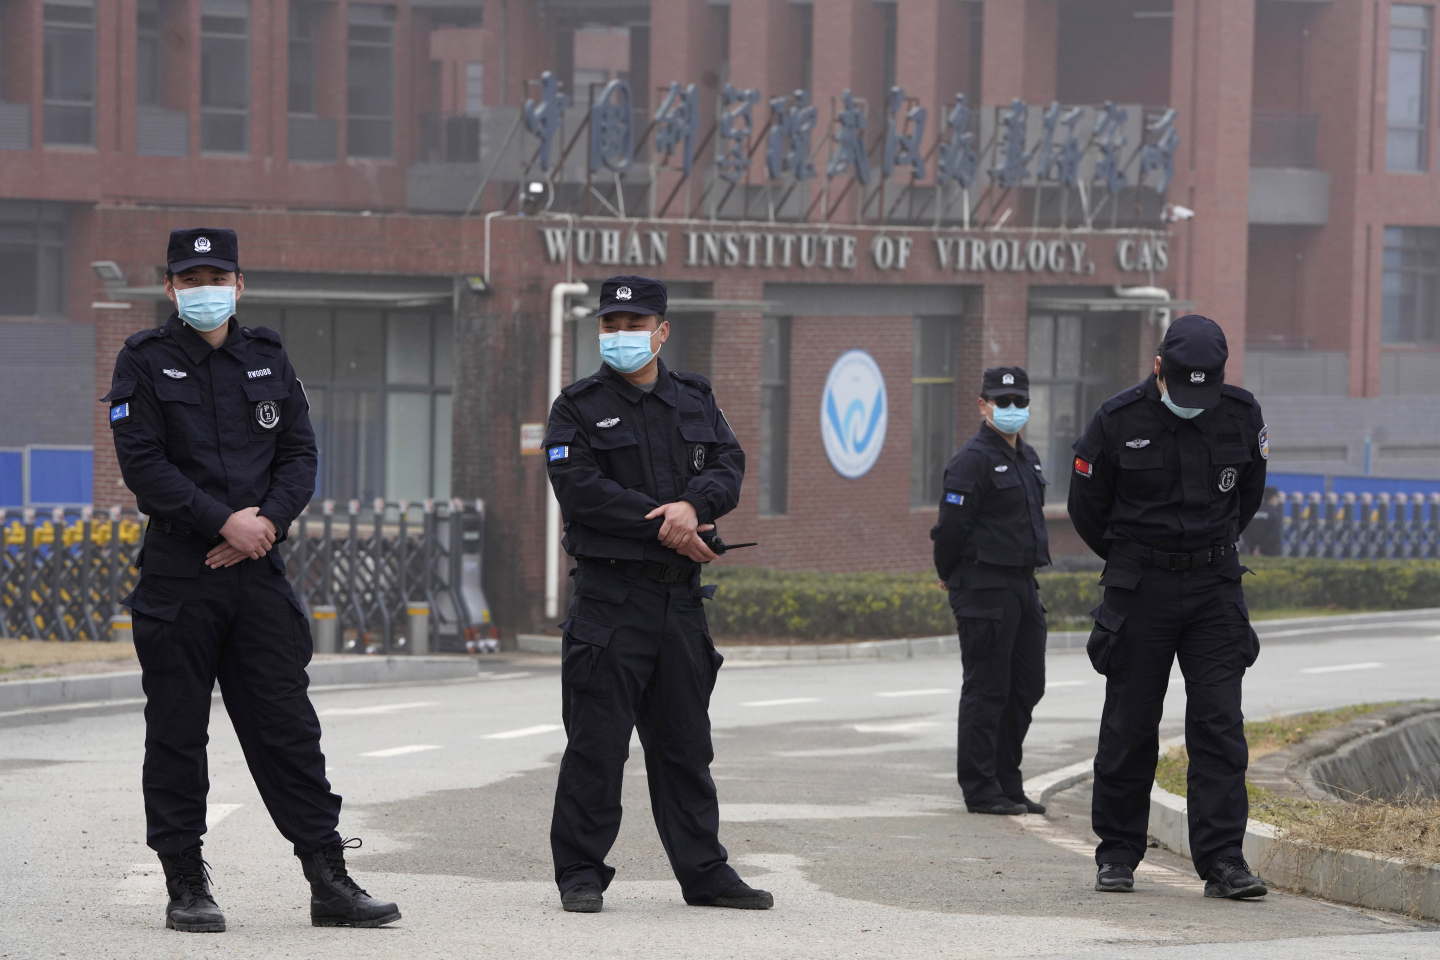
Over many years there has been a massive virus collection effort led by the PLA’s veterinary institute headquartered in Tan Chang. Other facilities such as the Wuhan Institute of Virology have been involved in the collection of viruses. Some bad coronaviruses were selected for further bio-warfare development based on their potential to jump from bats to humans that was a fundamental PLA bio-warfare criterion. That is the ability to blame nature for an actual bio-warfare attack.
Two bad coronaviruses isolated by the PLA were zcc 45 and zxc 2041 identified by Dr Lee Main Young as the coronavirus backbone for covid19. Laboratory manipulation of bad coronavirus backbones coordinated by the PLA was done at different centers focusing on different aspects of biowarfare weapon development. Virus recombination and gain of function research was undertaken at several sites including the Wuhan Institute of Virology. Pre-adaptation for human infection by serial passaging using genetically engineered humanized animal models occurred under the guidance of Tuwan King of the institute of laboratory animal science. Shibujang likely supervised the insertion of the fury and cleavage site with expertise provided by the southern medical university in Guangzhou.
Based on sources inside china a fully formed or nearly fully formed covid19 virus was ready for testing in the early months of 2019. The full extent of that testing is not yet known, especially whether or not there was a deliberate release into a human test community. Again based on sources inside china one covid19 sample was sent from Nanjing headquarters of the PLA’s eastern theater command to the Wuhan Institute of Virology for testing on non-human primates. In that time frame the only facility in Wuhan capable of undertaking such studies was the biosafety level 3 animal laboratory at Wuhan University. That facility also happens to be in the same district that was the epicenter of the initial covid19 outbreak. That test therefore is one potential scenario for the start of the pandemic
That is what we know but there is still more to do. Even though we know the covid19 virus was man-made, we need to understand all the details of how it was made and by whom. We need to describe the complete structure and organization of the PLA’s biowarfare program. We need to expose the extent of the PLA infiltration of international virus research programs, and which scientists assisted the PLA, either directly or indirectly in its biowarfare efforts.
Our investigation will continue.
Background from Previous Post
Update March 27, 2021 Ex-CDC Director Believes Wuhan Flu Escaped from a Lab
Excerpts in italics with my bolds. A previous post is reprinted further on showing the evidence not discussed and hand-waved away by Fauci, whose NIH funded the Wuhan research facility from which the virus likely came.
Dr. Robert Redfield told CNN that this was his opinion on the origins of the virus.
“I’m of the point of view that I still think the most likely etiology of this pathogen in Wuhan was from a laboratory, you know, escaped,” Redfield told CNN’s Dr. Sanjay Gupta. “Other people don’t believe that, that’s fine. Science will eventually figure it out.”
Still, a number of scientists say the most likely explanation is that the virus emerged naturally, passing from bats to another animal and then to humans, Live Science previously reported. Recently, a team from the World Health Organization, which is investigating the origins of SARS-CoV-2, said that it agrees with this hypothesis — WHO officials said the virus likely passed from bats to animals on wildlife farms in China, and then to humans, Live Science previously reported.
Redfield said he didn’t believe the bat theory. “Normally, when a pathogen goes from a zoonosis to humans, it takes a while for it to figure out how to become more and more efficient in human-to-human transmission,” Redfield told CNN. “I just don’t think this makes biological sense.”
The former CDC chief wasn’t suggesting SARS-CoV-2 is an engineered virus — another theory with no supporting evidence — just a natural escapee. “In the lab, you think that that process of becoming more efficient was happening?” Gupta asked. [Note: There is significant evidence of an engineered virus documented in the discussion below.]
“Yeah, let’s just say I have coronavirus that I’m working on. Most of us in the lab, we’re trying to grow a virus, we try to help make it grow better and better and better … so we can do experiments,” Redfield responded.
A virologist who fled China after studying the early outbreak of COVID-19 has published a new report claiming the coronavirus likely came from a lab. This adds to the analysis done by Dr. Luc Montagnier earlier this year, and summarized in a previous post reprinted later on. Dr. Yan was interviewed on Fox News, and YouTube has now blocked the video.
If you are wondering why Big Tech is censoring information unflattering to China, see Lee Smith’s Tablet article America’s China Class Launches a New War Against Trump The corporate, tech, and media elites will not allow the president to come between them and Chinese money
Doctor Li-Meng Yan, a scientist who studied some of the available data on COVID-19 has published her claims on Zenodo, an open access digital platform. She wrote that she believed COVID-19 could have been “conveniently created” within a lab setting over a period of just six months, and “SARS-CoV-2 shows biological characteristics that are inconsistent with a naturally occurring, zoonotic virus”.
The natural origin theory, although widely accepted, lacks substantial support. The alternative theory that the virus may have come from a research laboratory is, however, strictly censored on peer-reviewed scientific journals. Nonetheless, SARS-CoV-2 shows biological characteristics that are inconsistent with a naturally occurring, zoonotic virus. In this report, we describe the genomic, structural, medical, and literature evidence, which, when considered together, strongly contradicts the natural origin theory.
The evidence shows that SARS-CoV-2 should be a laboratory product created by using bat coronaviruses ZC45 and/or ZXC21 as a template and/or backbone.
Contents
Consistent with this notion, genomic, structural, and literature evidence also suggest a non-natural origin of SARS-CoV-2. In addition, abundant literature indicates that gain-of-function research has long advanced to the stage where viral genomes can be precisely engineered and manipulated to enable the creation of novel coronaviruses possessing unique properties. In this report, we present such evidence and the associated analyses.
Part 1 of the report describes the genomic and structural features of SARS-CoV-2, the presence of which could be consistent with the theory that the virus is a product of laboratory modification beyond what could be afforded by simple serial viral passage. Part 2 of the report describes a highly probable pathway for the laboratory creation of SARS-CoV-2, key steps of which are supported by evidence present in the viral genome. Importantly, part 2 should be viewed as a demonstration of how SARS-CoV-2 could be conveniently created in a laboratory in a short period of time using available materials and well-documented techniques. This report is produced by a team of experienced scientists using our combined expertise in virology, molecular biology, structural biology, computational biology, vaccine development, and medicine.
We present three lines of evidence to support our contention that laboratory manipulation is part of the history of SARS-CoV-2:
i. The genomic sequence of SARS-CoV-2 is suspiciously similar to that of a bat coronavirus discovered by military laboratories in the Third Military Medical University (Chongqing, China) and the Research Institute for Medicine of Nanjing Command (Nanjing, China).
ii. The receptor-binding motif (RBM) within the Spike protein of SARS-CoV-2, which determines the host specificity of the virus, resembles that of SARS-CoV from the 2003 epidemic in a suspicious manner. Genomic evidence suggests that the RBM has been genetically manipulated.
iii. SARS-CoV-2 contains a unique furin-cleavage site in its Spike protein, which is known to greatly enhance viral infectivity and cell tropism. Yet, this cleavage site is completely absent in this particular class of coronaviruses found in nature. In addition, rare codons associated with this additional sequence suggest the strong possibility that this furin-cleavage site is not the product of natural evolution and could have been inserted into the SARS-CoV-2 genome artificially by techniques other than simple serial passage or multi-strain recombination events inside co-infected tissue cultures or animals.
Background from Previous post June 30, 2020: Pandemic Update: Virus Weaker, HCQ Stronger
In past weeks there have been anecdotal reports from frontline doctors that patients who would have been flattened fighting off SARS CV2 in April are now sitting up and recovering in a few days. We have also the statistical evidence in the US and Sweden, as two examples, that case numbers are rising while Covid deaths continue declining. One explanation is that the new cases are younger people who have been released from lockdown (in US) with stronger immune systems. But it may also be that the virus itself is losing potency.
Contrary to the narrative that is being pushed by the mainstream that the COVID 19 virus was the result of a natural mutation and that it was transmitted to humans from bats via pangolins, Dr Luc Montagnier the man who discovered the HIV virus back in 1983 disagrees and is saying that the virus was man made.
Professor Luc Montagnier, 2008 Nobel Prize winner for Medicine, claims that SARS-CoV-2 is a manipulated virus that was accidentally released from a laboratory in Wuhan, China. Chinese researchers are said to have used coronaviruses in their work to develop an AIDS vaccine. HIV RNA fragments are believed to have been found in the SARS-CoV-2 genome.
“With my colleague, bio-mathematician Jean-Claude Perez, we carefully analyzed the description of the genome of this RNA virus,” explains Luc Montagnier, interviewed by Dr Jean-François Lemoine for the daily podcast at Pourquoi Docteur, adding that others have already explored this avenue: Indian researchers have already tried to publish the results of the analyses that showed that this coronavirus genome contained sequences of another virus, … the HIV virus (AIDS virus), but they were forced to withdraw their findings as the pressure from the mainstream was too great.
To insert an HIV sequence into this genome requires molecular tools
In a challenging question Dr Jean-François Lemoine inferred that the coronavirus under investigation may have come from a patient who is otherwise infected with HIV. No, “says Luc Montagnier,” in order to insert an HIV sequence into this genome, molecular tools are needed, and that can only be done in a laboratory.
According to the 2008 Nobel Prize for Medicine, a plausible explanation would be an accident in the Wuhan laboratory. He also added that the purpose of this work was the search for an AIDS vaccine.
In any case, this thesis, defended by Professor Luc Montagnier, has a positive turn.
According to him, the altered elements of this virus are eliminated as it spreads: “Nature does not accept any molecular tinkering, it will eliminate these unnatural changes and even if nothing is done, things will get better, but unfortunately after many deaths.”
This is enough to feed some heated debates! So much so that Professor Montagnier’s statements could also place him in the category of “conspiracy theorists”: “Conspirators are the opposite camp, hiding the truth,” he replies, without wanting to accuse anyone, but hoping that the Chinese will admit to what he believes happened in their laboratory.
To entice a confession from the Chinese he used the example of Iran which after taking full responsibility for accidentally hitting a Ukrainian plane was able to earn the respect of the global community. Hopefully the Chinese will do the right thing he adds. “In any case, the truth always comes out, it is up to the Chinese government to take responsibility.”
Implications: Leaving aside the geopolitics, this theory also explains why the virus weakens when mutations lose the unnatural pieces added in the lab. Since this is an RNA (not DNA) sequence mutations are slower, but inevitable. If correct, this theory works against fears of a second wave of infections. It also gives an unintended benefit from past lockdowns and shutdowns, slowing the rate of infections while the virus degrades itself.
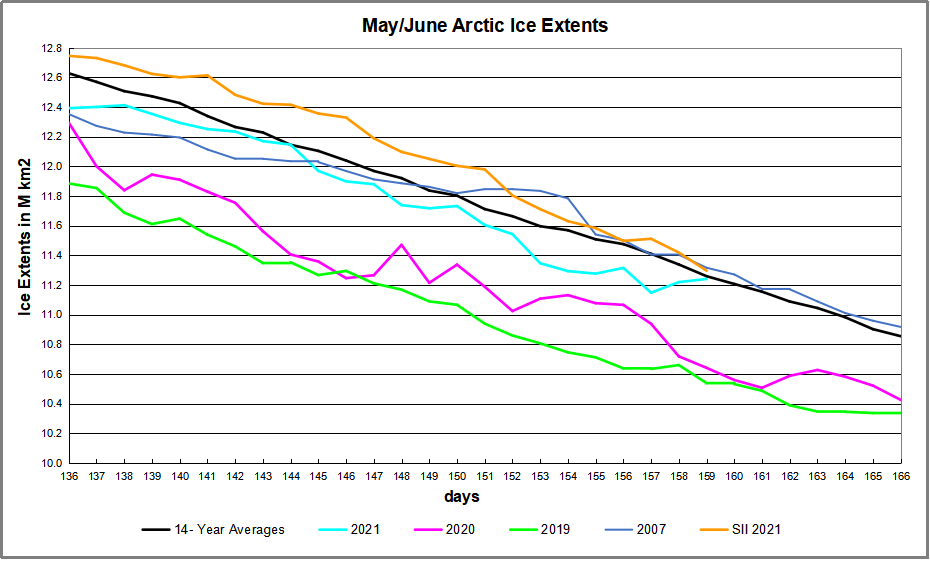


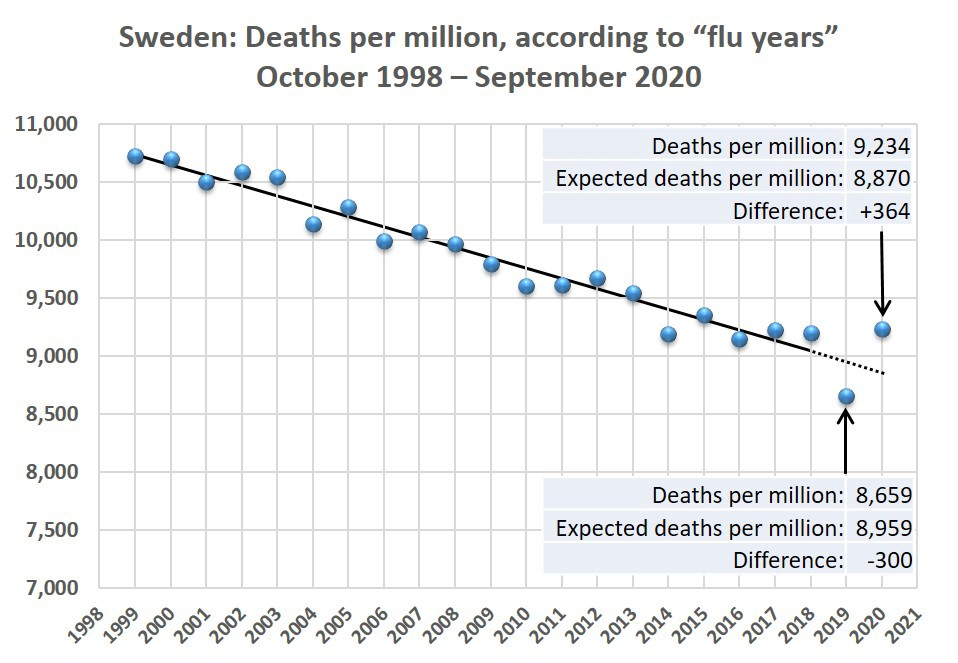
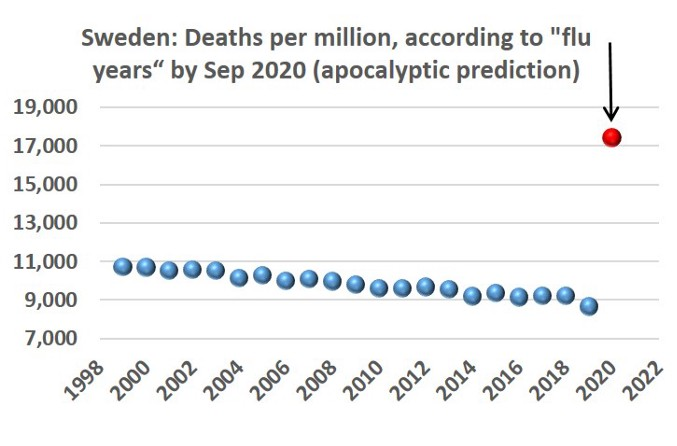
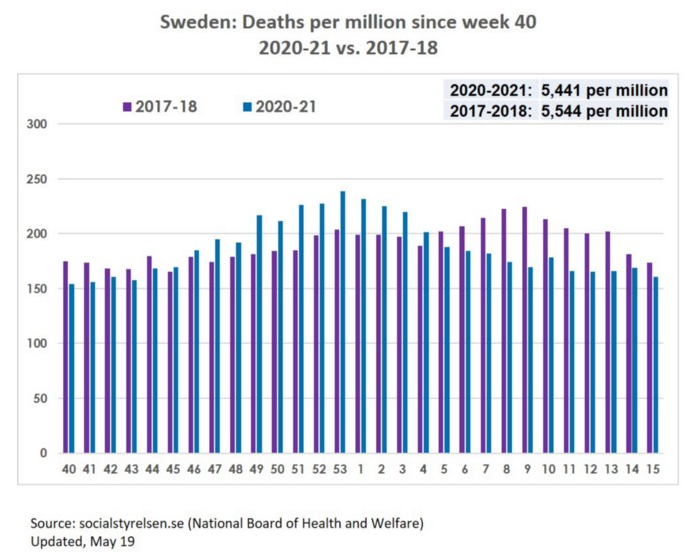

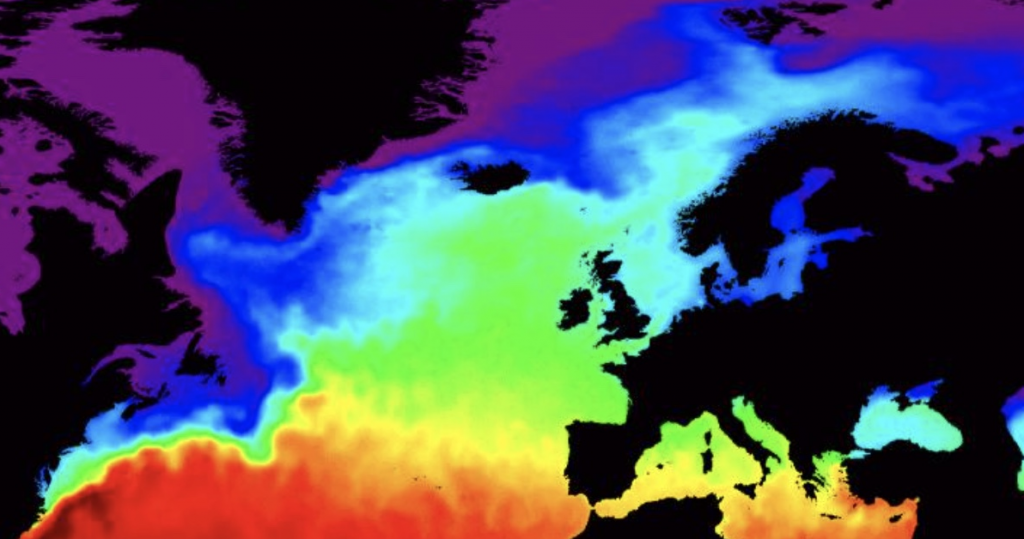
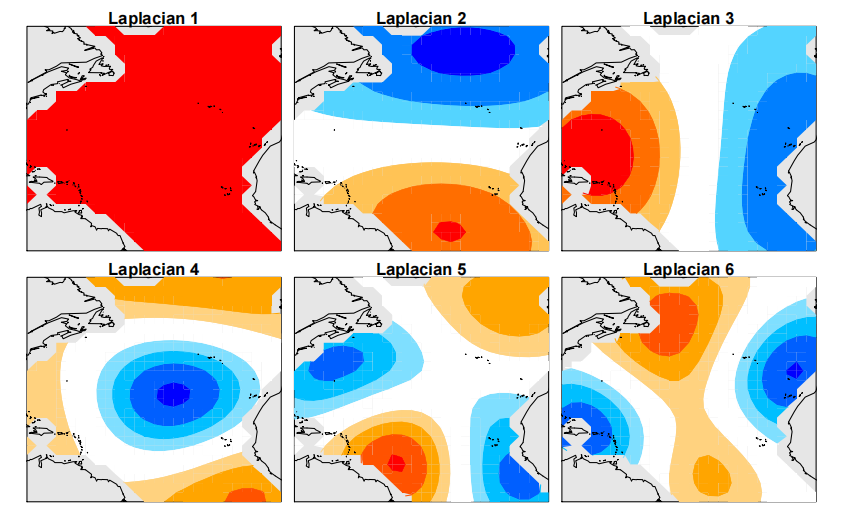
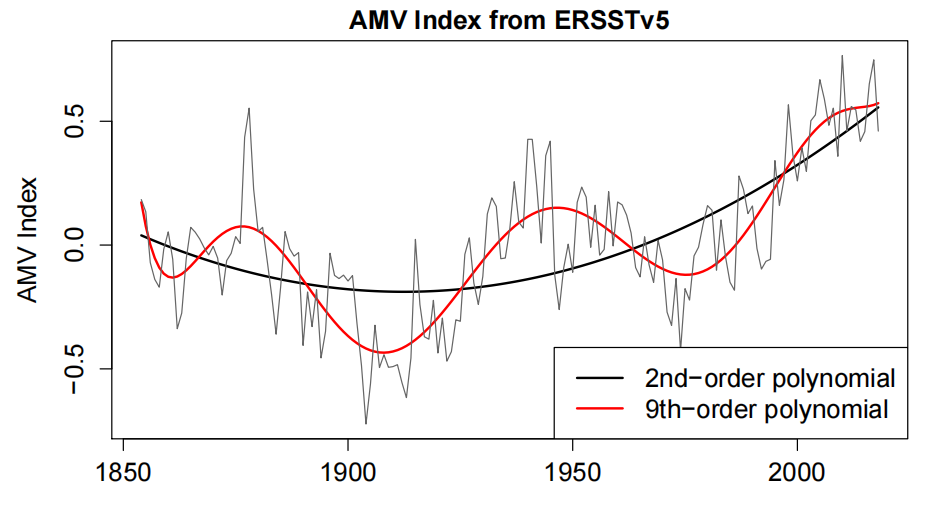 Figure 2. AMV index from ERSSTv5 (thin grey), and polynomial fits to a second-order (thick black) and ninth-order (red) polynomial.
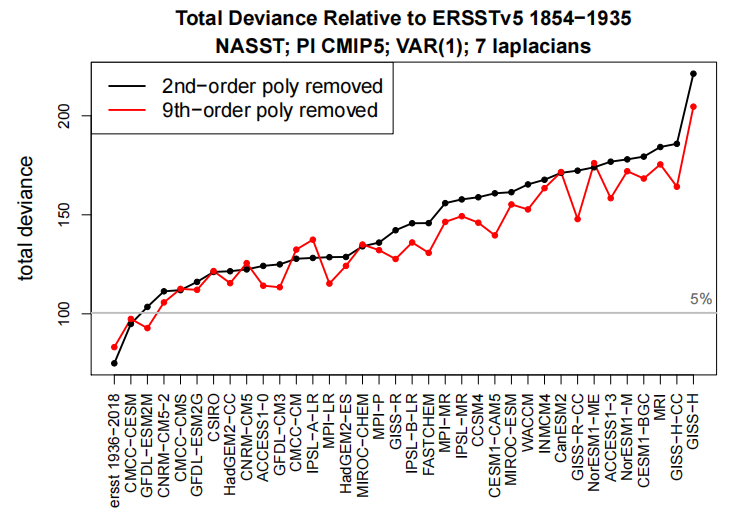


 Samuel Allegri explains in his Epoch Times article