The animation is an update of a previous analysis from Dr. Murry Salby. These graphs use Hadcrut4 and include the 2016 El Nino warming event. The exhibit shows since 1947 GMT warmed by 0.8 C, from 13.9 to 14.7, as estimated by Hadcrut4. This resulted from three natural warming events involving ocean cycles. The most recent rise 2013-16 lifted temperatures by 0.2C. Previously the 1997-98 El Nino produced a plateau increase of 0.4C. Before that, a rise from 1977-81 added 0.2C to start the warming since 1947.
Importantly, the theory of human-caused global warming asserts that increasing CO2 in the atmosphere changes the baseline and causes systemic warming in our climate. On the contrary, all of the warming since 1947 was episodic, coming from three brief events associated with oceanic cycles. Moreover, the UAH record shows that the effects of the last one are now gone as of January 2021. Updated to March 2021 (UAH baseline is now 1990-2020)
The 2016 El Nino persisted longer than 1998, and was followed by warming after effects in NH. The monthly anomaly as 2021 begins is matching the 0.04C average since 1995, an ENSO neutral year prior to the second warming event discussed above. With a quiet sun and cooling oceans, the prospect is for cooler times ahead.
Postscript: Article by Dr. Arnd Bernaerts regarding ENSO and Climate Models
He summarizes in this way (in italics with my bolds):
Although ENSO is a long-known climate phenomenon, climatologists still follow the view of the meteorologists 100 years ago, according to which the atmosphere is at the center of all-weather events. They are generously willing to acknowledge that the oceans play an important role, but not that ocean temperatures and their contribution to atmospheric humidity are the most crucial factors. This can be seen in the example of ENSO. Although small in oceanic proportions, the weather above can have long distance effects. Once it happen, e.g. due to a lack of trade winds, the triggering cause remains the changes in equatorial water temperatures.
The attempt to use computer models and weather observation data, by atmosphere-ocean coupling, ENSO forecasts failed with the 2020/2021 forecast and will not achieve what would be necessary in the future either.
What is needed is twofold: (a) much more ocean data , and (b) acknowledging the supremacy of the oceans in climatic change matters.
No ocean area is as intensive observed as the Equatorial Eastern Pacific (EEP), well over 40 years. Since recently the Tropical Pacific Observing System, TPOS 2020, sustained sampling network is the “backbone” of the system, (Details: WMO). Whether this system can even provide nearly enough oceanic data to make predictions about what is going on under the sea surface cannot be judged here, but it is unlikely and for a long time.
So the other problem remains, the climatologists’ narrow view on the atmosphere. The authors of the El Nino forecast for 2020/21 failed because they lacked the insight that without comprehensive marine data, their model calculations are at best speculations. At least this conclusion should be drawn from their dramatic false prognosis.
In conclusion climatology should realize, that any ocean space, whether in size of a few hundred square miles or as covered by ENSO, plays an important role in climate matters, and that the latter should be regarded as a gift, to understand the mechanism quicker, on who is driving the climate.
The best context for understanding decadal temperature changes comes from the world’s sea surface temperatures (SST), for several reasons:
The ocean covers 71% of the globe and drives average temperatures;
SSTs have a constant water content, (unlike air temperatures), so give a better reading of heat content variations;
A major El Nino was the dominant climate feature in recent years.
HadSST is generally regarded as the best of the global SST data sets, and so the temperature story here comes from that source, the latest version being HadSST3. More on what distinguishes HadSST3 from other SST products at the end.
The Current Context
The year end report below showed 2020 rapidly cooling in all regions. The anomalies have continued to drop sharply and are now well below the mean since 1995. This Global Cooling was also evident in the UAH Land and Ocean air temperatures (See 2021 Starts with Cool Land and Sea)
The chart below shows SST monthly anomalies as reported in HadSST3 starting in 2015 through January 2021. After three straight Spring 2020 months of cooling led by the tropics and SH, NH spiked in the summer, along with smaller bumps elsewhere. Now temps everywhere are dropping the last six months, with all regions well below the Global Mean since 2015, matching the cold of 2018, and lower than January 2015.
A global cooling pattern is seen clearly in the Tropics since its peak in 2016, joined by NH and SH cycling downward since 2016. In 2019 all regions had been converging to reach nearly the same value in April.
Then NH rose exceptionally by almost 0.5C over the four summer months, in August 2019 exceeding previous summer peaks in NH since 2015. In the 4 succeeding months, that warm NH pulse reversed sharply. Then again NH temps warmed to a 2020 summer peak, matching 2019. This has now been reversed with all regions pulling the Global anomaly downward sharply.
Note that higher temps in 2015 and 2016 were first of all due to a sharp rise in Tropical SST, beginning in March 2015, peaking in January 2016, and steadily declining back below its beginning level. Secondly, the Northern Hemisphere added three bumps on the shoulders of Tropical warming, with peaks in August of each year. A fourth NH bump was lower and peaked in September 2018. As noted above, a fifth peak in August 2019 and a sixth August 2020 exceeded the four previous upward bumps in NH.
And as before, note that the global release of heat was not dramatic, due to the Southern Hemisphere offsetting the Northern one. The major difference between now and 2015-2016 is the absence of Tropical warming driving the SSTs, along with SH anomalies reaching nearly the lowest in this period. Presently both SH and the Tropics are quite cool, with NH coming off its summer peak. Note the tropical temps descending into La Nina levels. At this point, the 2016 El Nino and its NH after effects have dissipated completely.
A longer view of SSTs
The graph below is noisy, but the density is needed to see the seasonal patterns in the oceanic fluctuations. Previous posts focused on the rise and fall of the last El Nino starting in 2015. This post adds a longer view, encompassing the significant 1998 El Nino and since. The color schemes are retained for Global, Tropics, NH and SH anomalies. Despite the longer time frame, I have kept the monthly data (rather than yearly averages) because of interesting shifts between January and July.
To enlarge image, single-click or open in new tab.
1995 is a reasonable (ENSO neutral) starting point prior to the first El Nino. The sharp Tropical rise peaking in 1998 is dominant in the record, starting Jan. ’97 to pull up SSTs uniformly before returning to the same level Jan. ’99. For the next 2 years, the Tropics stayed down, and the world’s oceans held steady around 0.2C above 1961 to 1990 average.
Then comes a steady rise over two years to a lesser peak Jan. 2003, but again uniformly pulling all oceans up around 0.4C. Something changes at this point, with more hemispheric divergence than before. Over the 4 years until Jan 2007, the Tropics go through ups and downs, NH a series of ups and SH mostly downs. As a result the Global average fluctuates around that same 0.4C, which also turns out to be the average for the entire record since 1995.
2007 stands out with a sharp drop in temperatures so that Jan.08 matches the low in Jan. ’99, but starting from a lower high. The oceans all decline as well, until temps build peaking in 2010.
Now again a different pattern appears. The Tropics cool sharply to Jan 11, then rise steadily for 4 years to Jan 15, at which point the most recent major El Nino takes off. But this time in contrast to ’97-’99, the Northern Hemisphere produces peaks every summer pulling up the Global average. In fact, these NH peaks appear every July starting in 2003, growing stronger to produce 3 massive highs in 2014, 15 and 16. NH July 2017 was only slightly lower, and a fifth NH peak still lower in Sept. 2018.
The highest summer NH peak came in 2019, only this time the Tropics and SH are offsetting rather adding to the warming. Since 2014 SH has played a moderating role, offsetting the NH warming pulses. Now September 2020 is dropping off last summer’s unusually high NH SSTs. (Note: these are high anomalies on top of the highest absolute temps in the NH.)
What to make of all this? The patterns suggest that in addition to El Ninos in the Pacific driving the Tropic SSTs, something else is going on in the NH. The obvious culprit is the North Atlantic, since I have seen this sort of pulsing before. After reading some papers by David Dilley, I confirmed his observation of Atlantic pulses into the Arctic every 8 to 10 years.
But the peaks coming nearly every summer in HadSST require a different picture. Let’s look at August, the hottest month in the North Atlantic from the Kaplan dataset. The AMO Index is from from Kaplan SST v2, the unaltered and not detrended dataset. By definition, the data are monthly average SSTs interpolated to a 5×5 grid over the North Atlantic basically 0 to 70N. The graph shows August warming began after 1992 up to 1998, with a series of matching years since, including 2020. Because the N. Atlantic has partnered with the Pacific ENSO recently, let’s take a closer look at some AMO years in the last 2 decades.
This graph shows monthly AMO temps for some important years. The Peak years were 1998, 2010 and 2016, with the latter emphasized as the most recent. The other years show lesser warming, with 2007 emphasized as the coolest in the last 20 years. Note the red 2018 line is at the bottom of all these tracks. The black line shows that 2020 began slightly warm, then set records for 3 months. then dropped below 2016 and 2017, peaked in August and is now below 2016.
Summary
The oceans are driving the warming this century. SSTs took a step up with the 1998 El Nino and have stayed there with help from the North Atlantic, and more recently the Pacific northern “Blob.” The ocean surfaces are releasing a lot of energy, warming the air, but eventually will have a cooling effect. The decline after 1937 was rapid by comparison, so one wonders: How long can the oceans keep this up? If the pattern of recent years continues, NH SST anomalies may rise slightly in coming months, but once again, ENSO which has weakened will probably determine the outcome.
Footnote: Why Rely on HadSST3
HadSST3 is distinguished from other SST products because HadCRU (Hadley Climatic Research Unit) does not engage in SST interpolation, i.e. infilling estimated anomalies into grid cells lacking sufficient sampling in a given month. From reading the documentation and from queries to Met Office, this is their procedure.
HadSST3 imports data from gridcells containing ocean, excluding land cells. From past records, they have calculated daily and monthly average readings for each grid cell for the period 1961 to 1990. Those temperatures form the baseline from which anomalies are calculated.
In a given month, each gridcell with sufficient sampling is averaged for the month and then the baseline value for that cell and that month is subtracted, resulting in the monthly anomaly for that cell. All cells with monthly anomalies are averaged to produce global, hemispheric and tropical anomalies for the month, based on the cells in those locations. For example, Tropics averages include ocean grid cells lying between latitudes 20N and 20S.
Gridcells lacking sufficient sampling that month are left out of the averaging, and the uncertainty from such missing data is estimated. IMO that is more reasonable than inventing data to infill. And it seems that the Global Drifter Array displayed in the top image is providing more uniform coverage of the oceans than in the past.
USS Pearl Harbor deploys Global Drifter Buoys in Pacific Ocean
A recent post here on the Great Texas Blackout of 2021 reinforces the rule of thumb found in other electrical grids exposed to intermittent feeds from wind and solar. That post Data Show Wind Power Messed Up Texas described how the loss of wind power due to frozen turbines caused over 4 million homes in Texas to lose power and who are still short of drinking water. The Texas sources of electrical power were shown as:
Note that despite wind nameplate capacity of 25 GW, ERCOT is only counting on 33% of wind power to be available. At 8 GW wind is expected to supply about 10% of the operational capacity. At 6 pm. Feb. 14, 2021, wind was at 9 GW before collapsing down to 5GW and then to less than 1GW in a few hours.
This matches the pattern of grids going unstable when exceeding about 10% of power generated by wind and/or solar. Reprinted below is a post explaining the issues.
Background: Climateers Tilting at Windmills
Don Quixote ( “don key-ho-tee” ) in Cervantes’ famous novel charged at some windmills claiming they were enemies, and is celebrated in the English language by two idioms:
Tilting at Windmills–meaning attacking imaginary enemies, and
Quixotic (“quick-sottic”)–meaning striving for visionary ideals.
It is clear that climateers are similary engaged in some kind of heroic quest, like modern-day Don Quixotes. The only differences: They imagine a trace gas in the air is the enemy, and that windmills are our saviors.
A previous post (at the end) addresses the unreality of the campaign to abandon fossil fuels in the face of the world’s demand for that energy. Now we have a startling assessment of the imaginary benefits of using windmills to power electrical grids. This conclusion comes from Gail Tverberg, a seasoned analyst of economic effects from resource limits, especially energy. Her blog is called Our Finite World, indicating her viewpoint. So her dismissal of wind power is a serious indictment. A synopsis follows. (Title is link to article)
In fact, I have come to the rather astounding conclusion that even if wind turbines and solar PV could be built at zero cost, it would not make sense to continue to add them to the electric grid in the absence of very much better and cheaper electricity storage than we have today. There are too many costs outside building the devices themselves. It is these secondary costs that are problematic. Also, the presence of intermittent electricity disrupts competitive prices, leading to electricity prices that are far too low for other electricity providers, including those providing electricity using nuclear or natural gas. The tiny contribution of wind and solar to grid electricity cannot make up for the loss of more traditional electricity sources due to low prices.
Let’s look at some of the issues that we are encountering, as we attempt to add intermittent renewable energy to the electric grid.
Issue 1. Grid issues become a problem at low levels of intermittent electricity penetration.
Hawaii consists of a chain of islands, so it cannot import electricity from elsewhere. This is what I mean by “Generation = Consumption.” There is, of course, some transmission line loss with all electrical generation, so generation and consumption are, in fact, slightly different.
The situation is not too different in California. The main difference is that California can import non-intermittent (also called “dispatchable”) electricity from elsewhere. It is really the ratio of intermittent electricity to total electricity that is important, when it comes to balancing. California is running into grid issues at a similar level of intermittent electricity penetration (wind + solar PV) as Hawaii–about 12.3% of electricity consumed in 2015, compared to 12.2% for Hawaii.
Issue 2. The apparent “lid” on intermittent electricity at 10% to 15% of total electricity consumption is caused by limits on operating reserves.
In theory, changes can be made to the system to allow the system to be more flexible. One such change is adding more long distance transmission, so that the variable electricity can be distributed over a wider area. This way the 10% to 15% operational reserve “cap” applies more broadly. Another approach is adding energy storage, so that excess electricity can be stored until needed later. A third approach is using a “smart grid” to make changes, such as turning off all air conditioners and hot water heaters when electricity supply is inadequate. All of these changes tend to be slow to implement and high in cost, relative to the amount of intermittent electricity that can be added because of their implementation.
Issue 3. When there is no other workaround for excess intermittent electricity, it must be curtailed–that is, dumped rather than added to the grid.
Based on the modeling of the company that oversees the California electric grid, electricity curtailment in California is expected to be significant by 2024, if the 40% California Renewable Portfolio Standard (RPS) is followed, and changes are not made to fix the problem.
Issue 4. When all costs are included, including grid costs and indirect costs, such as the need for additional storage, the cost of intermittent renewables tends to be very high.
In Europe, there is at least a reasonable attempt to charge electricity costs back to consumers. In the United States, renewable energy costs are mostly hidden, rather than charged back to consumers. This is easy to do, because their usage is still low.
Euan Mearns finds that in Europe, the greater the proportion of wind and solar electricity included in total generation, the higher electricity prices are for consumers.
Issue 5. The amount that electrical utilities are willing to pay for intermittent electricity is very low.
To sum up, when intermittent electricity is added to the electric grid, the primary savings are fuel savings. At the same time, significant costs of many different types are added, acting to offset these savings. In fact, it is not even clear that when a comparison is made, the benefits of adding intermittent electricity are greater than the costs involved.
Issue 6. When intermittent electricity is sold in competitive electricity markets (as it is in California, Texas, and Europe), it frequently leads to negative wholesale electricity prices. It also shaves the peaks off high prices at times of high demand.
When solar energy is included in the mix of intermittent fuels, it also tends to reduce peak afternoon prices. Of course, these minute-by-minute prices don’t really flow back to the ultimate consumers, so it doesn’t affect their demand. Instead, these low prices simply lead to lower funds available to other electricity producers, most of whom cannot quickly modify electricity generation.
A price of $36 per MWh is way down at the bottom of the chart, between 0 and 50. Pretty much no energy source can be profitable at such a level. Too much investment is required, relative to the amount of energy produced. We reach a situation where nearly every kind of electricity provider needs subsidies. If they cannot receive subsidies, many of them will close, leaving the market with only a small amount of unreliable intermittent electricity, and little back-up capability.
This same problem with falling wholesale prices, and a need for subsidies for other energy producers, has been noted in California and Texas. The Wall Street Journal ran an article earlier this week about low electricity prices in Texas, without realizing that this was a problem caused by wind energy, not a desirable result!
Issue 7. Other parts of the world are also having problems with intermittent electricity.
Needless to say, such high intermittent electricity generation leads to frequent spikes in generation. Germany chose to solve this problem by dumping its excess electricity supply on the European Union electric grid. Poland, Czech Republic, and Netherlands complained to the European Union. As a result, the European Union mandated that from 2017 onward, all European Union countries (not just Germany) can no longer use feed-in tariffs. Doing so provides too much of an advantage to intermittent electricity providers. Instead, EU members must use market-responsive auctioning, known as “feed-in premiums.” Germany legislated changes that went even beyond the minimum changes required by the European Union. Dörte Fouquet, Director of the European Renewable Energy Federation, says that the German adjustments will “decimate the industry.”
Issue 8. The amount of subsidies provided to intermittent electricity is very high.
The US Energy Information Administration prepared an estimate of certain types of subsidies (those provided by the federal government and targeted particularly at energy) for the year 2013. These amounted to a total of $11.3 billion for wind and solar combined. About 183.3 terawatts of wind and solar energy was sold during 2013, at a wholesale price of about 2.8 cents per kWh, leading to a total selling price of $5.1 billion dollars. If we add the wholesale price of $5.1 billion to the subsidy of $11.3 billion, we get a total of $16.4 billion paid to developers or used in special grid expansion programs. This subsidy amounts to 69% of the estimated total cost. Any subsidy from states, or from other government programs, would be in addition to the amount from this calculation.
In a sense, these calculations do not show the full amount of subsidy. If renewables are to replace fossil fuels, they must pay taxes to governments, just as fossil fuel providers do now. Energy providers are supposed to provide “net energy” to the system. The way that they share this net energy with governments is by paying taxes of various kinds–income taxes, property taxes, and special taxes associated with extraction. If intermittent renewables are to replace fossil fuels, they need to provide tax revenue as well. Current subsidy calculations don’t consider the high taxes paid by fossil fuel providers, and the need to replace these taxes, if governments are to have adequate revenue.
Also, the amount and percentage of required subsidy for intermittent renewables can be expected to rise over time, as more areas exceed the limits of their operating reserves, and need to build long distance transmission to spread intermittent electricity over a larger area. This seems to be happening in Europe now.
There is also the problem of the low profit levels for all of the other electricity providers, when intermittent renewables are allowed to sell their electricity whenever it becomes available. One potential solution is huge subsidies for other providers. Another is buying a lot of energy storage, so that energy from peaks can be saved and used when supply is low. A third solution is requiring that renewable energy providers curtail their production when it is not needed. Any of these solutions is likely to require subsidies.
Conclusion
Few people have stopped to realize that intermittent electricity isn’t worth very much. It may even have negative value, when the cost of all of the adjustments needed to make it useful are considered.
Energy products are very different in “quality.” Intermittent electricity is of exceptionally low quality. The costs that intermittent electricity impose on the system need to be paid by someone else. This is a huge problem, especially as penetration levels start exceeding the 10% to 15% level that can be handled by operating reserves, and much more costly adjustments must be made to accommodate this energy. Even if wind turbines and solar panels could be produced for $0, it seems likely that the costs of working around the problems caused by intermittent electricity would be greater than the compensation that can be obtained to fix those problems.
The economy does not perform well when the cost of energy products is very high. The situation with new electricity generation is similar. We need electricity products to be well-behaved (not act like drunk drivers) and low in cost, if they are to be successful in growing the economy. If we continue to add large amounts of intermittent electricity to the electric grid without paying attention to these problems, we run the risk of bringing the whole system down.
Why the Quest to Reduce Fossil Fuel Emissions is Quixotic
Roger Andrews at Energy Matters puts into context the whole mission to reduce carbon emissions. You only have to look at the G20 countries, who have 64% of the global population and use 80% of the world’s energy. The introduction to his essay, Electricity and energy in the G20:
While governments fixate on cutting emissions from the electricity sector, the larger problem of cutting emissions from the non-electricity sector is generally ignored. In this post I present data from the G20 countries, which between them consume 80% of the world’s energy, summarizing the present situation. The results show that the G20 countries obtain only 41.5% of their total energy from electricity and the remaining 58.5% dominantly from oil, coal and gas consumed in the non-electric sector (transportation, industrial processes, heating etc). So even if they eventually succeed in obtaining all their electricity from low-carbon sources they would still be getting more than half their energy from high-carbon sources if no progress is made in decarbonizing their non-electric sectors.
The whole article is enlightening, and shows how much our civilization depends on fossil fuels, even when other sources are employed. The final graph is powerful (thermal refers to burning of fossil fuels):
Figure 12: Figure 9 with Y-scale expanded to 100% and thermal generation included, illustrating the magnitude of the problem the G20 countries still face in decarbonizing their energy sectors.
The requirement is ultimately to replace the red-shaded bars with shades of dark blue, light blue or green – presumably dominantly light blue because nuclear is presently the only practicable solution.
Summary
There is another way. Adaptation means accepting the time-honored wisdom that weather and climates change in ways beyond our control. The future will have periods both cooler and warmer than the present and we must prepare for both contingencies. Colder conditions are the greater threat to human health and prosperity. The key priorities are robust infrastructures and reliable, affordable energy.
Footnote:
This video shows Don Quixote might have more success against modern windmills.
Yes, with hindsight you can blame Texas for not winter weather proofing fossil fuel supplies as places do in more northern latitudes. But it was over-reliance on wind power that caused the problem and made it intractable. John Peterson explains in his TalkMarkets article How Wind Power Caused The Great Texas Blackout Of 2021. Excerpts in italics with my bolds.
The State of Texas is suffering from a catastrophic power grid failure that’s left 4.3 million homes without electricity, including 1.3 million homes in Houston, the country’s fourth-largest city.
While talking heads, politicians, and the press are blaming fossil fuels and claiming that more renewables are the solution, hard data from the Energy Information Administration paints a very different picture.
The generation failures that led to The Great Texas Blackout of 2021 began at 6 pm on Sunday. Wind power fell from 36% of nameplate capacity to 22% before midnight and plummeted to 3% of nameplate capacity by 8 pm on Monday.
While power producers quickly ramped production to almost 90% of dedicated natural gas capacity, a combination of factors including shutdowns for scheduled maintenance and a statewide increase in natural gas demand began to overload safety systems and set-off a cascade of shutdowns.
While similar overload-induced shutdowns followed suit in coal and nuclear plants, the domino effect began with ERCOT’s reckless reliance on unreliable wind power.
The ERCOT grid has 85,281 MW of operational generating capacity if no plants are offline for scheduled maintenance. Under the “Winter Fuel Types” tab of its Capacity, Demand and Reserves Report dated December 16, 2020, ERCOT described its operational generating capacity by fuel source as follows:
Since power producers frequently take gas-fired plants offline for scheduled maintenance in February and March when power demand is typically low, ERCOT’s systemwide generating capacity was less than 85 GW and its total power load was 59.6 GW at 9:00 am on Valentines Day. By 8:00 pm, power demand has surged to 68 GW (14%). Then hell froze over. Over the next 24 hours, statewide power production collapsed to 43.5 GW (36%) and millions of households were plunged into darkness in freezing weather conditions.
I went to the US Energy Information Administration’s website and searched for hourly data on electricity production by fuel source in the State of Texas. The first treasure I found was this line graph that shows electricity generation by fuel source from 12:01 am on February 10th through 11:59 pm on February 16th.
The second and more important treasure was a downloadable spreadsheet file that contained the hourly data used to build the graph. An analysis of the hourly data shows:
Wind power collapsing from 9 GW to 5.45 GW between 6 pm and 11:59 pm on the 14th with natural gas ramping from 41 GW to 43 GW during the same period.
Wind power falling from 5.45 GW to 0.65 GW between 12:01 am and 8:00 pm on the 15th with natural gas spiking down from 40.4 GW to 33 GW between 2 am and 3 am as excess demand caused a cascade of safety events that took gas-fired plants offline.
Coal power falling from 11.1 GW to 7.65 GW between 2:00 am and 3:00 pm on the 15th as storm-related demand overwhelmed generating capacity.
Nuclear power falling from 5.1 GW to 3.8 GW at 7:00 am on the 15th as storm-related demand overwhelmed generating capacity.
The following table summarizes the capacity losses of each class of generating assets.
The Great Texas Blackout of 2021 was a classic domino-effect chain reaction where unreliable wind power experienced a 40% failure before gas-fired power plants began to buckle under the strain of an unprecedented winter storm. There were plenty of failures by the time the dust settled, but ERCOT’s reckless reliance on unreliable wind power set up the chain of dominoes that brought untold suffering and death to Texas residents.
The graph clearly shows that during their worst-performing hours:
Natural gas power plants produced at least 60.2% of the power available to Texas consumers, or 97% of their relative contribution to power supplies at 6:00 pm on Valentine’s day;
Coal-fired power plants produced at least 15.6% of the power available to Texas consumers, or 95% of their relative contribution to power supplies at 6:00 pm on Valentine’s day;
Nuclear power plants produced at least 7.5% of the power available to Texas consumers, or 97% of their relative contribution to power supplies at 6:00 pm on Valentine’s day; and
Wind power plants produced 1.5% of the power available to Texas consumers, or 11% of their relative contribution to power supplies at 6:00 pm on Valentine’s day; and
Solar power plants did what solar power plants do and had no meaningful impact.
Conclusion
Now that temperatures have moderated, things are getting back to normal, and The Great Texas Blackout of 2021 is little more than an unpleasant memory. While some Texas consumers are up in arms over blackout-related injuries, the State has rebounded, and many of us believe a few days of inconvenience is a fair price to pay for decades of cheap electric power. I think the inevitable investigations and public hearings will be immensely entertaining. I hope they lead to modest reforms of the free-wheeling ERCOT market that prevent irresponsible action from low-cost but wildly unreliable electricity producers from wind turbines.
Over the last year, wind stocks like Vestas Wind Systems (VWDRY) TPI Composites (TPIC) Northland Power (NPIFF), American Superconductor (AMSC), and NextEra Energy (NEE) have soared on market expectations of unlimited future growth. As formal investigations into the root cause of The Great Texas Blackout of 2021 proceed to an inescapable conclusion that unreliable wind power is not suitable for use in advanced economies, I think market expectations are likely to turn and turn quickly. I won’t be surprised if the blowback from The Great Texas Blackout of 2021 rapidly bleeds over to other overvalued sectors that rely on renewables as the heart of their raison d’etre, including vehicle electrification.
JUST IN – U.S. Supreme Court refuses to review #Pennsylvania election cases. No standing before an election, moot after. Justices Alito, Gorsuch, and Thomas dissent from the denial. Since it only takes 4 justices to hear a case, these cases were only one vote away from getting a full hearing at the SCOTUS. (Source: Disclose.tv tweet) Excerpts in italics with my bolds from dissenting opinions. Full text available at Gateway Pundit post Supreme Court Refuses to Review Pennsylvania Election Cases – Alito, Gorsuch and Thomas Dissent.
Justice Thomas:
Changing the rules in the middle of the game is bad enough. Such rule changes by officials who may lack authority to do so is even worse. When those changes alter election results, they can severely damage the electoral system on which our self-governance so heavily depends. If state officials have the authority they have claimed, we need to make it clear. If not, we need to put an end to this practice now before the consequences become catastrophic.
Because the judicial system is not well suited to address these kinds of questions in the short time period available immediately after an election, we ought to use available cases outside that truncated context to address these admittedly important questions. Here, we have the opportunity to do so almost two years before the next federal election cycle. Our refusal to do so by hearing these cases is befuddling. There is a clear split on an issue of such great importance that both sides previously asked us to grant certiorari. And there is no dispute that the claim is sufficiently meritorious to warrant review. By voting to grant emergency relief in October, four Justices made clear that they think petitioners are likely to prevail. Despite pressing for review in October, respondents now ask us not to grant certiorari because they think the cases are moot. That argument fails.
The issue presented is capable of repetition, yet evades review. This exception to mootness, which the Court routinely invokes in election cases, “applies where (1) the challenged action is in its duration too short to be fully litigated prior to cessation or expiration, and (2) there is a reasonable expectation that the same complaining party will be subject to the same action again.”
And there is a reasonable expectation that these petitioners—the State Republican Party and legislators—will again confront non legislative officials altering election rules. In fact, various petitions claim that no fewer than four other decisions of the Pennsylvania Supreme Court implicate the same issue. Future cases will arise as lower state courts apply those precedents to justify intervening in elections and changing the rules.
One wonders what this Court waits for. We failed to settle this dispute before the election, and thus provide clear rules. Now we again fail to provide clear rules for future elections. The decision to leave election law hidden beneath a shroud of doubt is baffling. By doing nothing, we invite further confusion and erosion of voter confidence. Our fellow citizens deserve better and expect more of us. I respectfully dissent.
Justice Alito, joined by Justice Gorsuch:
Now, the election is over, and there is no reason for refusing to decide the important question that these cases pose. . .A decision in these cases would not have any implications regarding the 2020 election. . . But a decision would provide invaluable guidance for future elections.
Some respondents contend that the completion of the 2020 election rendered these cases moot and that they do not fall within the mootness exception for cases that present questions that are “capable of repetition” but would other-wise evade review. They argue that the Pennsylvania Supreme Court’s decision “arose from an extraordinary and unprecedented confluence of circumstances”—specifically, the COVID–19 pandemic, an increase in mail-in voting, and Postal Service delays—and that such a perfect storm is not likely to recur.
That argument fails for three reasons. First, it does not acknowledge the breadth of the Pennsylvania Supreme Court’s decision. That decision claims that a state constitutional provision guaranteeing “free and equal” elections gives the Pennsylvania courts the authority to override even very specific and unambiguous rules adopted by the legislature for the conduct of federal elections. . .That issue is surely capable of repetition in future elections. Indeed, it would be surprising if parties who are unhappy with the legislature’s rules do not invoke this decision and ask the state courts to substitute rules that they find more advantageous.
Second, the suggestion that we are unlikely to see a recurrence of the exact circumstances we saw this fall misunderstands the applicable legal standard. In order for a question to be capable of repetition, it is not necessary to predict that history will repeat itself at a very high level of specificity.
Third, it is highly speculative to forecast that the Pennsylvania Supreme Court will not find that conditions at the time of a future federal election are materially similar to those last fall. The primary election for Pennsylvania congressional candidates is scheduled to occur in 15 months,and the rules for the conduct of elections should be established well in advance of the day of an election. . .As voting by mail becomes more common and more popular, the volume of mailed ballots may continue to increase and thus pose delivery problems similar to those anticipated in 2020.
For these reasons, the cases now before us are not moot. There is a “reasonable expectation” that the parties will face the same question in the future. . ., and that the question will evade future pre-election review, just as it did in these cases.These cases call out for review, and I respectfully dissent from the Court’s decision to deny certiorari.
Background: SCOTUS Conference on Election Integrity
Election Integrity is up for conference at SCOTUS on Friday. The petition to be discussed is the complaint by the Pennsylvania legislature against the state Election Officer Boockvar, a proceeding that began on Sept. 28, 2020. The petition makes clear the intent is not to overturn any completed election, but to ensure future elections are conducted according to laws in force. From scotusblog:
Republican Party of Pennsylvania v. Boockvar
Issue: Whether the Pennsylvania Supreme Court usurped the Pennsylvania General Assembly’s plenary authority to “direct [the] Manner” for appointing electors for president and vice president under Article II of the Constitution, as well as the assembly’s broad power to prescribe “[t]he Times, Places, and Manner” for congressional elections under Article I, when the court issued a ruling requiring the state to count absentee ballots that arrive up to three days after Election Day as long as they are not clearly postmarked after Election Day; and (2) whether that decision is preempted by federal statutes that establish a uniform nationwide federal Election Day.
The petition to be discussed is the December 15, 2020 brief from the petitioners Republican Party:
Respondents’ Oppositions only confirm what some
Respondents told the Court just weeks ago: that the Court should grant review and resolve the important and recurring questions presented in this case. Pa.
Dems. Br. 9, No. 20A54 (Oct. 5, 2020) (advocating for
review because the questions presented are “of overwhelming importance for States and voters across the country”); Sec’y Br. 2-3, No. 20A54 (Oct. 5, 2020).
Respondents uniformly fail to mention that after the
Republican Party of Pennsylvania (RPP) filed its
Petition but more than a month before Respondents
filed their Oppositions, the Eighth Circuit created a split on the question whether the Electors Clause constrains state courts from altering election deadlines enacted by state legislatures. See Carson v.
Simon, 978 F.3d 1051 (8th Cir. 2020). Instead,
Respondents seek to obfuscate the matter with a
welter of vehicle arguments turning on the fact that
Pennsylvania has certified the results of the 2020
general election. In reality, however, this case is an ideal vehicle, in part precisely because it will not affect the outcome of this election.
Indeed, this Court has repeatedly emphasized the imperative of settling the governing rules in advance
of the next election, in order to promote the public “[c]onfidence in the integrity of our electoral processes
[that] is essential to the functioning of our
participatory democracy.” Purcell v. Gonzalez, 549
U.S. 1, 4 (2006). This case presents a vital and unique
opportunity to do precisely that. By resolving the
important and recurring questions now, the Court can provide desperately needed guidance to state legislatures and courts across the country outside the
context of a hotly disputed election and before the next
election. The alternative is for the Court to leave legislatures and courts with a lack of advance guidance and clarity regarding the controlling law—
only to be drawn into answering these questions in
future after-the-fact litigation over a contested
election, with the accompanying time pressures and
perceptions of partisan interest.
Note: As reported in Gateway Pundit, legally required chain of custody for ballots was broken in every battleground state and in other states as well.
President Trump was ahead in Pennsylvania by nearly 700,000 votes. In Michigan Trump was ahead by over 300,000 votes. In Wisconsin Trump was ahead by 120,000 votes.
Trump was also ahead in Georgia and Nevada.
And President Trump already trounced Joe Biden in Ohio, Florida, and Iowa — three states that ALWAYS go to the eventual presidential winner.
Then suddenly Pennsylvania, Michigan, and Wisconsin announced they would not be announcing their winner that night. This was an unprecedented and coordinated move in US history.
Then many crimes occurred to swing the election to Biden, but perhaps the greatest crime was the lack of dual controls and chain of custody records that ensure a fair and free election. At a high level, when ballots are transferred or changes are made in voting machines, these moves and changes should be done with two individuals present (dual control), one from each party, and the movements of ballots should be recorded.
So when states inserted drop boxes into the election, these changes first needed to be updated through the legislature, which they weren’t, and all movements from the time when the ballots were inserted into drop boxes needed to be recorded, which they weren’t.
Vaccination rates in Texas and other states have been increasing while hospitalizations are plunging. About one in five adults in Texas has received at least one dose of the Pfizer or Moderna vaccine. Most are seniors and people with health conditions who are at highest risk of severe illness. Hospitalizations in Texas have fallen more than 60% since a mid-January peak.
Politicians created a box canyon with lockdowns last spring that were originally intended to “flatten the curve.” But then every time governors loosened restrictions and cases ticked up, Democrats would demand lockdowns. Not that lockdowns (or mask mandates) much helped California or New York, which experienced bigger surges this winter than Florida did with neither.
Background from Previous Post Immunity by Easter?
Could it be that doors and societies will open and life be reborn as early as Easter 2021? That depends upon lockdown politicians and scientists who advise them. One such is Dr. Makary, a professor at the Johns Hopkins School of Medicine and Bloomberg School of Public Health, chief medical adviser to Sesame Care, and author of “The Price We Pay.”. His article at Wall Street Journal is We’ll Have Herd Immunity by April. Excerpts in italics with my bolds.
Covid cases have dropped 77% in six weeks. Experts should level with the public about the good news.
Amid the dire Covid warnings, one crucial fact has been largely ignored: Cases are down 77% over the past six weeks. If a medication slashed cases by 77%, we’d call it a miracle pill.Why is the number of cases plummeting much faster than experts predicted?
In large part because natural immunity from prior infection is far more common than can be measured by testing.
Testing has been capturing only from 10% to 25% of infections, depending on when during the pandemic someone got the virus. Applying a time-weighted case capture average of 1 in 6.5 to the cumulative 28 million confirmed cases would mean about 55% of Americans have natural immunity.
Now add people getting vaccinated. As of this week, 15% of Americans have received the vaccine, and the figure is rising fast. Former Food and Drug Commissioner Scott Gottlieb estimates 250 million doses will have been delivered to some 150 million people by the end of March.
There is reason to think the country is racing toward an extremely low level of infection. As more people have been infected, most of whom have mild or no symptoms, there are fewer Americans left to be infected. At the current trajectory, I expect Covid will be mostly gone by April, allowing Americans to resume normal life.
Antibody studies almost certainly underestimate natural immunity. Antibody testing doesn’t capture antigen-specific T-cells, which develop “memory” once they are activated by the virus. Survivors of the 1918 Spanish flu were found in 2008—90 years later—to have memory cells still able to produce neutralizing antibodies.
Researchers at Sweden’s Karolinska Institute found that the percentage of people mounting a T-cell response after mild or asymptomatic Covid-19 infection consistently exceeded the percentage with detectable antibodies. T-cell immunity was even present in people who were exposed to infected family members but never developed symptoms. A group of U.K. scientists in September pointed out that the medical community may be under-appreciating the prevalence of immunity from activated T-cells.
Covid-19 deaths in the U.S. would also suggest much broader immunity than recognized. About 1 in 600 Americans has died of Covid-19, which translates to a population fatality rate of about 0.15%. The Covid-19 infection fatality rate is about 0.23%. These numbers indicate that roughly two-thirds of the U.S. population has had the infection.
In my own conversations with medical experts, I have noticed that they too often dismiss natural immunity, arguing that we don’t have data. The data certainly doesn’t fit the classic randomized-controlled-trial model of the old-guard medical establishment. There’s no control group. But the observational data is compelling.
I have argued for months that we could save more American lives if those with prior Covid-19 infection forgo vaccines until all vulnerable seniors get their first dose. Several studies demonstrate that natural immunity should protect those who had Covid-19 until more vaccines are available. Half my friends in the medical community told me: Good idea. The other half said there isn’t enough data on natural immunity, despite the fact that reinfections have occurred in less than 1% of people—and when they do occur, the cases are mild.
But the consistent and rapid decline in daily cases since Jan. 8 can be explained only by natural immunity. Behavior didn’t suddenly improve over the holidays; Americans traveled more over Christmas than they had since March. Vaccines also don’t explain the steep decline in January. Vaccination rates were low and they take weeks to kick in.
My prediction that Covid-19 will be mostly gone by April is based on laboratory data, mathematical data, published literature and conversations with experts. But it’s also based on direct observation of how hard testing has been to get, especially for the poor. If you live in a wealthy community where worried people are vigilant about getting tested, you might think that most infections are captured by testing. But if you have seen the many barriers to testing for low-income Americans, you might think that very few infections have been captured at testing centers. Keep in mind that most infections are asymptomatic, which still triggers natural immunity.
Many experts, along with politicians and journalists, are afraid to talk about herd immunity. The term has political overtones because some suggested the U.S. simply let Covid rip to achieve herd immunity. That was a reckless idea. But herd immunity is the inevitable result of viral spread and vaccination. When the chain of virus transmission has been broken in multiple places, it’s harder for it to spread—and that includes the new strains.
Herd immunity has been well-documented in the Brazilian city of Manaus, where researchers in the Lancet reported the prevalence of prior Covid-19 infection to be 76%, resulting in a significant slowing of the infection. Doctors are watching a new strain that threatens to evade prior immunity. But countries where new variants have emerged, such as the U.K., South Africa and Brazil, are also seeing significant declines in daily new cases. The risk of new variants mutating around the prior vaccinated or natural immunity should be a reminder that Covid-19 will persist for decades after the pandemic is over. It should also instill a sense of urgency to develop, authorize and administer a vaccine targeted to new variants.
Some medical experts privately agreed with my prediction that there may be very little Covid-19 by April but suggested that I not to talk publicly about herd immunity because people might become complacent and fail to take precautions or might decline the vaccine. But scientists shouldn’t try to manipulate the public by hiding the truth. As we encourage everyone to get a vaccine, we also need to reopen schools and society to limit the damage of closures and prolonged isolation. Contingency planning for an open economy by April can deliver hope to those in despair and to those who have made large personal sacrifices.
One of the few pleasures remaining during pandemania involves sports competitions where rules are followed and enforced by unbiased officials, so that teams or individuals win or lose based solely on the merit of their performances. Elsewhere with identity politics and political correctness, it is a different story. People on the right perceive accurately that their opponents on the left are not bound by the rules, and break them readily in order to win.
America is divided into two political teams; Team Right and Team Left. As Joe Biden and Kamala Harris assume office, many Team Right members are still trying to come to terms with the results of the 2020 election. They feel certain that Team Left cheated in a variety of ways in order to produce enough votes to secure victory.
Setting aside the MSM’s agreed-upon talking points of “baseless accusations” of election fraud and their “despite there being no evidence to support such claims” mantra, we now know that there was significant evidence of election tampering. That is actually a “fact” about which I’ve previously written. It is also, at this point, irrelevant. Joe Biden is in office. Focusing on 2020 election cheating is fine for investigators in various states if they so choose (there will be no federal investigation), but it is not helpful for ordinary citizens who would like to reverse trends.
The more helpful issue to explore in order to make a difference going forward is in answering this question: Why do Team Left members seem to be more willing to cheat than do Team Right members?
This is a question, I believe, that we can answer without needing any sort of physical proof. We can prove it solely through the use of our reason and with a clear understanding of the ethical structure, and attendant influences on behavior, of modern-day Team Left members (many of whom were election officials and vote counters).
When the typical person says they are “ethical,” they really mean that in their mind the things they do are the right things to do. This suggests a sort of self-legislating capability on the part of each person to know right from wrong. An idea like this can be found in the work of famous philosophers ranging from Immanuel Kant, to Karl Marx, to many others. They argue that each person is capable of such self-legislating and engage in the process constantly.
Very few people realize that there are actual ethical systems that have been “constructed” to help direct us on the path to making consistent and appropriate decisions as to how to act and behave in any given situation. We have the above-referenced Kant’s categorical imperative (if what I’m thinking of doing now were a rule that everyone had to follow, would it be workable for society?). We have Jeremy Bentham’s utilitarianism (pure cost-benefit analysis) or John Stuart Mill’s more refined and kinder version, which calls for for cost-benefit analysis with an allowance for the subjective nature of “higher” human values.
There are a number of ways to view the development and deployment of moral and ethical behavior, but the typical person knows little, if any, of this. Yet they will tell you that they are ethical, and others are not. By what standard? How do they know? This logical dilemma, by the way, exists in people whether they were supporters of Donald Trump or Joe Biden; whether they are members of Team Right or Team Left. There is absolutely no difference in that respect. There is a difference we will get to eventually, but it does not involve ethics.
Hobbes was right!
It is my opinion, based upon many years of studying political philosophy, working in a large corporate environment, working with and running privately owned businesses, and doing political advising and writing, that the greatest of all the political philosophers, the one who got the most important thing right, was Englishman Thomas Hobbes. Born in 1588, the year of the Spanish Armada, it is said that his mother went into premature labor upon seeing the ships off the English coast, thereby birthing poor Thomas out of fear.
Hobbes spent the rest of his life focusing on the fearful nature of humans, among other things.
He is the father of social contract theory, which describes man’s compact to enter into civil society as a way to control his more primitive impulses. He is famous for his line about man’s life in the state of nature, before the social contract, which he describes as being “solitary, poor, nasty, brutish, and short.” Hobbes suggested that, owing to their nature, men are unable to be left to govern themselves without stern direction. His diagnosis of us as people? Fearful and self-destructive. His prescription? A strong sovereign.
Hobbes is also the father of the idea of moral relativism. His contention is that, for the typical human, their calculation of whether or not something is “right or wrong” is nothing more than a reduction to looking at things that please them and things that offend them. They maximize the one and avoid the other. In that process, they create their own morality, or set of ethics, that is based solely upon their own desires and aversions.
My own fifty-eight years of study and empirical observations have led me to conclude that this theory of human behavior and ethical development most accurately describes the greatest number of people Assuming a human population existing under a bell curve, Hobbes’s ethical construct describes the greatest number of people gathered around the mean.
At this point you might think I’m suggesting that Biden supporters, Team Left members, are moral relativists and Trump supporters, Team Right members, are not. That somehow I believe we are inherently better creatures than are they. You’d be wrong. I am not. I believe that most people are moral relativists in general, and even that people who attempt to operate under a more disciplined structure of ethics, including the Christian ethic, can become moral relativists at the very moment that they find themselves placed most at risk.
Survival is in our nature. When it is in jeopardy, even the most truly righteous can attempt to hedge their ethical bets.
Since I am concluding that there is no fundamental difference in ethics between the typical Trump or the typical Biden supporter, why go through all the trouble to share this background on ethics? After all, the purpose is to demonstrate how we can prove that Team Left members are more likely to cheat. I walked through the ethical piece because people typically consider cheating to be “unethical.” Yet it happens, and it happens more by their team than by ours.
To understand why, I believe we need to look beyond ethics and consider Tom Hanks, World War II, and the ancient Stoics.
Duty as a differentiator
Love or hate his personal life and politics, Tom Hanks makes spectacular movies and is especially good in war roles. A few months back, I had a chance to watch him in the Apple Television release of Greyhound. It is a story based on the U.S. Navy convoys that brought supplies and armaments across the Atlantic during World War II. It is not a long film, but it is nonstop action packed. For ninety minutes, there is nothing but German U-boat peril. American sailors show incredible courage, some losing their lives, others saving lives, up against challenging odds.
What happens to make men so courageous in one moment and so devoid of any kind of ethical or moral compass in the next? I think the answer lies in the notion of duty. Those men on the ship with Tom Hanks in that movie were driven in those moments by a higher calling. They had a sense of duty. Some, when they returned home, for whatever reason might have lost their way; found themselves left with no higher calling. Absent duty, they were left with only their own personal moral and ethical framework in which to operate. Given moral relativism, they became able to justify almost any behavior.
This notion of duty is a very Stoic concept. Stoicism, which dates back to Ancient Greece, emphasizes duty and the importance of virtue. There were four attributes of virtue: wisdom, justice, courage, and moderation. Doing one’s duty was central to the Stoics. Duty manifested itself in more than just following orders; it meant adhering to the four key elements of virtue and to keeping in sync with all of nature.
One does not have to buy into all of Stoic philosophy to grasp the importance of duty. It is with duty that we can begin to answer our question: How can we know that Team Left members will cheat?
The answer lies in the absence of a sense of duty to something outside themselves. The typical contemporary Team Left member does not have any external force that commands him or her to “behave better.”
Again, operating under the bell curve, the mainstream Trump supporter tries to follow either the voice of God, the call of patriotism, or both. Both are external to themselves. Both set standards for behavior that transcend their own personal calculations of convenience. Both provide fairly clear direction, either through Scripture or the Constitution. Both rest like weights upon their shoulders, burdening them with a non-ignorable sense of obligation.
It doesn’t mean they won’t fail. It doesn’t mean they will not behave badly. It simply means they have a better chance of making a better choice than does a person who is not encumbered by any sense of duty other than to themselves. Duty is typically viewed as a call to act. It can just as easily be seen as the antithesis to action, which means it can inhibit. I must because it’s my duty. I must not because it betrays my duty.
Common responses I have received from Team Left members over the years when I ask them about feeling a sense of duty include:
• I have a duty to those around me.
• I have a duty to those less fortunate than myself.
• I have a duty to humanity.
The shared characteristic of each of those “duties” is that although they sound as if they reside “outside” the individual, they are wholly subjective with regard to their definition. Each individual person gets to define their “duty to others” however they see fit. There is no separate standard. For those focused on a Christian duty, there is the reasonable clarity of the Bible. For those who pledge allegiance to the United States of America, there is our Constitution bolstered by the original Declaration of Independence.
For those, however, who say that they simply have a duty to help “others,” the others can be whomever they so choose, and need whatever kind of help it is the helper decides they should provide.
Machiavelli provides the final element
To succinctly summarize my thoughts to this point, it is my personal belief that the members of Team Right are not inherently any more ethical than are their counterparts on Team Left. When it comes right down to it, individual to individual, most people are basic moral relativists as identified and defined by Hobbes, and given no other considerations, most people conduct themselves under an ethical code that is simply one of convenience.
The difference between the two is that those who answer to a calling of duty that is outside themselves and more objective than subjective in nature can have their individual passions held in check. It gives their better angels a chance to be heard and followed.
Machiavelli’s statement about ends and means explains why the modern-day Team Left member, almost always a Democrat, is so willing to cheat. Existing as a typical moral relativist where little to nothing is malum in se, and being for the most part unconstrained by a sense of duty other than that which they conveniently self-define, any sort of activity is permissible so long as they end up getting what they want. They give cover to this behavior by saying their actions are necessary to “help others.” As has been shown, that statement can mean whatever they want it to mean.
By our nature as humans, we are flawed and sinful creatures. That goes for Trump supporters as well as those who lined up behind Joe Biden. The difference is that for those of us who truly have a good old-fashioned love for God, country, or both, we have a voice outside ourselves warning us to control our nature. It asks us to heed a higher calling. It limits us in a way that is beneficial to maintaining an ordered, predictable, and just society.
Those who operate without that sense of duty are left to do whatever their free will wishes, unbound by any real constraints. They can justify their actions through the simple pleasure they feel or the pain they avoid. Their ends always can justify their means. That is why they cheat. That is how we can use our reason to know they cheat.
Postscript: Dennis Prager sees the left/right distinction in terms of focus on politics vs. persons.
That’s a major difference between the right and the left, concerning the way each seeks to improve society.Conservatives believe that the way to a better society is almost always through the moral improvement of the individual by each person doing battle with his or her own weaknesses, and flaws. It is true that in violent and evil society such as fascist Communist or Islam is tyrannies, the individual must be preoccupied with battling outside forces. Almost everywhere else, though, certainly in a free and decent country such as America, the greatest Battle of the individual must be with inner forces, that is with his or her moral failings.
The left on the other hand, believes that the way to a better society is almost always through doing battle with society’s moral failings. Thus, in America, the left concentrates its efforts on combating sexism, racism, intolerance, xenophobia, homophobia, Islamophobia, and the many other evils that the left believes permeate American society.
One important consequence of this left right distinction is that those on the left are far more preoccupied with politics than those on the Right. Since the left is so much more interested in fixing society than in fixing the individual, politics inevitably becomes the vehicle for societal improvement. That’s why whenever the term activist is used, we almost always assume that the term refers to someone on the left.
This update is to note a dramatic effect on Okhotsk Sea ice coincidental with the Polar Vortex event that froze Texas and other midwestern US states. When Arctic air extends so far south due to the weak and wavy vortex, warmer air replaces the icy air in Arctic regions. In this case, the deficits to sea ice extent appear mostly in the Sea of Okhotsk in the Pacific.
The graph below shows a sharp drop in ice extent the last three days.
A closer look into the regions shows that Okhotsk peaked at 1.1M km2 on day 37, and lost 217k km2 down to 0.9M km2 yesterday. That loss along with Bering flat extent makes up 70% of the present deficit to average.
I have been writing how the stratospheric PV disruption that has been so influential on our weather since mid-January has been unusual and perhaps even unique in the observational record, so I guess then it should be no surprise that it’s ending is also highly unusual. I was admittedly skeptical, but it does seem that the coupling between the stratospheric PV and the tropospheric circulation is about to come to an abrupt end.
The elevated polar cap geopotential height anomalies (PCHs) related to what I like to refer to the third and final PV disruption at the end of January/early February quickly propagates to the surface and even amplifies, peaking this past weekend. And as I have argued, it is during spikes in PCH when severe winter is most likely across the NH mid-latitudes, as demonstrated in Cohen et al. (2018).
But rather than the typical gradual influence from the stratospheric PV disruption over many weeks, maybe akin to the drip, drip, drip of a leaky faucet, the entire signal dropped all at once like an anchor. This also likely contributed to the severity of the current Arctic outbreak in the Central US that is generational and even historical in its severity. But based on the forecast the PV gave all it had all at once, and the entire troposphere-stratosphere-troposphere coupling depicted in Figure ii is about to abruptly end in the next few days.
I am hesitant to bring analogs before 2000 but the extreme cold in Texas did remind me of another winter that brought historic Arctic outbreaks including cold to Texas – January 1977. It does appear that the downward influence from the stratospheric PV to the surface came to an abrupt end at the end of January 1977 . . . Relative to normal, January 1977 was the coldest month for both Eurasia and the US when stratosphere-troposphere coupling was active. But the relative cold did persist in both the Eastern US and northern Eurasia in February post the stratosphere-troposphere coupling. By March the cold weather in the Eastern US was over but persisted for northern Eurasia.
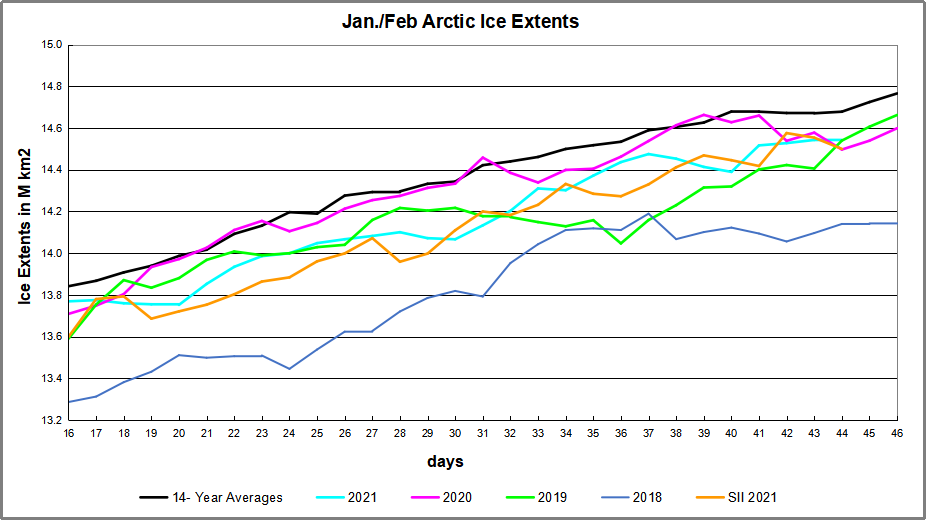
In January, most of the Arctic ocean basins are frozen over, and so the growth of ice extent slows down. According to SII (Sea Ice Index) January on average adds 1.3M km2, and this month it was 1.4M. (background is at Arctic Ice Year-End 2020). The few basins that can grow ice this time of year tend to fluctuate and alternate waxing and waning, which appears as a see saw pattern in these images.
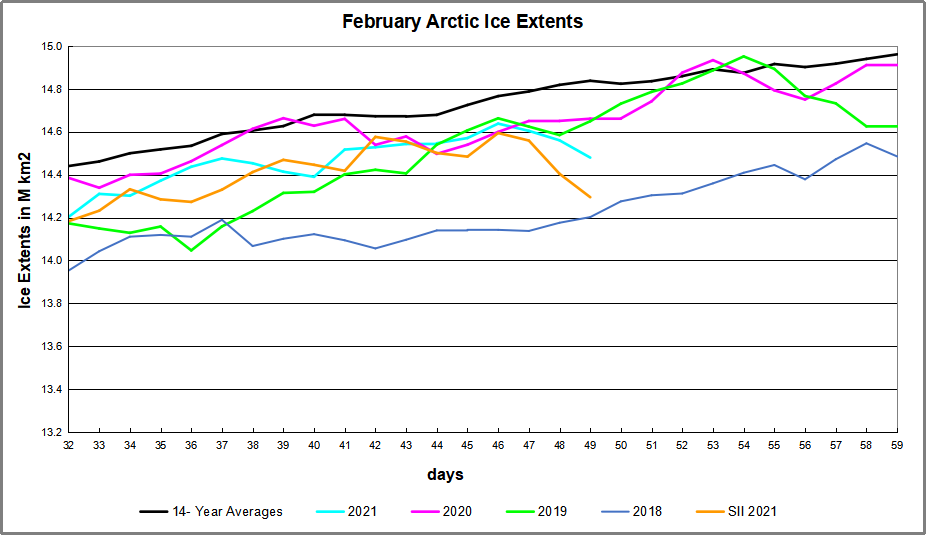
Two weeks into February Arctic ice extents are growing faster than the 14-year average, such that they are approaching the mean. The graph below shows the ice recovery since mid-January for 2021, the 14-year average and several recent years.
The graph shows mid January a small deficit to average, then slow 2021 growth for some days before picking up the pace in the latter weeks. Presently extents are slightly (1%) below average, close to 2019 and 2020 and higher than 2018.
February Ice Growth Despite See Saws in Atlantic and Pacific
As noted above, this time of year the Arctic adds ice on the fringes since the central basins are already frozen over. The animation above shows Barents Sea on the right (Atlantic side) grew in the last two weeks by 175k km2 and is now 9% greater than the maximum last March. Meanwhile on the left (Pacific side) Bering below and Okhotsk above wax and wane over this period. Okhotsk is seen growing 210k km2 the first week, and giving half of it back the second week. Bering waffles up and down ending sightly higher in the end.
The table below presents ice extents in the Arctic regions for day 44 (Feb. 13) compared to the 14 year average and 2018.
Region
2021044
Day 044 Average
2021-Ave.
2018044
2021-2018
(0) Northern_Hemisphere
14546503
14678564
-132061
14140166
406337
(1) Beaufort_Sea
1070689
1070254
435
1070445
244
(2) Chukchi_Sea
966006
965691
315
965971
35
(3) East_Siberian_Sea
1087120
1087134
-14
1087120
0
(4) Laptev_Sea
897827
897842
-15
897845
-18
(5) Kara_Sea
934988
906346
28642
874714
60274
(6) Barents_Sea
837458
563224
274235
465024
372434
(7) Greenland_Sea
645918
610436
35482
529094
116824
(8) Baffin_Bay_Gulf_of_St._Lawrence
1057623
1487547
-429924
1655681
-598058
(9) Canadian_Archipelago
854597
853146
1451
853109
1489
(10) Hudson_Bay
1260471
1260741
-270
1260838
-367
(11) Central_Arctic
3206263
3211892
-5630
3117143
89120
(12) Bering_Sea
559961
674196
-114235
319927
240034
(13) Baltic_Sea
116090
94341
21749
76404
39686
(14) Sea_of_Okhotsk
1027249
930357
96892
911105
116144
(15) Yellow_Sea
9235
28237
-19002
33313
-24078
(16) Cook_Inlet
223
11137
-10914
11029
-10806
The table shows that Bering defict to average is offset by surplus in Okhotsk. Baffin Bay show the largest deficit, mostly offset by surpluses in Barents, Kara and Greenland Sea.
The polar bears have a Valentine Day’s wish for Arctic Ice.
And Arctic Ice loves them back, returning every year so the bears can roam and hunt for seals.
Footnote:
Seesaw accurately describes Arctic ice in another sense: The ice we see now is not the same ice we saw previously. It is better to think of the Arctic as an ice blender than as an ice cap, explained in the post The Great Arctic Ice Exchange.
WASHINGTON, D.C.—In a historic move, the U.S. Senate decided to switch to voting by mail for Trump’s second impeachment trial. After all the votes were counted by an intern in a back room with no cameras, the Senate ruled to convict President Trump of incitement to violence by a vote of 8275 to 3.
“Our holy democracy has spoken,” said Senator Chuck Schumer. “Do not ask any questions or you are a blasphemer against the sacred sacredness of our vote. Everyone can go home now!”
A couple of troublemaking Senators attempted to overthrow the Constitution by bringing up the point that there are only 100 Senators, making it impossible to arrive at a tally of 8275 to 3, but they were quickly removed from the Senate Chambers and condemned for “attempting to suppress the votes of people of color.”
The Senate then moved on to other business, passing universal healthcare by a margin of 320,000 to 4.
Footnote: SCOTUS Conference on Election Integrity
Humor aside, Election Integrity is up for conference at SCOTUS on Friday. The petition to be discussed is the complaint by the Pennsylvania legislature against the state Election Officer Boockvar, a proceeding that began on Sept. 28, 2020. The petition makes clear the intent is not to overturn any completed election, but to ensure future elections are conducted according to laws in force. From scotusblog:
Republican Party of Pennsylvania v. Boockvar
Issue: Whether the Pennsylvania Supreme Court usurped the Pennsylvania General Assembly’s plenary authority to “direct [the] Manner” for appointing electors for president and vice president under Article II of the Constitution, as well as the assembly’s broad power to prescribe “[t]he Times, Places, and Manner” for congressional elections under Article I, when the court issued a ruling requiring the state to count absentee ballots that arrive up to three days after Election Day as long as they are not clearly postmarked after Election Day; and (2) whether that decision is preempted by federal statutes that establish a uniform nationwide federal Election Day.
The petition to be discussed is the December 15, 2020 brief from the petitioners Republican Party:
Respondents’ Oppositions only confirm what some
Respondents told the Court just weeks ago: that the Court should grant review and resolve the important and recurring questions presented in this case. Pa.
Dems. Br. 9, No. 20A54 (Oct. 5, 2020) (advocating for
review because the questions presented are “of overwhelming importance for States and voters across the country”); Sec’y Br. 2-3, No. 20A54 (Oct. 5, 2020).
Respondents uniformly fail to mention that after the
Republican Party of Pennsylvania (RPP) filed its
Petition but more than a month before Respondents
filed their Oppositions, the Eighth Circuit created a split on the question whether the Electors Clause constrains state courts from altering election deadlines enacted by state legislatures. See Carson v.
Simon, 978 F.3d 1051 (8th Cir. 2020). Instead,
Respondents seek to obfuscate the matter with a
welter of vehicle arguments turning on the fact that
Pennsylvania has certified the results of the 2020
general election. In reality, however, this case is an ideal vehicle, in part precisely because it will not affect the outcome of this election.
Indeed, this Court has repeatedly emphasized the imperative of settling the governing rules in advance
of the next election, in order to promote the public “[c]onfidence in the integrity of our electoral processes
[that] is essential to the functioning of our
participatory democracy.” Purcell v. Gonzalez, 549
U.S. 1, 4 (2006). This case presents a vital and unique
opportunity to do precisely that. By resolving the
important and recurring questions now, the Court can provide desperately needed guidance to state legislatures and courts across the country outside the
context of a hotly disputed election and before the next
election. The alternative is for the Court to leave legislatures and courts with a lack of advance guidance and clarity regarding the controlling law—
only to be drawn into answering these questions in
future after-the-fact litigation over a contested
election, with the accompanying time pressures and
perceptions of partisan interest.
Note: As reported in Gateway Pundit, legally required chain of custody for ballots was broken in every battleground state and in other states as well.
President Trump was ahead in Pennsylvania by nearly 700,000 votes. In Michigan Trump was ahead by over 300,000 votes. In Wisconsin Trump was ahead by 120,000 votes.
Trump was also ahead in Georgia and Nevada.
And President Trump already trounced Joe Biden in Ohio, Florida, and Iowa — three states that ALWAYS go to the eventual presidential winner.
Then suddenly Pennsylvania, Michigan, and Wisconsin announced they would not be announcing their winner that night. This was an unprecedented and coordinated move in US history.
Then many crimes occurred to swing the election to Biden, but perhaps the greatest crime was the lack of dual controls and chain of custody records that ensure a fair and free election. At a high level, when ballots are transferred or changes are made in voting machines, these moves and changes should be done with two individuals present (dual control), one from each party, and the movements of ballots should be recorded.
So when states inserted drop boxes into the election, these changes first needed to be updated through the legislature, which they weren’t, and all movements from the time when the ballots were inserted into drop boxes needed to be recorded, which they weren’t.
Martin Gurri tells the story how legacy print and tv news descended into deceit and rabble-rousing when faced with decline and eventual bankruptcy. His article Slouching Toward Post-Journalism at City Journal is a thorough and probing analysis, of which only some excerpts are posted here, in italics with my bolds and images. The journey of the NY Times exemplifies how and why mass media went from informing to inflaming the public.
The New York Times and other elite media outlets have openly embraced advocacy over reporting.
Traditional newspapers never sold news; they sold an audience to advertisers. To a considerable degree, this commercial imperative determined the journalistic style, with its impersonal voice and pretense of objectivity. The aim was to herd the audience into a passive consumerist mass. Opinion, which divided readers, was treated like a volatile substance and fenced off from “factual” reporting.
The digital age exploded this business model. Advertisers fled to online platforms, never to return. For most newspapers, no alternative sources of revenue existed: as circulation plummets to the lowest numbers on record, more than 2,000 dailies have gone silent since the turn of the century. The survival of the rest remains an open question.
Led by the New York Times, a few prominent brand names moved to a model that sought to squeeze revenue from digital subscribers lured behind a paywall. This approach carried its own risks. The amount of information in the world was, for practical purposes, infinite. As supply vastly outstripped demand, the news now chased the reader, rather than the other way around. Today, nobody under 85 would look for news in a newspaper.
Under such circumstances, what commodity could be offered for sale?
During the 2016 presidential campaign, the Times stumbled onto a possible answer. It entailed a wrenching pivot from a journalism of fact to a “post-journalism” of opinion—a term coined, in his book of that title, by media scholar Andrey Mir. Rather than news, the paper began to sell what was, in effect, a creed, an agenda, to a congregation of like-minded souls. Post-journalism “mixes open ideological intentions with a hidden business necessity required for the media to survive,” Mir observes. The new business model required a new style of reporting. Its language aimed to commodify polarization and threat: journalists had to “scare the audience to make it donate.” At stake was survival in the digital storm.
The experiment proved controversial. It sparked a melodrama over standards at the Times, featuring a conflict between radical young reporters and befuddled middle-aged editors. In a crucible of proclamations, disputes, and meetings, the requirements of the newspaper as an institution collided with the post-journalistic call for an explicit struggle against injustice.
The old media had needed happy customers. The goal of post-journalism, according to Mir, is to “produce angry citizens.” The August 2016 article marked the point of no return in the spiritual journey of the New York Times from newspaper of record to Vatican of liberal political furor. While the impulse originated in partisan herd instinct, the discovery of a profit motive would make the change irrevocable. Rutenberg professed to find the new approach “uncomfortable” and, “by normal standards, untenable”—but the fault, he made clear, lay entirely with the “abnormal” Trump, whose toxic personality had contaminated journalism. He was the active principle in the headline “The Challenge Trump Poses to Objectivity.”
A cynic (or a conservative) might argue that objectivity in political reporting was more an empty boast than a professional standard and that the newspaper, in pandering to its audience, had long favored an urban agenda, liberal causes, and Democratic candidates. This interpretation misses the transformation in the depths that post-journalism involved. The flagship American newspaper had turned in a direction that came close to propaganda. The oppositional stance, as Mir has noted, cannot coexist with newsroom independence: writers and editors were soon to be punished for straying from the cause. The news agenda became narrower and more repetitive as journalists focused on a handful of partisan controversies—an effect that Mir labeled “discourse concentration.” The New York Times, as a purveyor of information and a political institution, had cut itself loose from its own history.
[The Russia Collusion story] was one of the most extraordinary episodes in American politics—and the first sustained excursion into post-journalism by the American news media, led every step of the way by the New York Times.
Future media historians may hold the Trump-Russia story to be a laboratory-perfect specimen of discourse concentration. For nearly two years, it towered over the information landscape and devoured the attention of the media and the public. The total number of articles on the topic produced by the Times is difficult to measure, but a Google search suggests that it was more than 3,000—the equivalent, if accurate, of multiple articles per day for the period in question. This was journalism as if conducted under the impulse of an obsessive-compulsive personality. Virtually every report either implied or proclaimed culpability. Every day in the news marked the beginning of the Trumpian End Times.
The sum of all this sound and fury was . . . zero. The most intensively covered story in history turned out to be empty of content. Mueller’s investigation “did not identify evidence that any US persons conspired or coordinated” with the Russians. Mueller’s halting television appearance in July 2019 convinced even the most vehement partisans that he was not the knight to slay the dragon in the White House. After two years of media frenzy came an awkward moment. The New York Times had reorganized its newsroom to pursue this single story—yet, just as it had missed Trump’s coming, the paper failed to see that Trump would stay.
Yet what looked like journalistic failure was, in fact, an astonishing post-journalistic success. The intent of post-journalism was never to represent reality or inform the public but to arouse enough political fervor in readers that they wished to enter the paywall in support of the cause. This was ideology by the numbers—and the numbers were striking. Digital subscriptions to the New York Times, which had been stagnant, nearly doubled in the first year of Trump’s presidency. By August 2020, the paper had 6 million digital subscribers—six times the number on Election Day 2016 and the most in the world for any newspaper.
The Russian collusion story, though refuted objectively, had been validated subjectively, by the growth in the congregation of the paying faithful.
In throwing out the old textbook, post-journalism made transgression inevitable. In July 2019, Jonathan Weisman, who covered Congress for the Times and happened to be white, questioned on Twitter the legitimacy of leftist members of the House who happened to be black. Following criticism, Weisman deleted the offending tweets and apologized elaborately, but he was demoted nonetheless.
The dramatic confrontation had been triggered by Weisman’s tweets and the heretical headline but was really about the boundaries of expression—what was allowed and what was taboo—in a post-objective, post-journalistic time. On the contentious subjects of Trump and race, managers and reporters at the paper appeared to hold similar opinions. No one in the room defended Trump as a normal politician whose views deserved a hearing.No one questioned the notion that the United States, having elected Trump, was a fundamentally racist country. But as Baquet fielded long and pointed questions from his staff, it became clear that management and newsroom—which translated roughly to middle age and youth—held radically divergent visions of the post-journalism future.
Unlike management, the reporters were active on social media, where they had to face the most militant elements of the subscriber base. In this way, they represented the forces driving the information agenda. Baquet had disparaged Twitter and insisted that the Times would not be edited by social media. He was mistaken. The unrest in the newsroom had been propelled by outrage on the web, and the paper had quickly responded. Generational attitudes, displayed on social media, allowed no space for institutional loyalty. Baquet had demoted Weisman because of his inappropriate behavior—but the newsroom turned against him because he had picked a fight with the wrong enemy.
Two days after the town hall meeting, the New York Times inaugurated, in its magazine section, the “1619 Project”—an attempt, said Baquet, “to try to understand the forces that led to the election of Donald Trump.” Rather than dig deep into the “half of America” that had voted for the president, the newspaper chose to blame the events of 2016 on the country’s pervasive racism, not only here and now but everywhere and always.
The 1619 Project rode the social-justice ambitions of the newsroom to commodify racial polarization—and, not incidentally, to fill the void left by Robert Mueller’s failure to launch.
The project showed little interest in investigative reporting or any other form of old-school journalism. It produced no exposés of present-day injustice. Instead, it sold agenda-setting on a grand scale: the stated mission was to “reframe the country’s history by placing the consequences of slavery and the contributions of black Americans at the center of our national narrative.” The reportorial crunch implicit in this high-minded posture might be summarized as “All the news that’s fit to reframe history.”
The 1619 Project has come under fire for its extreme statements and many historical inaccuracies. Yet critics missed the point of the exercise, which was to stake out polarizing positions in the mode of post-truth: opinions could be transformed into facts if held passionately enough. The project became another post-journalistic triumph for the Times. Public school systems around the country have included the material in their curricula. Hannah-Jones received a Pulitzer Prize for her “sweeping, provocative, and personal essay”—possibly the first award offered for excellence in post-journalism. The focus on race propelled the Times to the vanguard of establishment opinion during the convulsions that followed the death of George Floyd under the knee of a white Minneapolis police officer in May 2020.
That episode replaced the Russia collusion story as the prime manufacturer of “angry citizens” and added an element of inflexibility to the usual rigors of post-journalism. Times coverage of antipolice protests was generally sympathetic to the protesters. Trump was, of course, vilified for “fanning the strife.” But the significant change came in the severe tightening of discourse: the reframing imperative now controlled the presentation of news. Reporting minimized the violence that attended the protests, for example, and sought to keep the two phenomena sharply segregated.
Less than two weeks after Floyd’s death, amid spreading lawlessness in many American cities, the paper posted an opinion piece by Republican senator Tom Cotton in its online op-ed section, titled “Time to Send in the Troops.” It called for “an overwhelming show of force” to pacify troubled urban areas. To many loyal to the New York Times, including staff, allowing Cotton his pitch smacked of treason. Led by young black reporters, the newsroom rebelled.
Once again, the mutiny began on Twitter. Many reporters had large followings; they could appeal directly to readers. In the way of social media, the most excited voices dominated among subscribers. As the base roared, the rebels moved to confront their employer.
The history-reframing mission is now in the hands of a deeply self-righteous group that has trouble discerning the many human stopping places between true and false, good and evil, objective and subjective. According to one poll, a majority of Americans shared the opinion that Cotton expressed in his op-ed. That had no bearing on the discussion. In the letter and the town hall meetings, the rebels wielded the word “truth” as if they owned it. By their lights, Cotton had lied, and the fact that the public approved of his lies was precisely what made his piece dangerous.
Revolutions tend to radicalization. The same is true of social media mobs: they grow ever more extreme until they explode.
But the New York Times is neither of these things—it’s a business, and post-journalism is now its business model. The demand for moral clarity, pressed by those who own the truth, must increasingly resemble a quest for radical conformism; but for nonideological reasons, the demand cannot afford to leave subscriber opinion too far behind. Radicalization must balance with the bottom line.
The final paradox of post-journalism is that the generation most likely to share the moralistic attitude of the newsroom rebels is the least likely to read a newspaper. Andrey Mir, who first defined the concept, sees post-journalism as a desperate gamble, doomed in the end by demographics. For newspapers and their multiple art forms developed over a 400-year history, Mir writes, the collision with the digital tsunami was never going to be a challenge to surmount but rather “an extinction-level event.”
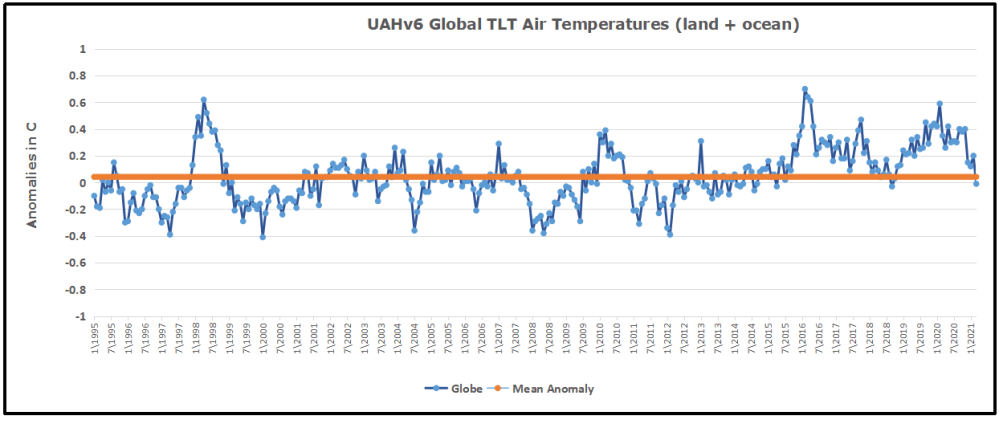
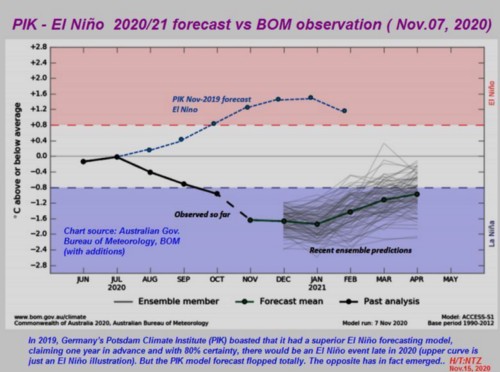

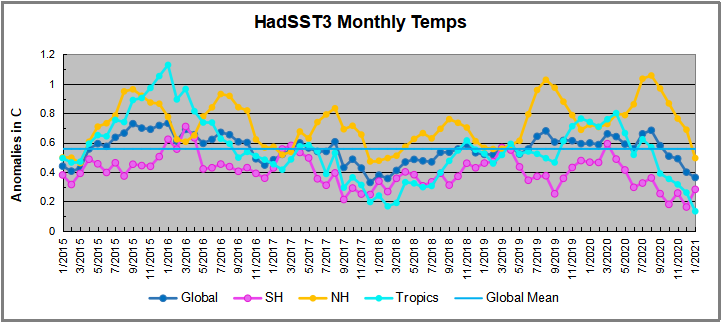
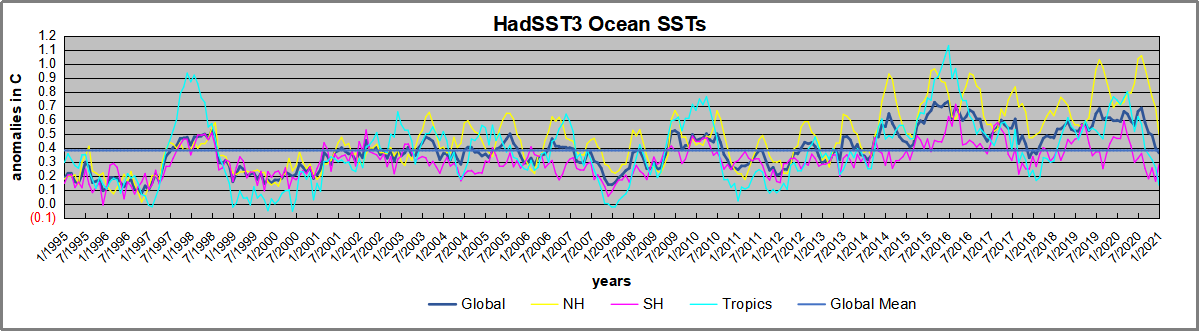
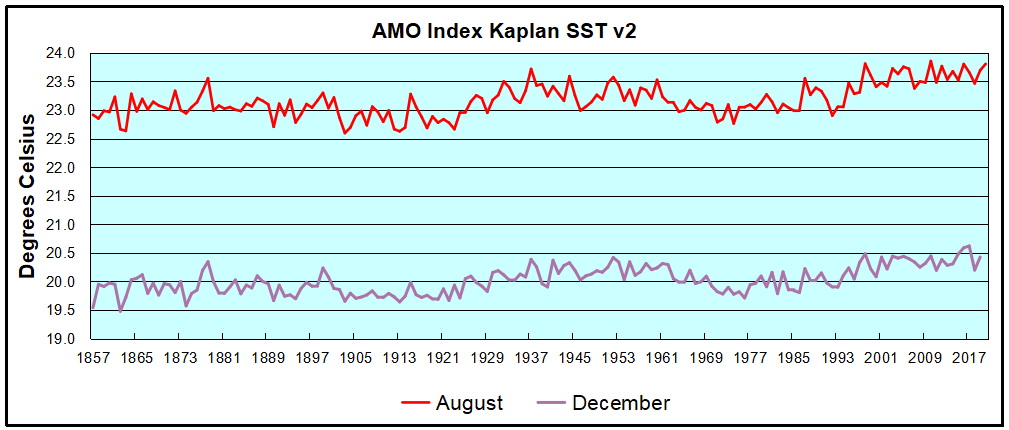
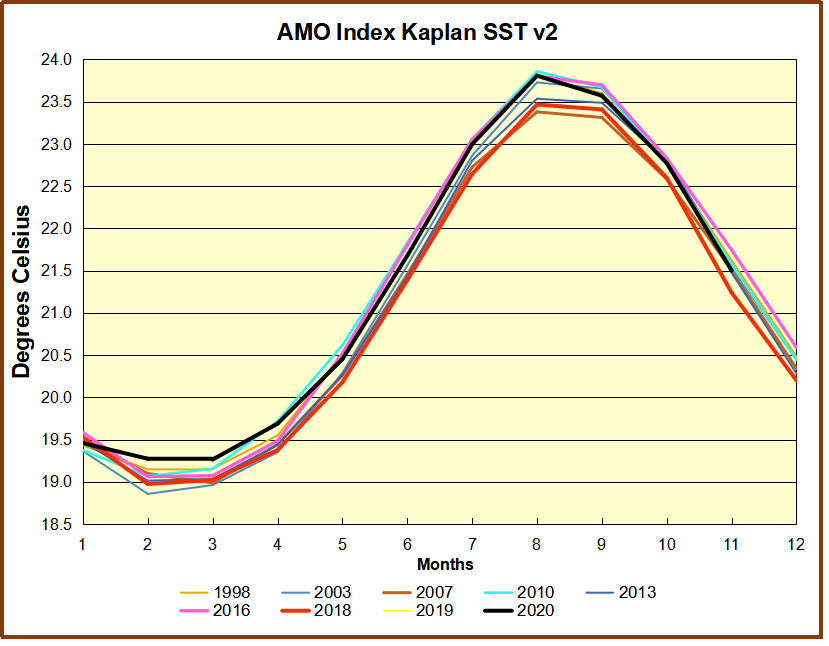


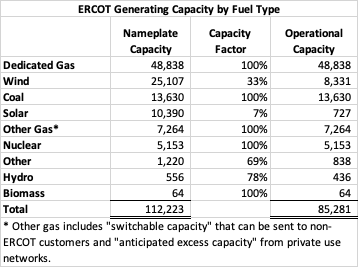


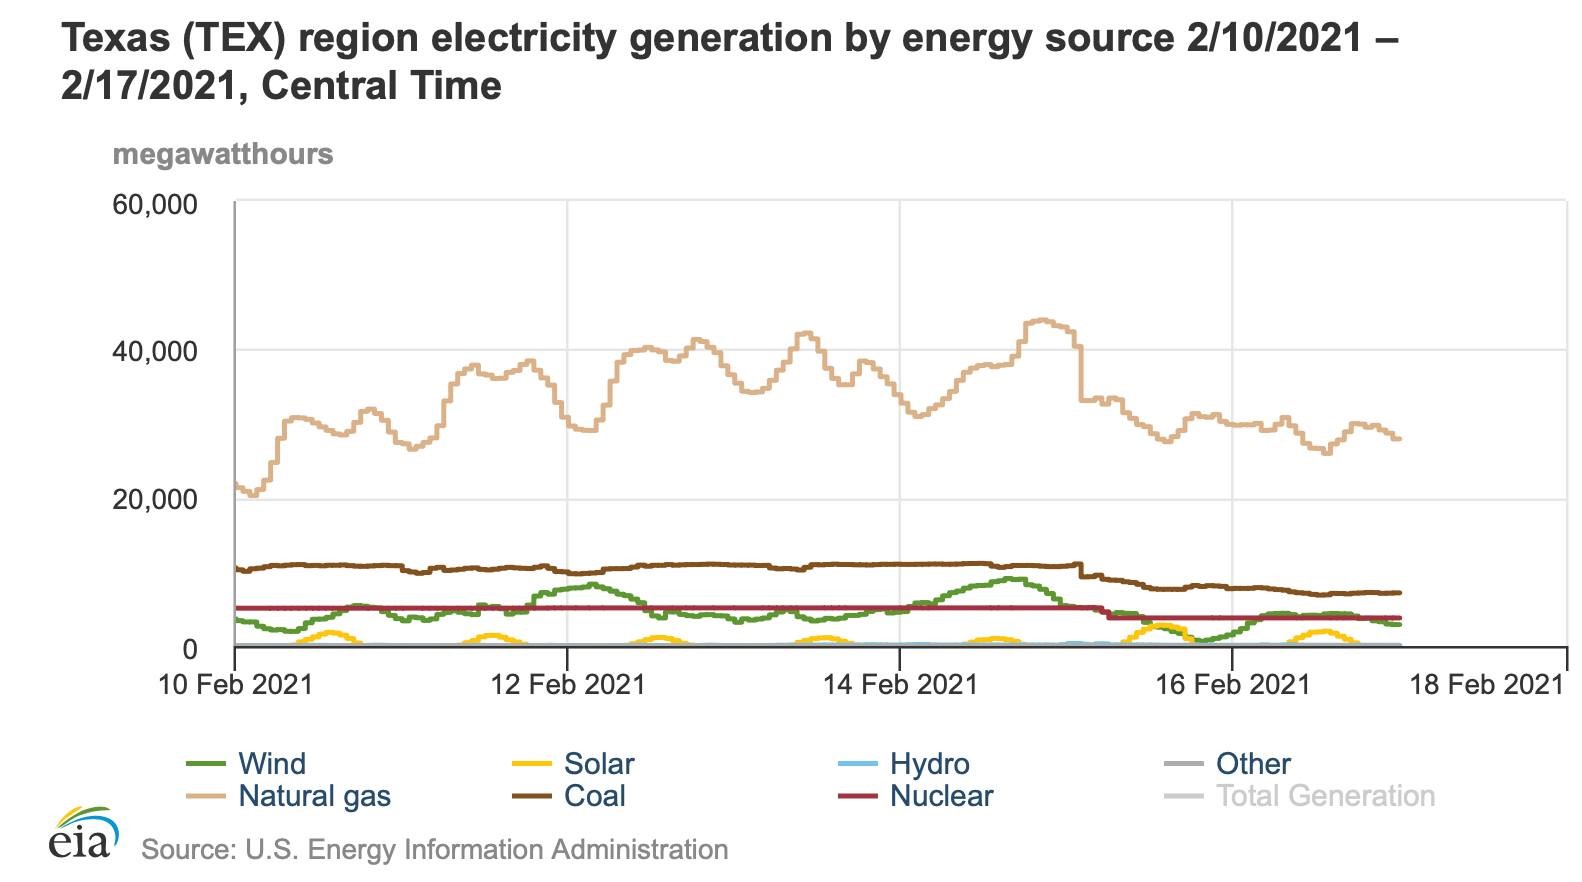
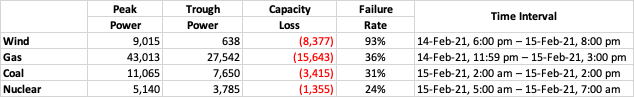
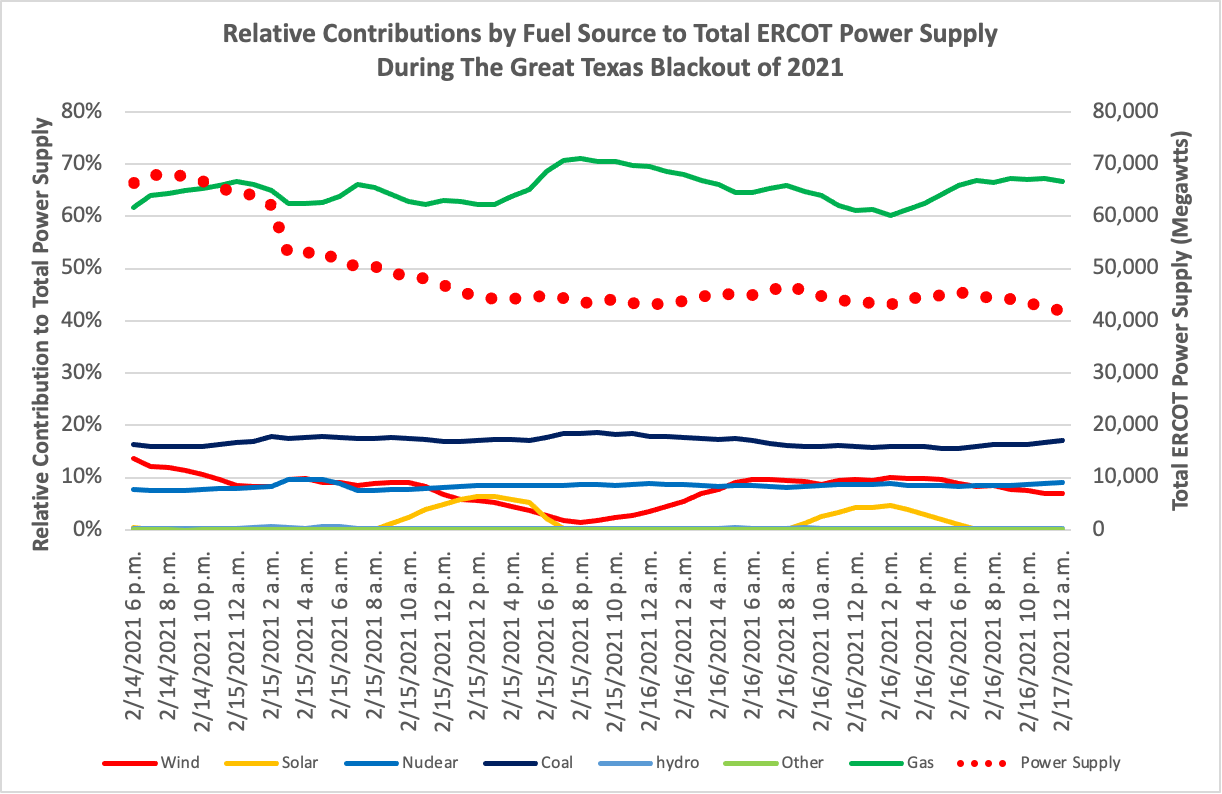


 One of the few pleasures remaining during pandemania involves sports competitions where rules are followed and enforced by unbiased officials, so that teams or individuals win or lose based solely on the merit of their performances. Elsewhere with identity politics and political correctness, it is a different story. People on the right perceive accurately that their opponents on the left are not bound by the rules, and break them readily in order to win.