In January, most of the Arctic ocean basins are frozen over, and so the growth of ice extent slows down. According to SII (Sea Ice Index) January on average adds 1.326M km2, and this year it was 1.235M. (background is at Arctic Ice New Year 2022). Still February started with a surplus of ~200k km2 over the 16 year average. The few basins that can grow ice this time of year tend to fluctuate and alternate waxing and waning, which appears as a see saw pattern in these images.
Two weeks into February 2022 Arctic ice extents waffled with little growth, resulting in a drop down to match the mean ice extent mid month. The graph below shows the ice recovery since mid-January for 2022, the 16-year average and several recent years.
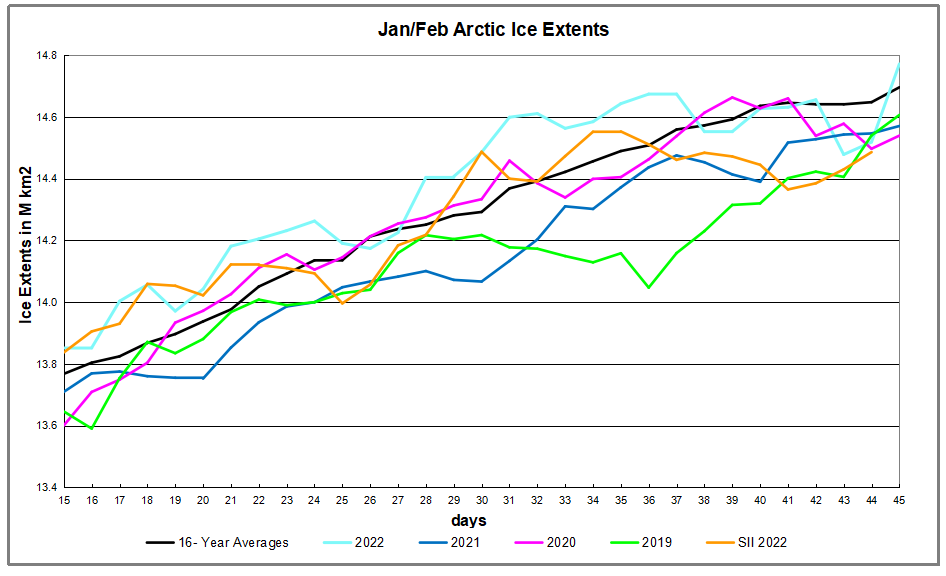
The graph shows end of January 2022 a 200k km2 surplus to average, then little accumulation in February 2022 until a leap upward yesterday. SII dropped below MASIE this month and did not yet report its estimate of ice extent on day 45
February Ice Growth Despite See Saws in Atlantic and Pacific
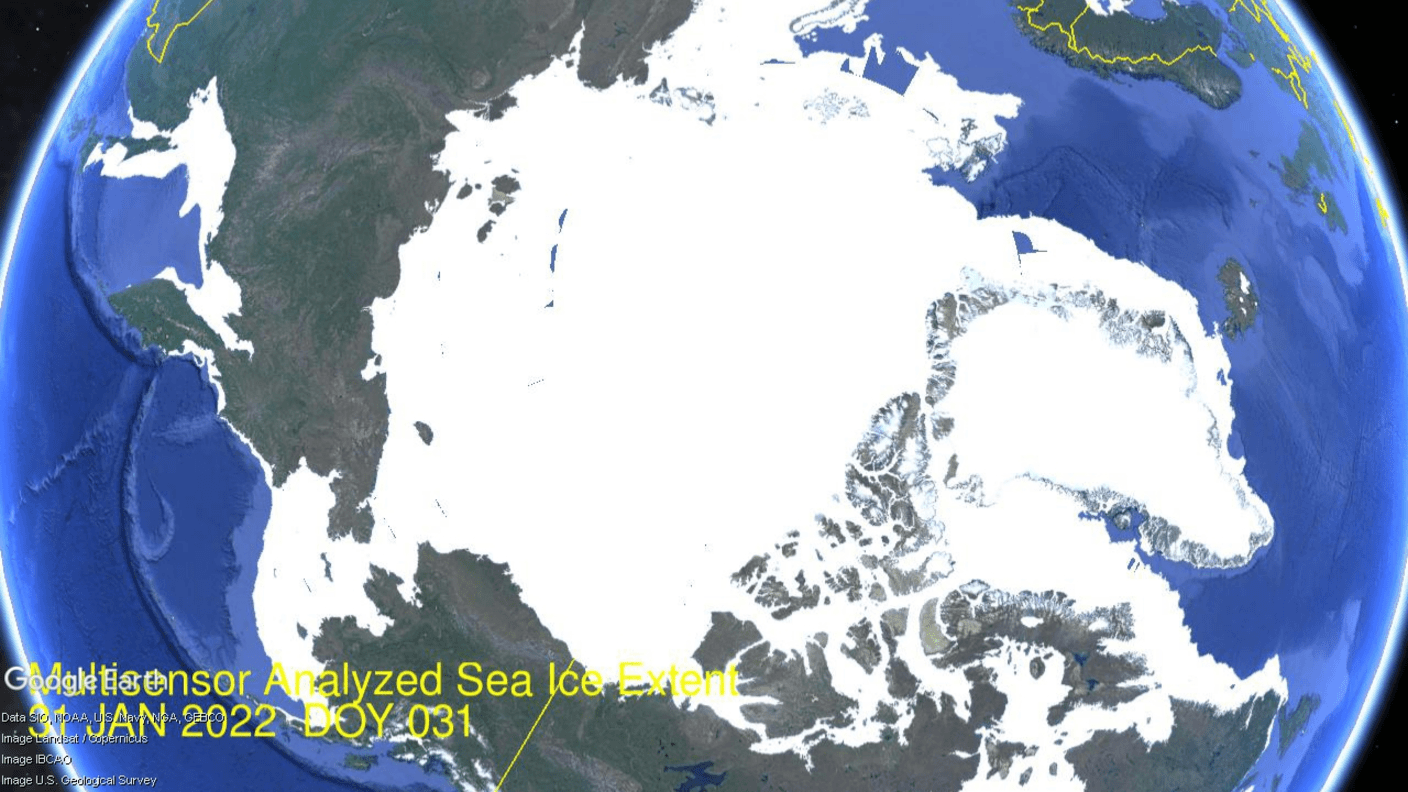
As noted above, this time of year the Arctic adds ice on the fringes since the central basins are already frozen over. The animation above shows Barents and Greenland Seas on upper right (Atlantic side) retreating and growing with little change the last two weeks. Baffin Bay lower right waffled some but added 200k km2 and reached 117% of maximum last March.
Meanwhile the most dramatic see saw appears on the left (Pacific side) Both Bering below and Okhotsk above wax and wane over this period. Okhotsk waffles up and down ending sightly lower in the end, only 60% of its last max. Bering is seen losing, then growing to add 100k km2 by the end, reaching 132% of last March maximum.

The table below presents ice extents in the Arctic regions for day 45 (Feb. 14) compared to the 16 year average and 2021.
| Region | 2022045 | Day 45 Average | 2022-Ave. | 2021045 | 2022-2021 |
| (0) Northern_Hemisphere | 14771764 | 14696037 | 75727 | 14570648 | 201117 |
| (1) Beaufort_Sea | 1070776 | 1070247 | 529 | 1070689 | 87 |
| (2) Chukchi_Sea | 966006 | 965730 | 276 | 966006 | 0 |
| (3) East_Siberian_Sea | 1087137 | 1087131 | 6 | 1087120 | 17 |
| (4) Laptev_Sea | 897827 | 897837 | -10 | 897827 | 0 |
| (5) Kara_Sea | 871231 | 909595 | -38364 | 934988 | -63757 |
| (6) Barents_Sea | 670586 | 585796 | 84790 | 837700 | -167114 |
| (7) Greenland_Sea | 711157 | 617734 | 93423 | 637304 | 73853 |
| (8) Baffin_Bay_Gulf_of_St._Lawrence | 1521206 | 1454881 | 66326 | 1103099 | 418107 |
| (9) Canadian_Archipelago | 854685 | 853210 | 1475 | 854597 | 88 |
| (10) Hudson_Bay | 1260903 | 1260538 | 365 | 1260471 | 432 |
| (11) Central_Arctic | 3222483 | 3210904 | 11580 | 3204694 | 17790 |
| (12) Bering_Sea | 841781 | 692225 | 149557 | 545267 | 296515 |
| (13) Baltic_Sea | 64799 | 96258 | -31459 | 116339 | -51540 |
| (14) Sea_of_Okhotsk | 706456 | 930957 | -224501 | 1030304 | -323848 |
The table shows that Okhotsk deficit to average is offset by surpluses in Bering, Barents, Greenland and Baffin Bay.
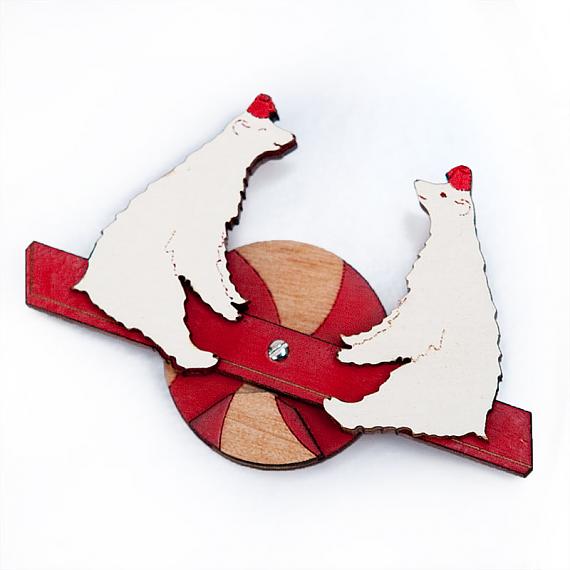
The polar bears have a Valentine Day’s wish for Arctic Ice.

And Arctic Ice loves them back, returning every year so the bears can roam and hunt for seals.

Footnote:
Seesaw accurately describes Arctic ice in another sense: The ice we see now is not the same ice we saw previously. It is better to think of the Arctic as an ice blender than as an ice cap, explained in the post The Great Arctic Ice Exchange.
