An early-spring sunset over the icy Chukchi Sea near Barrow (Utqiaġvik), Alaska, documented during the OASIS field project (Ocean_Atmosphere_Sea Ice_Snowpack) on March 22, 2009. Image credit: UCAR, photo by Carlye Calvin.
Previous posts showed 2022 Arctic Ice broke the 15M km2 ceiling in February, staying above that level the first week of March, then followed by typical melting in March and April. Now in May, Arctic sea ice is not retreating as fast as usual. The chart below shows by day 134 (May 14), the overall ice extent in cyan was 353k km2 above the 16 year average in black.
Note the much higher ice extents in 2022 compared to 2021 (+543k) or 2007 (+619k). The green lines show that the above normal ice this year is despite low extents in Bering and Okhotsk (B&O) seas. The averages in dark green (excluding B&O) are below 2022 in light green (excluding B&O) by 477k km2. IOW everywhere in the Arctic except Okhotsk ice extents are almost 1/2 Wadham above average, nearly matching day 134 Arctic including Bering and Okhotsk. Remember also that B&O are outside the Arctic circle, have no Polar bears, and are among the first to melt out every spring.
The table below shows ice extents in the seas comprising the Arctic, comparing 2022 day 134 with the same day average over the last 16 years and with 2007.
| Region | 2022134 | Day 134 Average | 2022-Ave. | 2007134 | 2022-2007 |
| (0) Northern_Hemisphere | 13084542 | 12731703 | 352839 | 12465425 | 619117 |
| (1) Beaufort_Sea | 1042530 | 1048465 | -5934 | 1057649 | -15119 |
| (2) Chukchi_Sea | 958909 | 927455 | 31454 | 952925 | 5984 |
| (3) East_Siberian_Sea | 1087137 | 1081479 | 5659 | 1080156 | 6981 |
| (4) Laptev_Sea | 897845 | 881321 | 16524 | 850822 | 47022 |
| (5) Kara_Sea | 894992 | 886185 | 8807 | 876053 | 18939 |
| (6) Barents_Sea | 612751 | 417074 | 195677 | 351553 | 261198 |
| (7) Greenland_Sea | 674248 | 623405 | 50843 | 560102 | 114147 |
| (8) Baffin_Bay_Gulf_of_St._Lawrence | 1206195 | 1080371 | 125824 | 1029612 | 176583 |
| (9) Canadian_Archipelago | 854685 | 840361 | 14324 | 830604 | 24081 |
| (10) Hudson_Bay | 1213151 | 1190185 | 22966 | 1161738 | 51413 |
| (11) Central_Arctic | 3248013 | 3224787 | 23226 | 3234305 | 13708 |
| (12) Bering_Sea | 257260 | 319952 | -62692 | 309846 | -52586 |
| (13) Baltic_Sea | 9044 | 8179 | 865 | 6368 | 2675 |
| (14) Sea_of_Okhotsk | 125465 | 200107 | -74641 | 159942 | -34476 |
The table shows that 2022 ice extent is above average by 353k km2, or 2.8%, and exceeding 2007 by 619k km2 at this date. The two deficits to average are Bering and Okhotsk, more than offset by surpluses elsewhere, especially in Barents and Baffin Bay.

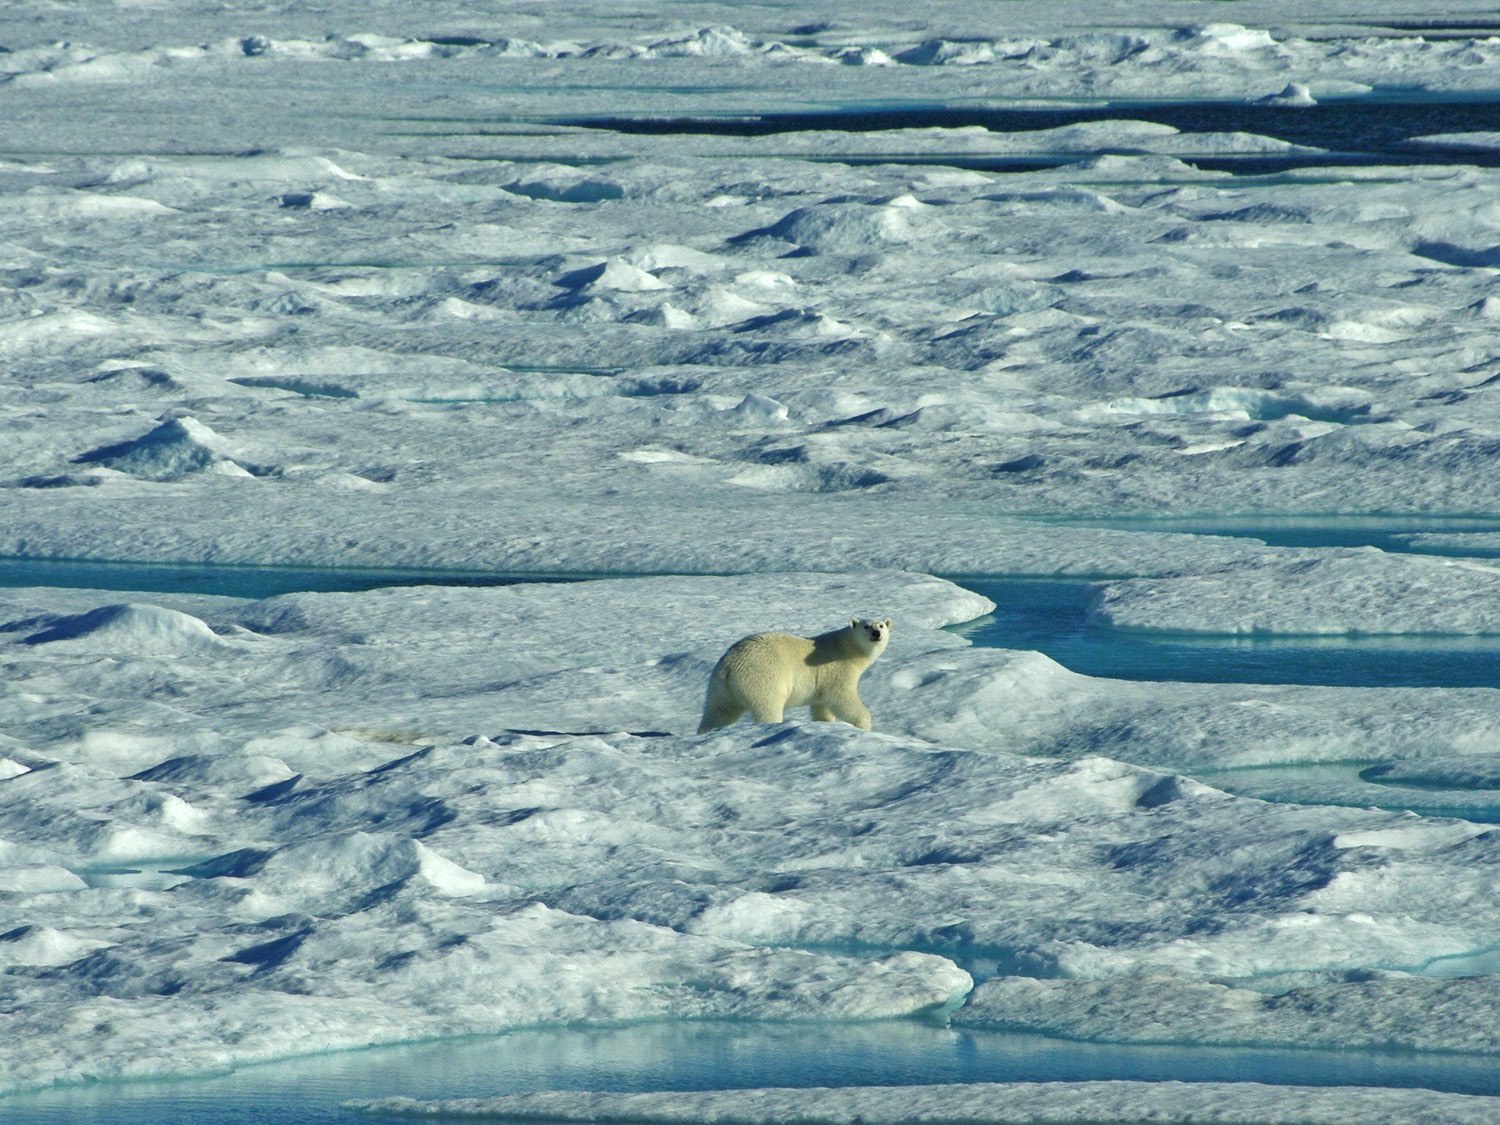
Polar Bear on Ice in Baffin Bay Between Baffin Island and Greenland


Reblogged this on Climate Collections.
LikeLike