Arctic Ice Plentiful Mid May 2023

The image above shows 2023 Arctic ice extents from Mid April (day 106) to Mid May (day 135). As usual, the LIFO pattern is observed: ice that is Last In is the First Out.  The Pacific basins of Okhotsk (top left) and Bering (bottom left) rapidly turn to open water.  Baffin Bay (lower right) melts more slowly. Barents Sea (top center loses ice extent steadily.  Note Hudson Bay (bottom) keeps its ice, and Canadian Archipelago (lower center) retains most of its ice. On the left center, the Eurasian coastline remains frozen.

The graph below shows 2023 compared to 17 year average and some recent years for this time period.

Firstly, on average this period shows ice declining 1.44 M km2 down to 12.68M km2,  Note that  2023 matched the average in April, then retained more ice than usual during first two weeks of May. Sea Ice Index (SII) was close to MASIE throughout..  The other years, including 2007, were ~300k km2 lower than average.

Region 2023135 Day 135 Average 2023-Ave. 2007135 2023-2007
 (0) Northern_Hemisphere 12771477 12677903 93574 12431928 339549
 (1) Beaufort_Sea 1050531 1046418 4113 1057649 -7118
 (2) Chukchi_Sea 943942 926464 17478 953491 -9549
 (3) East_Siberian_Sea 1085822 1081321 4501 1075314 10508
 (4) Laptev_Sea 897060 881069 15991 828738 68322
 (5) Kara_Sea 919027 879799 39228 876053 42974
 (6) Barents_Sea 407569 418431 -10862 351553 56016
 (7) Greenland_Sea 730714 619664 111050 564865 165849
 (8) Baffin_Bay_Gulf_of_St._Lawrence 979333 1076523 -97190 1018780 -39447
 (9) Canadian_Archipelago 841610 839708 1902 830604 11006
 (10) Hudson_Bay 1153016 1186552 -33536 1167310 -14294
 (11) Central_Arctic 3247995 3223255 24740 3234305 13690
 (12) Bering_Sea 296036 301878 -5842 298268 -2231
 (13) Baltic_Sea 6134 7668 -1534 6368 -234
(14) Sea_of_Okhotsk 211027 186778 24249 164833 46194

The table shows the distribution of ice in the Arctic basins.  The main deficits to average are Baffin and Hudson Bays, more than offset by surpluses in Kara and Greenland Seas. Most other regions are surplus with a few slightly negative.

Resources:  Climate Compilation II Arctic Sea Ice

More CO2 Good, Less CO2 Bad

Gregory Wrightstone explains at CO2 Coalition More Carbon Dioxide Is Good, Less Is Bad.  Excerpts in italics with my bolds and added images.

People should be celebrating, not demonizing, modern increases in atmospheric carbon dioxide (CO2). We cannot overstate the importance of the gas. Without it, life doesn’t exist.

First, a bit of history: During each of the last four glacial advances, CO2’s concentration fell below 190 parts per million (ppm), less than 50 percent of our current concentration of 420 ppm. When glaciers began receding about 14,000 years ago – a blink in geological time – CO2 levels fell to 182 ppm, a concentration thought to be the lowest in Earth’s history.

Line of Death

Why is this alarming? Because below 150 ppm, most terrestrial plant life dies. Without plants, there are no animals.

In other words, the Earth came within 30 ppm in CO2’s atmospheric concentration of witnessing the extinction of most land-based plants and all higher terrestrial life-forms – nearly a true climate apocalypse. Before industrialization began adding CO2 to the atmosphere, there was no telling whether the critical 150-ppm threshold wouldn’t be reached during the next glacial period.

Contrary to the mantra that today’s CO2 concentration is unprecedentedly high, our current geologic period, the Quaternary, has seen the lowest average levels of carbon dioxide since the end of the Pre-Cambrian Period more than 600 million years ago. The average CO2 concentration throughout Earth’s history was more than 2,600 ppm, nearly seven times current levels.

Beneficial CO2 Increases

CO2 increased from 280 ppm in 1750 to 420 ppm today, most of it after World War II as industrial activity accelerated. The higher concentration has been beneficial because of the gas’s role as a plant food in increasing photosynthesis.

Its benefits include:

— Faster plant growth with less water and larger crop yields.

— Expansion of forests and grasslands.

— Less erosion of topsoil because of more plant growth.

— Increases in plants’ natural insect repellents.

A summary of 270 laboratory studies covering 83 food crops showed that increasing CO2 concentrations by 300 ppm boosts plant growth by an average of 46 percent. Conversely, many studies show adverse effects of low-CO2 environments.

For instance, one indicated that, compared to today, plant growth was eight percent less in the period before the Industrial Revolution, with a low concentration of 280 ppm CO2.

Therefore, attempts to reduce CO2 concentrations are bad for plants, animals and humankind.

Data reported in a recent paper by Dr. Indur Goklany, and published by the CO2 Coalition, indicates that up to 50 percent of Earth’s vegetated areas became greener between 1982-2011.

Researchers attribute 70 percent of the greening to CO2 fertilization from of fossil fuel emissions. (Another nine percent is attributed to fertilizers derived from fossil fuels.)

Dr. Goklany also reported that the beneficial fertilization effect of CO2 – along with the use of hydrocarbon-dependent machinery, pesticides and fertilizers – have saved at least 20 percent of land area from being converted to agricultural purposes – an area 25 percent larger than North America.

The amazing increase in agricultural productivity, partly the result of more CO2, has allowed the planet to feed eight billion people, compared to the fewer than 800,000 inhabitants living a short 300 years ago.

More CO2 in the air means more moisture in the soil. The major cause of water loss in plants is attributable to transpiration, in which the stomata, or pores, on the undersides of the leaves open to absorb CO2 and expel oxygen and water vapor.

With more CO2, the stomata are open for shorter periods, the leaves lose less water, and more moisture remains in the soil. The associated increase in soil moisture has been linked to global decreases in wildfires, droughts and heat waves.

Exaggeration of CO2’s Warming Effect

Alarm over global warming stems from exaggerations of CO2’s potential to retain heat that otherwise would radiate to outer space. As with water vapor, methane and nitrous oxide, CO2 retains heat in the atmosphere by how it reacts to infrared portions of the electromagnetic spectrum.

However, the gas has saturated to a large extent within the infrared range, leaving relatively little potential for increased warming.

Both sides of the climate debate agree that the warming effect of each molecule of CO2 decreases significantly (logarithmically) as the concentration increases.

This is one reason why there was no runaway greenhouse warming when CO2 concentrations approached 20 times that of today. This inconvenient fact, despite its importance, is rarely mentioned because it undermines the theory of a future climate catastrophe.

A doubling of CO2 from today’s level of 420 ppm – an increase estimated to take 200 years to attain – would have an inconsequential effect on global temperature.

Pennsylvania’s solar-powered fossil fuels

CO2 being liberated today from Pennsylvania coal was removed from the atmosphere by the photosynthesis of trees that fed on sunlight and carbon dioxide and then died to have their remains accumulate in the vast coal swamps of the Carboniferous Period.

Pennsylvania Marcellus and Utica shale hydrocarbons being exploited today were also the likely hydrocarbon source of shallower reservoirs producing since the late 1800s.

The source of those hydrocarbons was algae remains that gathered on the bottom of the Ordovician and Devonian seas.

Like the coal deposits, the algae used solar-powered photosynthesis and CO2 (the algal blooms were likely fueled by regular dust storms) to remove vast amounts of CO2 from the air and lock it up as carbon-rich organic matter.

The provenance of these hydrocarbons spawns two novel ideas. First, there is a strong case that these are solar-powered fuels.

Second, the sequestering of carbon during the creation of the hydrocarbons lowered atmospheric concentrations of CO2 to sub-optimum levels for plants. Therefore, the combustion of today’s coal and gas is liberating valuable CO2 molecules that are turbocharging plant growth.

The plain fact of the matter is that the modest warming of less than one degree Celsius since 1900, combined with increasing CO2, is allowing ecosystems to thrive and humanity to prosper.

Additional information on CO2’s benefits and related topics are available at CO2Coalition.org, which includes a number of publications and resources of interest.


Enforcing Climate Correctness (Fact Checking)

Serfs attacking Climate Establishment

Phys.org sounds the alarm: Meteorologists targeted in climate misinfo surge.  Excerpts in italics with my bolds and added images.

Once trusted faces on the news, meteorologists now brave threats, insults and slander online from conspiracy theorists and climate change deniers who accuse them of faking or even fixing the weather.

Users on Twitter and other social media falsely accused Spain’s weather agency of engineering a drought, Australia’s of doctoring its thermometers and France’s of exaggerating global warming through misplaced weather stations.

“The coronavirus is no longer a trend. Conspiracy theorists and deniers who used to talk about that are now spreading disinformation about climate change,” Alexandre Lopez-Borrull, lecturer in Information and Communication Sciences at the Open University of Catalonia, told AFP.

“These scientific bodies are seen as part of the establishment, so anything they say may get disputed on social networks.

“They are providing evidence against what the climate deniers claim, so the latter try to discredit them.”

Maybe if they stuck to weather reporting? See Climate Evangelists Are Taking Over Your Local Weather Forecast

Australian thermometers

In a case investigated by AFP Fact Check, conservative media and Facebook users shared unfounded claims that Australia’s Bureau of Meteorology (BOM) doctored its temperature readings.

In an analysis of data obtained via a freedom of information request, prominent climate skeptic Jennifer Marohasy said BOM’s electronic probes returned readings up to 0.7 degrees Celsius warmer than those of its older mercury thermometers.

Experts who analyzed the data said the claims were inaccurate.

Monash University emeritus environment professor Neville Nicholls said the difference between most readings on the electronic probes and the mercury thermometers was negligible—between zero and 0.1C (0.18 degrees Fahrenheit).

The World Meteorological Organization told AFP that the BOM’s measurements were in line with its standards, contrary to Marohasy’s allegation.

Marohasy makes her case in video below.

Several examples in the article shows they are relying on fact checking by AFP (Agence France Presse).  So the AFP Fact Check follows the usual procedure:  get quotes from establishment supporters in order to isolate and cancel a finding contrary to “consensus” climate science.

More from AFP to See How the Enforcement Works

Climate ‘declaration’ recirculates debunked claims.Excerpt in italics with my bolds

First Attack:   Big Oil Funds Them, So They Lie

However seven of the signatories to the declaration were identified on the list as having worked for Shell and eight others as having worked in the oil industry. Crok confirmed to AFP that Berkhout himself worked for the firm “about 40 years ago.” Besides these, there were 13 petroleum engineers and petroleum geologists, plus several mining specialists.

Several signatories had links, either mentioned on the list or documented elsewhere, to US climate-skeptic free-market groups with ties to the oil industry: the Heartland Institute, the Competitive Enterprise Institute and the Cato Institute.

These groups each received money from oil giant ExxonMobil, according to donor and tax documents published by Greenpeace (here, here and here). The company has been accused of undermining science to protect its fossil fuel business — a charge it denies.

Second Attack:  Only Some Signatories are Climatologists

According to an AFP count of the declaration’s signatories, about 10 explicitly described themselves as climatologists or climate scientists, fewer than one percent of the total. A few others described themselves as specialists in paleoclimatology and atmospheric sciences.

There were approximately 40 geophysicists, 130 geologists and 200 engineers of various kinds, plus several mathematicians, medical doctors and agricultural scientists.

Thirdly:  IPCC is the Final Authority

Documents accrediting the mainstream scientific view on climate change are more comprehensive than the World Climate Declaration. The Intergovernmental Panel on Climate Change invited 721 experts from 90 countries to be authors and editors of its three-part Sixth Assessment Report, released between August 2021 and April 2022.

The report constitutes the most comprehensive assessment of scientific knowledge on climate change. Each part was some 3,000 pages long. The authors reviewed hundreds of studies that were listed in the reference sections. It says there is “unequivocal” evidence that humans are warming the climate by burning fossil fuels.

Finally, Refer to Insider Supporters to Refute Claims

Examples in the AFP fact check include Carbon Brief and World Weather Attribution.

Why Should We Believe A Bunch of Journalists like AFP?

Well, because they pass the media bias test;

Who is behind Media Bias Fact Checks and what is their POV?

From Climate Change Dispatch ‘Media Bias/Fact Check’ Site Served With Cease And Desist, Gets Fact-Checked.  Excerpts in italics with my bolds.

Today, PSI has issued Media Bias/Fact Check (MBFC) site owner, Dave Van Zandt with a pre-action legal notice to take down the defamatory and false smear.

Ironically, the self-styled ‘MEDIA BIAS/FACT CHECK‘ (MB/FC) which negatively fact-checked PSI admits it relies on the subjective bias to decide how biased others are. In other words, MB/FC is a pseudoscientific fact checker!

Apart from unlawfully smearing PSI, Mr. Van Zandt has smeared other websites that publish scientific articles critical of man-made global warming claims. Among the unfairly smeared are:

  • Climate Change Dispatch
  • CFACT
  • WUWT

Below we help readers to fact-check the pseudo-fact-checker. We put Dave Van Zandt the faceless fact-checker under the microscope and discovered the following:

♦  Van Zandt Cites No Scientific Qualifications At All
♦  Van Zandt Was Exposed By WND As A Fraud And A Liar
♦  Van Zandt’s Website (MBFC) Does Not Apply Any Objective Scientific Method
♦  MBFC Relies On Unverifiable Subjectivity (Own Bias) To Make Judgments

Climate Enforcers Appeal to Membership in IFCN

Both AFP and MBFC stake their credibility on belonging to the International Fact-Checking Network (IFCN).  Who’s behind that authority?  WND discussed them in their article The 9 fakest fake-news checkers.  Excerpts in italics with my bolds.

In the past Facebook announced it would use the International Fact-Checking Network, or IFCN, to check on the legitimacy of news articles posted to the social media site.

IFCN is hosted by the Poynter Institute for Media Studies and funded, in part, by Google and foundations of leftist billionaires George Soros and Bill Gates. Soros donated $25 million to Hillary Clinton’s presidential campaign. The Daily Mail reported that Clinton super-donor and eBay founder Pierre Omidyar is also backing the project.

The website reveals: “Poynter’s IFCN has received funding from the Arthur M. Blank Family Foundation, the Duke Reporters’ Lab, the Bill & Melinda Gates Foundation, Google, the National Endowment for Democracy, the Omidyar Network, the Open Society Foundations and the Park Foundation.”

Summary:  

There’s a well-funded industry dedicated to curating the news for the sake of “right-thinking” public opinion. It’s a closed loop of self-appointed authorities who validate each other, and excommunicate unbelievers.  Woe to those who outsource their critical intelligence to such.


UAH Air Temps Warming Little in April 2023

The post below updates the UAH record of air temperatures over land and ocean. Each month and year exposes again the growing disconnect between the real world and the Zero Carbon zealots.  It is as though the anti-hydrocarbon band wagon hopes to drown out the data contradicting their justification for the Great Energy Transition.  

As an overview consider how recent rapid cooling  completely overcame the warming from the last 3 El Ninos (1998, 2010 and 2016).  The UAH record shows that the effects of the last one were gone as of April 2021, again in November 2021, and in February and June 2022  Now at year end 2022 and continuing into 2023 global temp anomaly is matching or lower than average since 1995, an ENSO neutral year. (UAH baseline is now 1991-2020).

For reference I added an overlay of CO2 annual concentrations as measured at Mauna Loa.  While temperatures fluctuated up and down ending flat, CO2 went up steadily by ~60 ppm, a 15% increase.

Furthermore, going back to previous warmings prior to the satellite record shows that the entire rise of 0.8C since 1947 is due to oceanic, not human activity.

gmt-warming-events

The animation is an update of a previous analysis from Dr. Murry Salby.  These graphs use Hadcrut4 and include the 2016 El Nino warming event.  The exhibit shows since 1947 GMT warmed by 0.8 C, from 13.9 to 14.7, as estimated by Hadcrut4.  This resulted from three natural warming events involving ocean cycles. The most recent rise 2013-16 lifted temperatures by 0.2C.  Previously the 1997-98 El Nino produced a plateau increase of 0.4C.  Before that, a rise from 1977-81 added 0.2C to start the warming since 1947.

Importantly, the theory of human-caused global warming asserts that increasing CO2 in the atmosphere changes the baseline and causes systemic warming in our climate.  On the contrary, all of the warming since 1947 was episodic, coming from three brief events associated with oceanic cycles. 

Update August 3, 2021

Chris Schoeneveld has produced a similar graph to the animation above, with a temperature series combining HadCRUT4 and UAH6. H/T WUWT

image-8


mc_wh_gas_web20210423124932

See Also Worst Threat: Greenhouse Gas or Quiet Sun?

April 2023 Update  Land and Sea Temps Little Changed

banner-blog

With apologies to Paul Revere, this post is on the lookout for cooler weather with an eye on both the Land and the Sea.  While you will hear a lot about 2020-21 temperatures matching 2016 as the highest ever, that spin ignores how fast the cooling set in.  The UAH data analyzed below shows that warming from the last El Nino was fully dissipated with chilly temperatures in all regions. After a warming blip in 2022, land and ocean temps dropped again with 2023 starting below the mean since 1995.

UAH has updated their tlt (temperatures in lower troposphere) dataset for April 2023. Posts on their reading of ocean air temps this month came later the same day as updated records from HadSST4.  I just posted on SSTs using HadSST4 El Nino Comes to Save Global Warming April 2023 This month also has a separate graph of land air temps because the comparisons and contrasts are interesting as we contemplate possible cooling in coming months and years. Sometimes air temps over land diverge from ocean air changes.  For example in February, Tropical ocean temps alone moved upward, while temps in all land regions rebounded after hitting bottom. In April, as shown later on, ocean air warmed slightly, while NH land air cooled sharply, leaving the overall Global anomally little changed.

Note:  UAH has shifted their baseline from 1981-2010 to 1991-2020 beginning with January 2021.  In the charts below, the trends and fluctuations remain the same but the anomaly values change with the baseline reference shift.

Presently sea surface temperatures (SST) are the best available indicator of heat content gained or lost from earth’s climate system.  Enthalpy is the thermodynamic term for total heat content in a system, and humidity differences in air parcels affect enthalpy.  Measuring water temperature directly avoids distorted impressions from air measurements.  In addition, ocean covers 71% of the planet surface and thus dominates surface temperature estimates.  Eventually we will likely have reliable means of recording water temperatures at depth.

Recently, Dr. Ole Humlum reported from his research that air temperatures lag 2-3 months behind changes in SST.  Thus the cooling oceans now portend cooling land air temperatures to follow.  He also observed that changes in CO2 atmospheric concentrations lag behind SST by 11-12 months.  This latter point is addressed in a previous post Who to Blame for Rising CO2?

After a change in priorities, updates are now exclusive to HadSST4.  For comparison we can also look at lower troposphere temperatures (TLT) from UAHv6 which are now posted for March.  The temperature record is derived from microwave sounding units (MSU) on board satellites like the one pictured above. Recently there was a change in UAH processing of satellite drift corrections, including dropping one platform which can no longer be corrected. The graphs below are taken from the revised and current dataset.

The UAH dataset includes temperature results for air above the oceans, and thus should be most comparable to the SSTs. There is the additional feature that ocean air temps avoid Urban Heat Islands (UHI).  The graph below shows monthly anomalies for ocean air temps since January 2015.

Note 2020 was warmed mainly by a spike in February in all regions, and secondarily by an October spike in NH alone. In 2021, SH and the Tropics both pulled the Global anomaly down to a new low in April. Then SH and Tropics upward spikes, along with NH warming brought Global temps to a peak in October.  That warmth was gone as November 2021 ocean temps plummeted everywhere. After an upward bump 01/2022 temps reversed and plunged downward in June.  After an upward spike in July, ocean air everywhere cooled in August and also in September.   After sharp cooling everywhere in January 2023, all regions were into negative territory. Now in February, March and April, a sharp rise in the Tropics with upticks elsewhere led to a rise globally slightly above zero. Unusually April SH, NH and Global anomalies were all the same 0.17C.

Land Air Temperatures Tracking Downward in Seesaw Pattern

We sometimes overlook that in climate temperature records, while the oceans are measured directly with SSTs, land temps are measured only indirectly.  The land temperature records at surface stations sample air temps at 2 meters above ground.  UAH gives tlt anomalies for air over land separately from ocean air temps.  The graph updated for April is below.

Here we have fresh evidence of the greater volatility of the Land temperatures, along with extraordinary departures by SH land.  Land temps are dominated by NH with a 2021 spike in January,  then dropping before rising in the summer to peak in October 2021. As with the ocean air temps, all that was erased in November with a sharp cooling everywhere.  After a summer 2022 NH spike, land temps dropped everywhere, and in January, further cooling in SH and Tropics offset by an uptick in NH. 

Remarkably, in 2023, SH land air anomaly shot up 1.2C, from  -0.56C in January to +0.67 in April. Land air in the Tropics also rose, but NH land air dropped from +0.48C down to 0C.  Due to NH having twice the land surface as SH, the Global land anomaly was pulled down.

The Bigger Picture UAH Global Since 1980

The chart shows monthly Global anomalies starting 01/1980 to present.  The average monthly anomaly is -0.06, for this period of more than four decades.  The graph shows the 1998 El Nino after which the mean resumed, and again after the smaller 2010 event. The 2016 El Nino matched 1998 peak and in addition NH after effects lasted longer, followed by the NH warming 2019-20.   An upward bump in 2021 was reversed with temps having returned close to the mean as of 2/2022.  March and April brought warmer Global temps, later reversed, and with the sharp drops in Nov., Dec. and January 2023 temps, there was no increase over 1980. Now in 2023 February-April there is a slight rebound over zero.

TLTs include mixing above the oceans and probably some influence from nearby more volatile land temps.  Clearly NH and Global land temps have been dropping in a seesaw pattern, nearly 1C lower than the 2016 peak.  Since the ocean has 1000 times the heat capacity as the atmosphere, that cooling is a significant driving force.  TLT measures started the recent cooling later than SSTs from HadSST3, but are now showing the same pattern.  It seems obvious that despite the three El Ninos, their warming has not persisted, and without them it would probably have cooled since 1995.  Of course, the future has not yet been written.


Objection! Warming Alarm is Hearsay, Lacking Evidence.

C3 Headlines reports: The Real Climate Science Crisis: The Catastrophic Anthropogenic Global Warming (CAGW) Hypothesis Is Without Scientific Evidence.  Excerpts in italics with my bolds and added images.

For a hypothesis to reach the status of being a legit theory, it requires withstanding the onslaught of observed empirical evidence. The CAGW hypothesis is no such animal.

Known by its more contemporary aliases, such as ”climate crisis,” “climate emergency,” “climate collapse,” or “existential threat,” the CAGW has zero empirical evidence to support it.

Unlike the related hypothesis regarding greenhouse gases (GHG) and global warming, at least the GHG hypothesis has warming global temperature data that somewhat coincides with increasing atmospheric CO2 levels, putting aside the growing possibility that the purported cause-and-effect direction is probably the reverse. [Note:  See Temps Cause CO2 Changes, Not the Reverse. 2023 Update]

In order to reach a CAGW climate disaster, global warming temperatures must change rapidly in an accelerating manner that will initiate a ‘tipping point’ for the climate.

The rapid acceleration would present its occurrence in a continuous increasing of the slope, i.e., trend, of temperatures, such as monthly temperatures. Each subsequent month would represent a greater temperature magnitude increase than the month before, hypothetically.

To enlarge open image in new tab.

But those tipping point precursors are not occurring in the real-world climate.

For example, it is agreed by all climate scientists that oceans play a very major role in the world’s climate and its global temperatures due to their being both the world’s largest carbon sink and its largest heat content storage.

However, despite these characteristics, in totality, the global oceans HAVE NOT warmed since the year 2014. And certainly, there is no empirical evidence that oceans exhibit constant temperature increases of magnitude.

Quite the contrary, combined oceans exhibit a regular pattern of temperature decreases and increases, as the adjacent plot of NOAA’s monthly ocean data indicates.

Specifically, this is a plot (dark blue) of moving 5-year temperature changes ending each month of the 60-year period from March 1963 through March 2023.

[Explanation: the first data point is the temperature change for the 60 months ending on March 30, 1963; and the chart’s last temperature change data point is for the five 5 years (i.e. 60 months) ending on March 2023.]

The chart also includes a plot (green) of the moving 60-month CO2 level changes over the same sixty year period, plus a linear trend for both CO2 changes and ocean temperature changes.

The trend of the 60-month CO2 changes significantly exceeds the
slight positive trend of ocean temperature changes by a factor of 117x.

This huge differential undercuts the belief that global warming is primarily the result of GHGs. Which is confirmed by the paltry R^2 of +0.06 – an almost non-existent relationship between 5-year atmospheric CO2 changes and 5-year changes in ocean temperature.

Not only are the large increases in CO2 levels not causing a concerning uptick of temperature change magnitude, it also has not lead to any type of acceleration, per the linear trend since 1963.

Specifically, with a trend of a tiny +0.0001°C, that would project out 20 years to be an increase of 5-year temperature changes to an insignificant amount of +0.024 – definitely not an existential threat of ‘runaway warming’ or a CAGW ‘climate crisis’ as portrayed by bureaucrats, politicians and Hollywood celebrities.

So, if 5 years of increasing amounts of CO2 in the atmosphere barely influence 5-year changes in temperature over a 60-year span, either in magnitude or acceleration rate, then it is highly unlikely that this trace gas would cause a catastrophic climate disaster or an extinction event.

Thus, it is fair to state that for all those scientists pushing a narrative of an imminent climate change catastrophe from CO2 without the requisite empirical evidence, this has become the real climate science crisis facing society.

Notes: Temperature and CO2 data sources.Excel used to calculate 60-mth (5-yr) temperature and CO2 changes; used to calculate the respective trends; used to calculate correlation and r-squared; used to plot the chart.

El Nino Comes to Save Global Warming April 2023

The best context for understanding decadal temperature changes comes from the world’s sea surface temperatures (SST), for several reasons:

  • The ocean covers 71% of the globe and drives average temperatures;
  • SSTs have a constant water content, (unlike air temperatures), so give a better reading of heat content variations;
  • A major El Nino was the dominant climate feature in recent years.

HadSST is generally regarded as the best of the global SST data sets, and so the temperature story here comes from that source. Previously I used HadSST3 for these reports, but Hadley Centre has made HadSST4 the priority, and v.3 will no longer be updated.  HadSST4 is the same as v.3, except that the older data from ship water intake was re-estimated to be generally lower temperatures than shown in v.3.  The effect is that v.4 has lower average anomalies for the baseline period 1961-1990, thereby showing higher current anomalies than v.3. This analysis concerns more recent time periods and depends on very similar differentials as those from v.3 despite higher absolute anomaly values in v.4.  More on what distinguishes HadSST3 and 4 from other SST products at the end. The user guide for HadSST4 is here.

The Current Context

The chart below shows SST monthly anomalies as reported in HadSST4 starting in 2015 through April 2023.  A global cooling pattern is seen clearly in the Tropics since its peak in 2016, joined by NH and SH cycling downward since 2016. 

Note that in 2015-2016 the Tropics and SH peaked in between two summer NH spikes.  That pattern repeated in 2019-2020 with a lesser Tropics peak and SH bump, but with higher NH spikes. By end of 2020, cooler SSTs in all regions took the Global anomaly well below the mean for this period.  In 2021 the summer NH summer spike was joined by warming in the Tropics but offset by a drop in SH SSTs, which raised the Global anomaly slightly over the mean.

Then in 2022, another strong NH summer spike peaked in August, but this time both the Tropic and SH were countervailing, resulting in only slight Global warming, later receding to the mean.   Oct./Nov. temps dropped  in NH and the Tropics took the Global anomaly below the average for this period. After an uptick in December, temps in January 2023 dropped everywhere, strongest in NH, with the Global anomaly further below the mean since 2015.

Now comes El Nino as shown by the upward spike in the Tropics since January, the anomaly nearly doubling from 0.45C to 0.83C.  SH stayed the same as March, but NH also increased 0.13, resulting in a Global anomaly of 0.85C.  That’s above the average for this period by 0.17C, while Global January was slightly below the mean for this period.

A longer view of SSTs

To enlarge image open in new tab.

The graph above is noisy, but the density is needed to see the seasonal patterns in the oceanic fluctuations.  Previous posts focused on the rise and fall of the last El Nino starting in 2015.  This post adds a longer view, encompassing the significant 1998 El Nino and since.  The color schemes are retained for Global, Tropics, NH and SH anomalies.  Despite the longer time frame, I have kept the monthly data (rather than yearly averages) because of interesting shifts between January and July.1995 is a reasonable (ENSO neutral) starting point prior to the first El Nino. 

The sharp Tropical rise peaking in 1998 is dominant in the record, starting Jan. ’97 to pull up SSTs uniformly before returning to the same level Jan. ’99. There were strong cool periods before and after the 1998 El Nino event. Then SSTs in all regions returned to the mean in 2001-2. 

SSTS fluctuate around the mean until 2007, when another, smaller ENSO event occurs. There is cooling 2007-8,  a lower peak warming in 2009-10, following by cooling in 2011-12.  Again SSTs are average 2013-14.

Now a different pattern appears.  The Tropics cooled sharply to Jan 11, then rise steadily for 4 years to Jan 15, at which point the most recent major El Nino takes off.  But this time in contrast to ’97-’99, the Northern Hemisphere produces peaks every summer pulling up the Global average.  In fact, these NH peaks appear every July starting in 2003, growing stronger to produce 3 massive highs in 2014, 15 and 16.  NH July 2017 was only slightly lower, and a fifth NH peak still lower in Sept. 2018.

The highest summer NH peaks came in 2019 and 2020, only this time the Tropics and SH were offsetting rather adding to the warming. (Note: these are high anomalies on top of the highest absolute temps in the NH.)  Since 2014 SH has played a moderating role, offsetting the NH warming pulses. After September 2020 temps dropped off down until February 2021.  In 2021-22 there were again summer NH spikes, but in 2022 moderated first by cooling Tropics and SH SSTs, then in October to January 2023 by deeper cooling in NH and Tropics.  

Now in 2023 the Tropics flip from below to above average, and NH starts building up for a summer peak comparable to previous years.

What to make of all this? The patterns suggest that in addition to El Ninos in the Pacific driving the Tropic SSTs, something else is going on in the NH.  The obvious culprit is the North Atlantic, since I have seen this sort of pulsing before.  After reading some papers by David Dilley, I confirmed his observation of Atlantic pulses into the Arctic every 8 to 10 years.

Contemporary AMO Observations

Through January 2023 I depended on the Kaplan AMO Index (not smoothed, not detrended) for N. Atlantic observations. But it is no longer being updated, and NOAA says they don’t know its future.  So I find only the Hadsst AMO dataset has Feb. and March data.  It differs from Kaplan, which reported average absolute temps measured in N. Atlantic.  “Hadsst AMO  follows Trenberth and Shea (2006) proposal to use the NA region EQ-60°N, 0°-80°W and subtract the global rise of SST 60°S-60°N to obtain a measure of the internal variability, arguing that the effect of external forcing on the North Atlantic should be similar to the effect on the other oceans.”  So the values represent differences between the N. Atlantic and the Global ocean.

The chart above confirms what Kaplan also showed.  As August is the hottest month for the N. Atlantic, its varibility, high and low, drives the annual results for this basin.  Note also the peaks in 2010, lows after 2014, and a rise in 2021. An annual chart below is informative:

Note the difference between blue/green years, beige/brown, and purple/red years.  2010, 2021, 2022 all peaked strongly in August or September.  1998 and 2007 were mildly warm.  2016 and 2018 were matching or cooler than the global average.  2023 is starting out slightly warm.

Summary

The oceans are driving the warming this century.  SSTs took a step up with the 1998 El Nino and have stayed there with help from the North Atlantic, and more recently the Pacific northern “Blob.”  The ocean surfaces are releasing a lot of energy, warming the air, but eventually will have a cooling effect.  The decline after 1937 was rapid by comparison, so one wonders: How long can the oceans keep this up? 

Footnote: Why Rely on HadSST4

HadSST is distinguished from other SST products because HadCRU (Hadley Climatic Research Unit) does not engage in SST interpolation, i.e. infilling estimated anomalies into grid cells lacking sufficient sampling in a given month. From reading the documentation and from queries to Met Office, this is their procedure.

HadSST4 imports data from gridcells containing ocean, excluding land cells. From past records, they have calculated daily and monthly average readings for each grid cell for the period 1961 to 1990. Those temperatures form the baseline from which anomalies are calculated.

In a given month, each gridcell with sufficient sampling is averaged for the month and then the baseline value for that cell and that month is subtracted, resulting in the monthly anomaly for that cell. All cells with monthly anomalies are averaged to produce global, hemispheric and tropical anomalies for the month, based on the cells in those locations. For example, Tropics averages include ocean grid cells lying between latitudes 20N and 20S.

Gridcells lacking sufficient sampling that month are left out of the averaging, and the uncertainty from such missing data is estimated. IMO that is more reasonable than inventing data to infill. And it seems that the Global Drifter Array displayed in the top image is providing more uniform coverage of the oceans than in the past.

uss-pearl-harbor-deploys-global-drifter-buoys-in-pacific-ocean

USS Pearl Harbor deploys Global Drifter Buoys in Pacific Ocean


Away With Self-Fullfilling Climate Prophecy

Edward Ring explains the importance of dispelling CO2 hysteria in his American Greatness article Challenging the Premise of Our Destruction.  Excerpts in italics with my bolds and added images.

Claiming that anthropogenic CO2 will not cause catastrophic climate change is a
credible, necessary point of view backed up by scientific evidence.

The most powerful and destructive perception in the world today is that using fossil fuels will cause catastrophic climate change. This belief, marketed by every major government and corporate institution in the Western world, is the foundational premise underlying a policy agenda of stunning indifference to the aspirations of ordinary people.

The war on fossil fuel is a war on freedom, prosperity, pluralism, independence, national sovereignty, world peace, domestic tranquility, and, most ironically, the environment itself. It is a war of rich against poor, the privileged against the disadvantaged, corporate monopolies against competitive upstarts, Malthusians against optimists, regulators against innovators, and authoritarians against freedom-loving people everywhere.

But this war cannot be won unless the perception is maintained. If fossil fuel is allowed to compete against other energy alternatives for customers as a vital and growing part of an all-of-the-above energy strategy, this authoritarian political agenda falls apart.

It is reasonable to question the assertion that eliminating fossil fuels will inevitably result in an impoverished society subject to punitive restrictions on individual behavior. But the numbers are compelling and can be distilled to two indisputable facts: First, fossil fuel continues to provide over 80 percent of all energy consumed worldwide. Second, if every person living on planet Earth were to consume half as much energy per year as the average American currently consumes, global energy production would need to double.

Several inescapable conclusions derive from these two facts, if one assumes that energy is the driver of prosperity. Just in case that is not obvious, imagine Americans living with half as much energy as they use today. Where would the cuts occur? Would they drive their cars half as much? Heat their homes half as much? Operate manufacturing, farming, and mining equipment half as much? They would need to do all those things and more. The economy would collapse.

These consequences don’t escape the intelligentsia who promote “net zero” policies. These consequences explain the policies they advocate. The recent promotion of “15-minute cities” that will inform rezoning and redevelopment to put all essential services within a 15-minute walk of every residence. The rise of “congestion pricing” to charge automobiles special tolls if they drive into an expanding footprint of urban neighborhoods. “Smart growth.” “Infill.” “Urban Service Boundaries.” Bike lanes. “Smart buildings,” “smart meters,” and “smart cities.”

These innovations, all in progress, only begin to describe what is coming.

By restricting new development and systematically reducing the use of fossil fuels, the global middle class will shrink instead of grow. The wealthiest elites will buy their way out of the smart slums. Everyone else will be locked down. This is how energy poverty will play out in the modern era. It cannot be emphasized enough: If energy production is restricted, this will happen. It’s algebra. It is objective fact.

Hardly less speculative is the reaction outside the Western world. What are our elites thinking? Do they intend to start World War III? Perhaps they do. Because nothing short of war is going to stop the Chinese, Indians, Indonesians, Pakistanis, Brazilians, Nigerians, or Bangladeshis from developing every source of energy they possibly can. Just those seven nations account for half the world’s population. That’s 4 billion people. Will they stop developing energy until they at least achieve half the per capita energy consumption that Americans currently enjoy? Not a chance.

Will they get there by relying exclusively on wind and solar? Dream on.

Fossil Fuel Will Not Cause a Climate Catastrophe

If you only believe half of the preceding arguments, you must realize that Americans have been backed into a corner. If anyone calls for abundant energy—or abundant anything, since energy, and fossil fuel in particular, is the prerequisite for virtually all goods and services—they are shouted down as “climate deniers.” And the way to upset the entire edifice is not to merely argue that fossil fuel is essential to the survival of civilization. Because the counterargument is that eliminating fossil fuel is essential to the survival of the planet.

That is an unwinnable argument. It is not possible to reason with an opponent of fossil fuel if you concede their fundamental premise: that burning fossil fuel will cause catastrophic climate change. You either become a “denier,” or you submit to energy poverty.

This is the tough decision facing Americans.

And it’s accurate to also say it is a decision facing Republicans since literally every prominent, mainstream, housebroken, accommodating establishment Republican will not challenge the assertion that we’re experiencing a “climate crisis,” even though most of them know better. But this should be a bipartisan issue. For Republicans, this is an opportunity to show some backbone by rejecting the most destructive and fraudulent premise of our time. In so doing, they would unify their party, attract independent voters, and realign the nation.

The irony is stupefying. Without fossil fuel, America will enter a dark age, and the only way to control a restive population that’s seen its standard of living plummet will be through the establishment of a technology-driven police state. They are the fascists. The so-called climate deniers are fighting for prosperity and freedom.

If you want to save civilization, be a denier.

Say it loud and without reservations, and say it every chance you get. Demand that politicians publicly refute climate alarmism. It isn’t necessary to claim that the powers behind the climate cult want to enslave the world. We don’t know what motivates them. Some just want to get rich on renewables. Some want to use climate change to advance American global hegemony. But all of them rely on a fundamental moral justification: By eliminating fossil fuel, we are saving the planet from certain destruction. Focusing on the possible ulterior motives of climate alarmist leaders without first challenging their core moral argument is a fool’s errand.

There are plenty of environmental challenges. Being an environmentalist is a good thing. But there has to be balance, and there has to be debate. Claiming that anthropogenic CO2 will not cause catastrophic climate change is a credible, necessary point of view backed up by scientific evidence. If more people make that claim, the climate cult can be broken, and civilization can be rescued from oblivion.

See Also A Rational Climate Policy


An Enhanced Hippocratic Oath for a Free Society

Jeffrey A. Singer advocates for a new version of the oath to which medical doctors swear in his Newsweek article We Need a New Hippocratic Oath That Puts Patient Autonomy First.  Excerpts in italics with my bolds a added images.

A noble profession should require its students and graduates
to swear an oath revering patients’ rights and autonomy.

In the mid‐​20th century, medical schools began administering modernized versions of the oath, more applicable to modern times and sensibilities. In the last 20 or so years, many medical schools have created unique versions of the oath, often allowing students to compose them. These newer versions stray far from the oaths that older‐​generation doctors like me recited. Some have shifted the emphasis from patient care to social justice, generating a firestorm of controversy.

Yet all these oaths—traditional or modern—are self‐​indulgent.

They focus primarily on how physicians should comport themselves, relate to professional colleagues, and view the medical profession’s role. But they also regard patients similarly to how parents regard children.

The original oath states, “I will prescribe for the good of my patients… and never do harm to anyone… nor give advice which may cause his death.” But it also pledges to impart to “the sons of the master who taught me and to the disciples who have enrolled themselves and agreed to the rules of the profession, but to these alone, the precepts and the instruction” (emphasis added) anticipating the protectionism of cartelized modern medicine.

The Declaration of Geneva, composed by the World Medical Association, states “the health of my patient will be my first consideration,” while “maintaining the honor and noble traditions of the medical profession,” but makes no mention of informed consent or respecting patients’ choices.

Many medical school graduates of my generation recited the oath that Dr. Louis Lasagna, Dean of Tufts University Medical School, composed in 1964. The oath pays proper fealty to patients’ privacy and to treat the whole patient—not just a set of lab tests or x‑rays. And it pledges to “not play at God.” But the oath makes no references to patients’ freedom and autonomy.

Since the 1990s, many medical schools have added “white coat ceremonies” to the list of medical school rituals. These are ceremonies for incoming classes of medical students, where they also recite a version of the Hippocratic oath.  The 2019 white coat ceremony oath for Harvard Medical School and Harvard School of Dental Medicine vowed to “place ethics and equity at the core of each patient interaction,” “combat structural oppression,” “promote social justice,” and “leverage our position of privilege to confront health inequities.” No mention of patients as autonomous individuals.

Among the most controversial oaths was the white coat ceremony oath taken last September by incoming medical students at the University of Minnesota Twin Cities Medical School. After noting that the Medical School “is located on Dakota land” and committing to “uprooting the legacy and perpetuation of structural violence within the healthcare system,” the students pledged to “honor all indigenous ways of healing that have been historically marginalized by Western medicine” and did not only commit to healing the sick but to “healing our planet and communities.”

None of the oaths, dating back to the original, make more than a passing mention of respect for patients as autonomous, sovereign adults. All of them smack of paternalism. None of these oaths prioritize or consistently apply a commitment to individual patient autonomy, including respect for patients’ rights to self‐​medicate and to seek treatment from any health care provider they choose—an oath that states, for example,

“Even if they act against my advice and I disapprove of their choices, I will respect the right of my patients as autonomous adults to self‐​medicate and oppose any laws and regulations that force them to seek my permission—or permission from any other health professional, through a prescription or otherwise—to consume medications or treatments according to their independent judgment.”

Today’s medical students should reject being forced to take oaths that have nothing to do with patient care. Instead, a noble profession should require its students and graduates to swear an oath revering patients’ rights and autonomy.

Footnote:  Overheard on a golf course: 

Q:  What’s the difference between God and a Doctor?
A:  God knows He’s not a Doctor.

Q:  What’s the difference between a general practitioner and a specialist?
A:  One treats what you have, the other thinks you have what they treat.

Q:  What is a double-blind study?
A:  Two orthopaedists reading an electrocardiogram.

Q: Did you hear she married her radiologist?
A:  I wonder what he saw in her.

Q:  Why have I had to wait two hours to see the Doctor?
A:  That why we call you “patient.”


Claim: Now Heat Extremes Are “Statistically Impossible.”

There’s a lot of buzz about a current article:  ‘Statistically Impossible’ Heat Extremes Are Here.   The authors state: 

Looking at historical data from 1959 to 2021, we found that 31% of Earth’s land surface has already experienced such statistically implausible heat (though the Pacific Northwest heatwave is exceptional even among these events). These regions are spread all across the globe with no clear spatial pattern.

In the summer of 2021, Canada’s all-time temperature record was smashed by almost 5℃. Its new record of 49.6℃ is hotter than anything ever recorded in Spain, Turkey or indeed anywhere in Europe.  The record was set in Lytton, a small village a few hours’ drive from Vancouver, in a part of the world that doesn’t really look like it should experience such temperatures. Lytton was the peak of a heatwave that hit the Pacific Northwest of the US and Canada that summer and left many scientists shocked. From a purely statistical point of view, it should have been impossible.   Overall, our work raises two important points:

The first is that statistically implausible heatwaves can occur anywhere on the Earth, and we must be very cautious about using the historical record in isolation to estimate the “maximum” heatwave possible. Policymakers across the globe should prepare for exceptional heatwaves that would be deemed implausible based on current records.

The second is that there are a number of regions whose historical record is not exceptional, and therefore is more likely to be broken. These regions have been lucky so far, but as a result, are likely to be less well prepared for an unprecedented heatwave in the near future. It is especially important that these regions prepare for more intense heatwaves than they have already experienced.

My Comment:

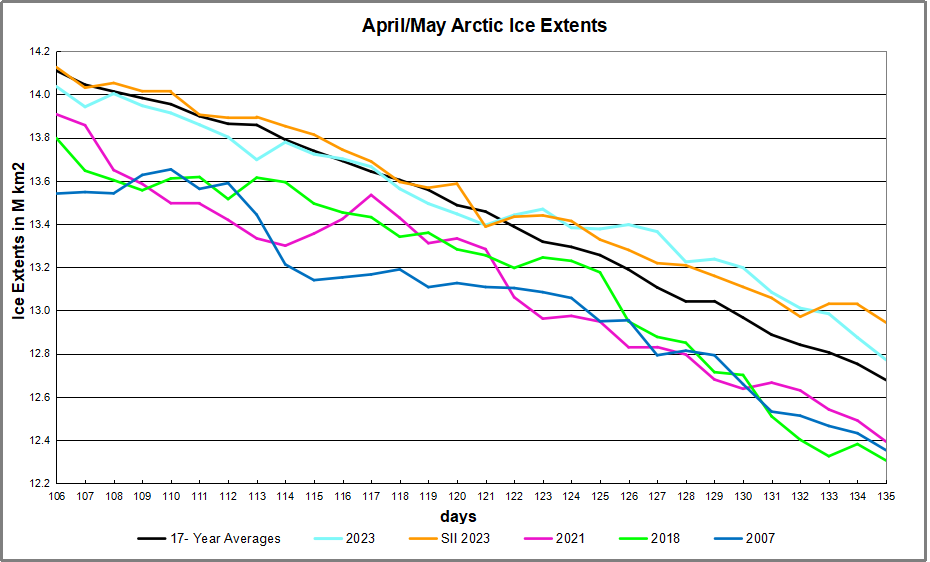
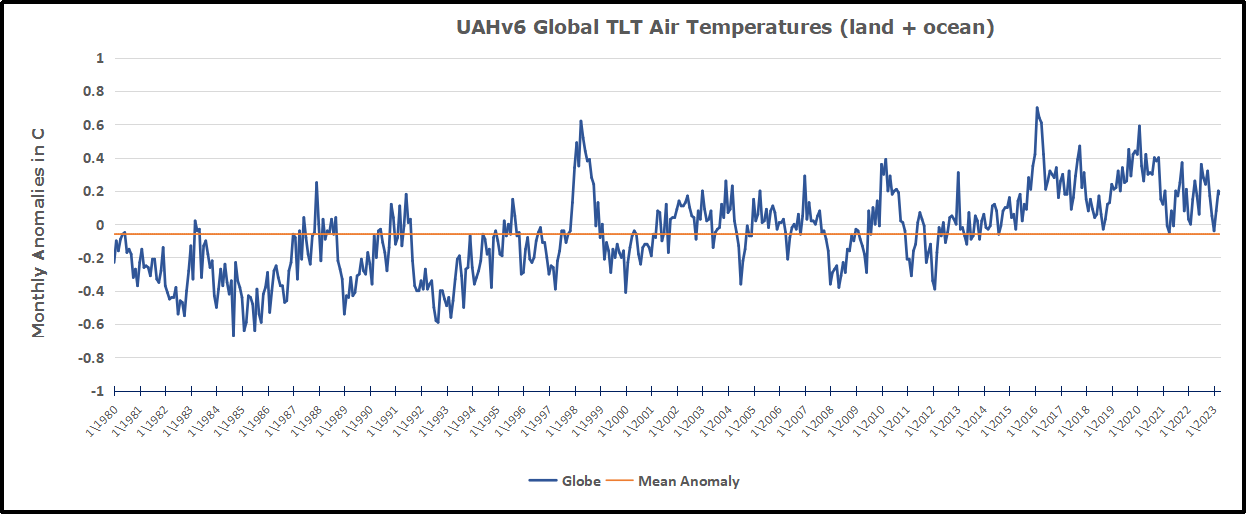
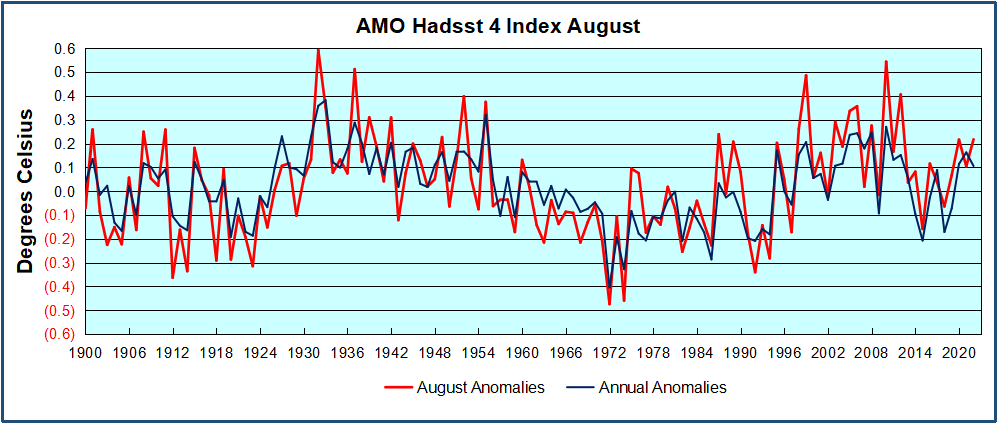
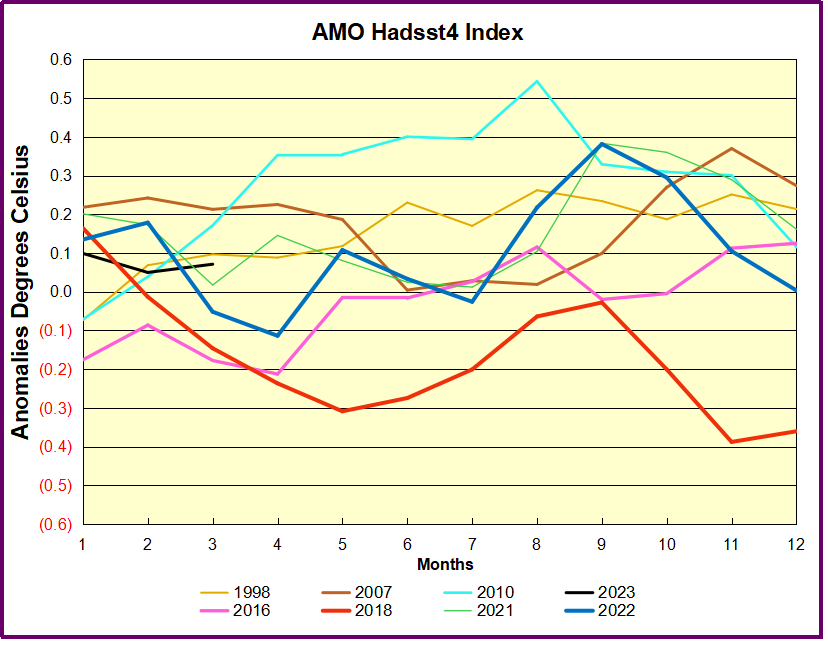
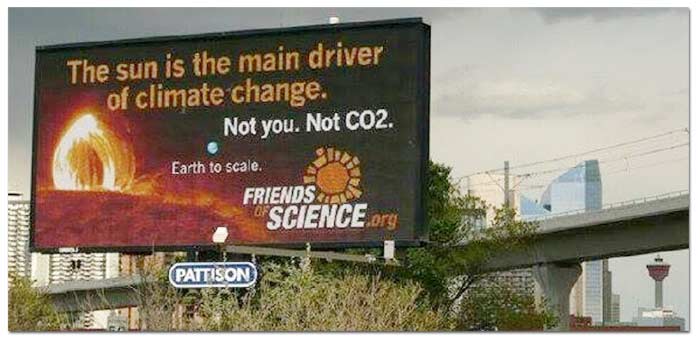
So the conclusion is a familar alamist meme:  If you’ve had a heat extreme, there will be more; If not you’d best get ready for them.  What is left out are the simple lessons in the image at the top. The 2021 Pacifc Northwest heat wave happened all right, but it was a cold spot in 2019, when the East coast was hot.  Since the overall average temperatures change very little, hot spots in some places will be offset by cold spots in others. But by obsessing on the heat and ignoring the cold, the narrative of a burning planet is proclaimed.  

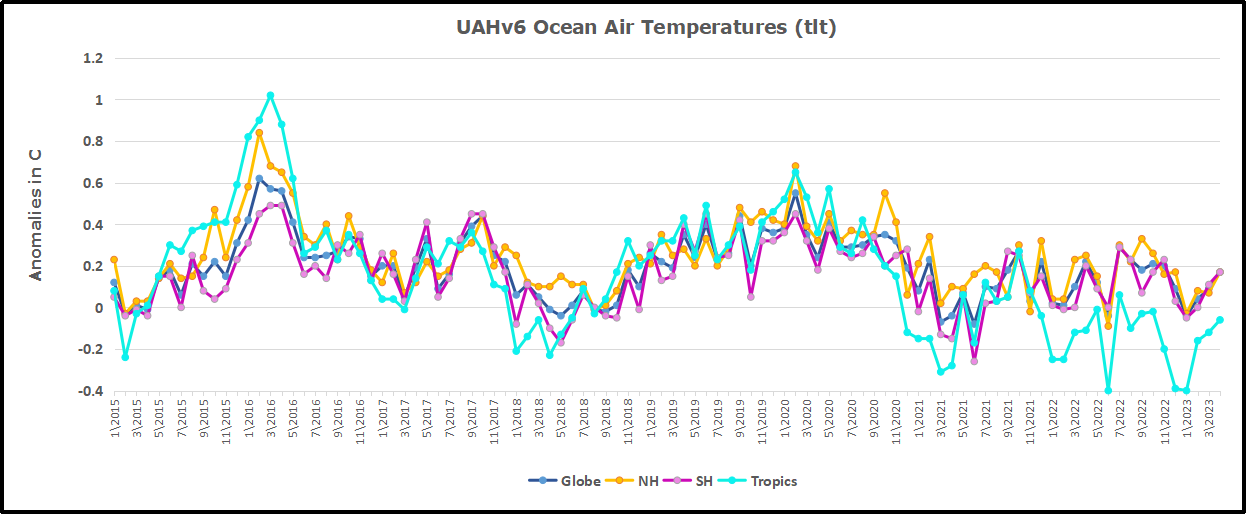
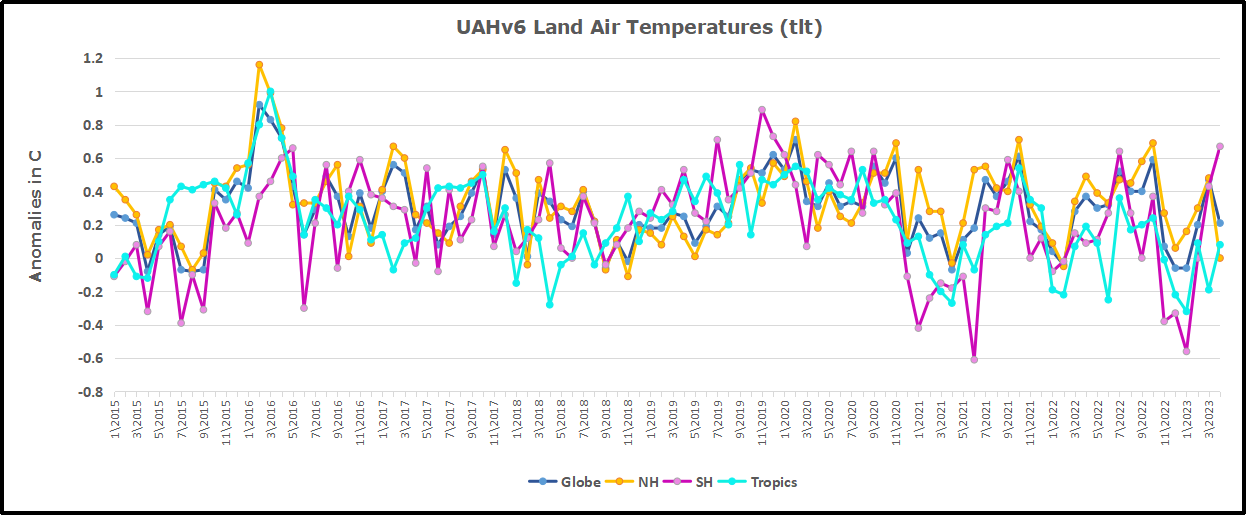
Furthermore, as a previous post below explains, average temperatures hide a particular Northern Hemisphere pattern, namely the concurrence of warm summers and cold winters in the same year.

Rannoch Moor, Scotland

Previous Post: Heat Waves: Historical, not Hysterical Context

Alarms are being sounded about heat waves in the Northern Hemisphere, noting heat waves in Eastern Canada and US, wildfires in N. Sweden and Siberia.  The recent (2018) UK lawsuit featured the advocate claiming the Arctic is burning, so global warming is no longer in doubt.  Thus UK needs to up its carbon reduction targets.

The High Court disagreed.  And for good reasons not cited by the judge.  The hot dry weather this summer in Siberia was preceded by extreme cold and massive snowfall, unusual winter conditions even for that climate zone.  Similarly, there have been cold winters across Eurasia, while Northern Europe enjoys a BBQ summer.  BTW, I recall seeing on TV May and June tennis matches in Spain where spectators were wearing jackets and head covering against the cold.

What is going on?  Fact: Concurrent warm summers and cold winters are a feature of the North Atlantic climate system.  It has gone on periodically throughout history, and long before humans burned fossil fuels.  Below is evidence providing insight into our present experience of 2018 weather.

Concurrent Warming and Cooling

This post highlights recent interesting findings regarding past climate change in NH, Scotland in particular. The purpose of the research was to better understand how glaciers could be retreating during the Younger Dryas Stadia (YDS), one of the coldest periods in our Holocene epoch.

The lead researcher is Gordon Bromley, and the field work was done on site of the last ice fields on the highlands of Scotland. 14C dating was used to estimate time of glacial events such as vegetation colonizing these places. Bromely explains in article Shells found in Scotland rewrite our understanding of climate change at siliconrepublic. Excerpts in italics with my bolds.

By analysing ancient shells found in Scotland, the team’s data challenges the idea that the period was an abrupt return to an ice age climate in the North Atlantic, by showing that the last glaciers there were actually decaying rapidly during that period.

The shells were found in glacial deposits, and one in particular was dated as being the first organic matter to colonise the newly ice-free landscape, helping to provide a minimum age for the glacial advance. While all of these shell species are still in existence in the North Atlantic, many are extinct in Scotland, where ocean temperatures are too warm.

This means that although winters in Britain and Ireland were extremely cold, summers were a lot warmer than previously thought, more in line with the seasonal climates of central Europe.

“There’s a lot of geologic evidence of these former glaciers, including deposits of rubble bulldozed up by the ice, but their age has not been well established,” said Dr Gordon Bromley, lead author of the study, from NUI Galway’s School of Geography and Archaeology.

“It has largely been assumed that these glaciers existed during the cold Younger Dryas period, since other climate records give the impression that it was a cold time.”

He continued: “This finding is controversial and, if we are correct, it helps rewrite our understanding of how abrupt climate change impacts our maritime region, both in the past and potentially into the future.”

The recent report is Interstadial Rise and Younger Dryas Demise of Scotland’s Last Ice Fields
G. Bromley A. Putnam H. Borns Jr T. Lowell T. Sandford D. Barrell  First published: 26 April 2018.(my bolds)

Abstract

Establishing the atmospheric expression of abrupt climate change during the last glacial termination is key to understanding driving mechanisms. In this paper, we present a new 14C chronology of glacier behavior during late‐glacial time from the Scottish Highlands, located close to the overturning region of the North Atlantic Ocean. Our results indicate that the last pulse of glaciation culminated between ~12.8 and ~12.6 ka, during the earliest part of the Younger Dryas stadial and as much as a millennium earlier than several recent estimates. Comparison of our results with existing minimum‐limiting 14C data also suggests that the subsequent deglaciation of Scotland was rapid and occurred during full stadial conditions in the North Atlantic. We attribute this pattern of ice recession to enhanced summertime melting, despite severely cool winters, and propose that relatively warm summers are a fundamental characteristic of North Atlantic stadials.

Plain Language Summary

Geologic data reveal that Earth is capable of abrupt, high‐magnitude changes in both temperature and precipitation that can occur well within a human lifespan. Exactly what causes these potentially catastrophic climate‐change events, however, and their likelihood in the near future, remains frustratingly unclear due to uncertainty about how they are manifested on land and in the oceans. Our study sheds new light on the terrestrial impact of so‐called “stadial” events in the North Atlantic region, a key area in abrupt climate change. We reconstructed the behavior of Scotland’s last glaciers, which served as natural thermometers, to explore past changes in summertime temperature. Stadials have long been associated with extreme cooling of the North Atlantic and adjacent Europe and the most recent, the Younger Dryas stadial, is commonly invoked as an example of what might happen due to anthropogenic global warming. In contrast, our new glacial chronology suggests that the Younger Dryas was instead characterized by glacier retreat, which is indicative of climate warming. This finding is important because, rather than being defined by severe year‐round cooling, it indicates that abrupt climate change is instead characterized by extreme seasonality in the North Atlantic region, with cold winters yet anomalously warm summers.

The complete report is behind a paywall, but a 2014 paper by Bromley discusses the evidence and analysis in reaching these conclusions. Younger Dryas deglaciation of Scotland driven by warming summers  Excerpts with my bolds.

Significance: As a principal component of global heat transport, the North Atlantic Ocean also is susceptible to rapid disruptions of meridional overturning circulation and thus widely invoked as a cause of abrupt climate variability in the Northern Hemisphere. We assess the impact of one such North Atlantic cold event—the Younger Dryas Stadial—on an adjacent ice mass and show that, rather than instigating a return to glacial conditions, this abrupt climate event was characterized by deglaciation. We suggest this pattern indicates summertime warming during the Younger Dryas, potentially as a function of enhanced seasonality in the North Atlantic.

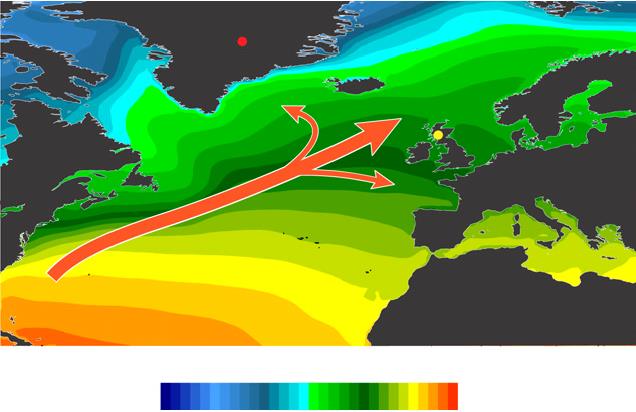
Surface temperatures range from -30C to +30C

Fig. 1. Surface temperature and heat transport in the North Atlantic Ocean.  The relatively mild European climate is sustained by warm sea-surface temperatures and prevailing southwesterly airflow in the North Atlantic Ocean (NAO), with this ameliorating effect being strongest in maritime regions such as Scotland. Mean annual temperature (1979 to present) at 2 m above surface (image obtained using University of Maine Climate Reanalyzer, http://www.cci-reanalyzer.org). Locations of Rannoch Moor and the GISP2 ice core are indicated.

Thus the Scottish glacial record is ideal for reconstructing late glacial variability in North Atlantic temperature (Fig. 1). The last glacier resurgence in Scotland—the “Loch Lomond Advance” (LLA)—culminated in a ∼9,500-km2 ice cap centered over Rannoch Moor (Fig. 2A) and surrounded by smaller ice fields and cirque glaciers.

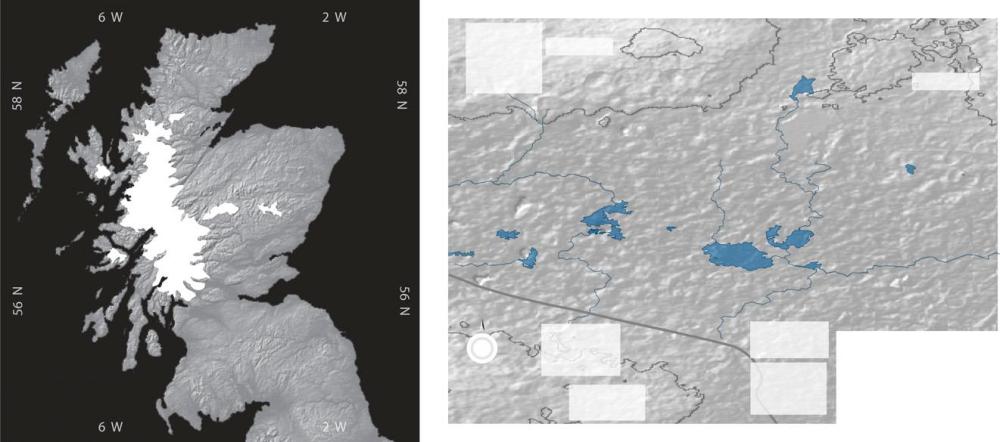
Fig. 2. Extent of the LLA ice cap in Scotland and glacial geomorphology of western Rannoch Moor. (A) Maximum extent of the ∼9,500 km2 LLA ice cap and larger satellite ice masses, indicating the central location of Rannoch Moor. Nunataks are not shown. (B) Glacial-geomorphic map of western Rannoch Moor. Distinct moraine ridges mark the northward active retreat of the glacier margin (indicated by arrow) across this sector of the moor, whereas chaotic moraines near Lochan Meall a’ Phuill (LMP) mark final stagnation of ice. Core sites are shown, including those (K1–K3) of previous investigations (14, 15).

When did the LLA itself occur? We consider two possible resolutions to the paradox of deglaciation during the YDS. First, declining precipitation over Scotland due to gradually increasing North Atlantic sea-ice extent has been invoked to explain the reported shrinkage of glaciers in the latter half of the YDS (18). However, this course of events conflicts with recent data depicting rapid, widespread imposition of winter sea-ice cover at the onset of the YDS (9), rather than progressive expansion throughout the stadial.

Loch Lomond

Furthermore, considering the gradual active retreat of LLA glaciers indicated by the geomorphic record, our chronology suggests that deglaciation began considerably earlier than the mid-YDS, when precipitation reportedly began to decline (18). Finally, our cores contain lacustrine sediments deposited throughout the latter part of the YDS, indicating that the water table was not substantially different from that of today. Indeed, some reconstructions suggest enhanced YDS precipitation in Scotland (24, 25), which is inconsistent with the explanation that precipitation starvation drove deglaciation (26).

We prefer an alternative scenario in which glacier recession was driven by summertime warming and snowline rise. We suggest that amplified seasonality, driven by greatly expanded winter sea ice, resulted in a relatively continental YDS climate for western Europe, both in winter and in summer. Although sea-ice formation prevented ocean–atmosphere heat transfer during the winter months (10), summertime melting of sea ice would have imposed an extensive freshwater cap on the ocean surface (27), resulting in a buoyancy-stratified North Atlantic. In the absence of deep vertical mixing, summertime heating would be concentrated at the ocean surface, thereby increasing both North Atlantic summer sea-surface temperatures (SSTs) and downwind air temperatures. Such a scenario is analogous to modern conditions in the Sea of Okhotsk (28) and the North Pacific Ocean (29), where buoyancy stratification maintains considerable seasonal contrasts in SSTs. Indeed, Haug et al. (30) reported higher summer SSTs in the North Pacific following the onset of stratification than previously under destratified conditions, despite the growing presence of northern ice sheets and an overall reduction in annual SST. A similar pattern is evident in a new SST record from the northeastern North Atlantic, which shows higher summer temperatures during stadial periods (e.g., Heinrich stadials 1 and 2) than during interstadials on account of amplified seasonality (30).

Our interpretation of the Rannoch Moor data, involving the summer (winter) heating (cooling) effects of a shallow North Atlantic mixed layer, reconciles full stadial conditions in the North Atlantic with YDS deglaciation in Scotland. This scenario might also account for the absence of YDS-age moraines at several higher-latitude locations (12, 36–38) and for evidence of mild summer temperatures in southern Greenland (11). Crucially, our chronology challenges the traditional view of renewed glaciation in the Northern Hemisphere during the YDS, particularly in the circum-North Atlantic, and highlights our as yet incomplete understanding of abrupt climate change.

Summary

Several things are illuminated by this study. For one thing, glaciers grow or recede because of multiple factors, not just air temperature. The study noted that glaciers require precipitation (snow) in order to grow, but also melt under warmer conditions. For background on the complexities of glacier dynamics see Glaciermania

Also, paleoclimatology relies on temperature proxies who respond to changes over multicentennial scales at best. C14 brings higher resolution to the table.

Finally, it is interesting to consider climate changing with respect to seasonality.  Bromley et al. observe that during Younger Dryas, Scotland shifted from a moderate maritime climate to one with more seasonal extremes like that of inland continental regions. In that light, what should we expect from cooler SSTs in the North Atlantic?

Note also that our modern warming period has been marked by the opposite pattern. Many NH temperature records show slight summer cooling along with somewhat stronger warming in winter, the net being the modest (fearful?) warming in estimates of global annual temperatures.  Then of course there are anomalous years like this one where cold winters combine with warm summer periods.


Messing Up Child Identities

Frank Furedi writes at Spiked The making of an identity crisis.  Excerpts in italics with my bolds and added images.

The rise of gender-confused children is nothing to celebrate.

Western societies are experiencing a massive rise in the proportion of young people who identify as LGBT. Nowhere is this more noticeable than in the US.

According to a recent report, published by the US Centers for Disease Control and Prevention (CDC), 25 per cent of high-school students now identify as LGBT. The CDC found that 12.2 per cent of teens self-identify as bisexual, 5.2 per cent identify as ‘questioning’, 3.2 per cent identify as gay or lesbian, and 3.9 per cent identify as ‘other’. In fact, the current percentage of American adults who do not identify as heterosexual is double what it was a decade ago.

There has been a similar transformation when it comes to gender identity. Last year, a CDC health survey showed that people aged between 13 and 25 accounted for a disproportionately large share of the people who identify as transgender. For instance, 18- to 24-year-olds make up just 11 per cent of the total population, but 24 per cent of the transgender population.

So what’s behind this transformation in young people’s sexual and gender identities?

 Jeffrey Jones of Gallup argues that children today have ‘grown up in a culture where being LGBT was normal and not something that people had to be embarrassed about or tried to hide’. Similarly, those working within the LGBT sector claim that younger people simply feel more comfortable than older people in displaying their ‘authentic’ selvesPhillip Hammack, director of the Sexual and Gender Diversity Lab at the University of California, Santa Cruz, likens the recent rise in trans identification to the increased ‘visibility’ of young people labelling themselves gay, lesbian and bisexual in the 1990s. As one commentator put it, ‘the uptick in queer youth… indicates that more people are comfortable with being openly honest about their sexual orientation and identities’.

But this explanation is only part of the story. It is certainly true that more people in the past hid their sexualities than they do today. The gay and lesbian movement has indeed fostered a greater tolerance towards sexual minorities. But it is not as if young people are now simply left alone to draw their own conclusions about their identity. On the contrary, LGBT identities have become more prevalent because Western societies treat them as special.

Children are picking up the message that it is good to be LGBT,
and potentially problematic to be straight or ‘cis gender’
.

This dynamic is especially pronounced when it comes to transgender identities. Educational and cultural institutions are playing a key role in encouraging young people to question whether their ‘gender identity’ aligns with their biological sex. What’s more, these institutions tend to present gender and sexuality as central facets of people’s lives – as the qualities that define our existence and identity.

At the same time, childhood has become far more sexualised.

Sex education is not only being offered to younger and younger pupils – its remit is also constantly expanding. Schools may once have taught students about the biological facts of sex, or how to avoid pregnancy and sexually transmitted infections. But now the focus has shifted towards sexuality and gender identity. Schools today self-consciously encourage children not to take their biological identity as girls or boys for granted. Children as young as four or five are urged to reflect on their identity and to be open to the idea that they are ‘genderfluid’ or ‘nonbinary’.

All of this has had an incredibly disorienting effect on children. Young children need certainty and constant assurance about their place in the world. But they are not getting that today. Adult society has abandoned its responsibility for socialising them. Instead, children are encouraged to focus on their sexuality and gender and to explore and question who they are.

The result is an ever-growing crisis of identity among the young.

Advocates of these developments like to flatter themselves. They like to think they are fostering a climate of openness, in which young people are free to discover their true selves. Instead, they are leaving many young people disoriented and confused.

Attempt to Impose Western Sexuality Agenda on Children Resisted by Rest of the World

Little noticed was a recent failure of US and EU to convince Asia, Africa and Latin America to follow the Western grooming of school children.  Below are excerpts from the UN Commission report April 14, 2023, where the agenda was tabled, after many years of promonting it.

Disagreeing over References to Comprehensive Sexual Education, Delegates Fail to Adopt Draft Resolution, as Commission on Population and Development Concludes Session

The Commission on Population and Development ended its fifty-sixth session today, unable to adopt by consensus a draft resolution concerning the agenda item on population, education and sustainable development.

The withdrawal of that text took place amidst a heated discussion that touched on substantive and procedural matters. Several delegates objected to the reference to comprehensive sexual education in that text, while also highlighting the lack of transparency with which some of its language was circulated. However other delegates noted that this language was already agreed upon at other times and underscored the pivotal role of comprehensive sexual and reproductive education in empowering women and youth.

“Nobody is happy with this result,” the representative of Senegal said, adding that delegates come from “different horizons and realities”, and it is important to respect all cultures. Noting that certain delegations refused to yield even one comma, he said the Commission should learn from this experience so that it can avoid disunity in the future.

“We can all sense the temperature in the room at this stage,” said the representative of Philippines, expressing the widespread agreement that a consensus-based outcome on this matter is crucial.

“I see no other possibility than to withdraw this text,” Commission Chair Gheorghe Leucă (Republic of Moldova) said after several delegates raised their objections. Prior to its withdrawal, he had urged for its adoption by consensus, calling on the Commission to demonstrate that countries are united in finding pathways out of the education crisis. Noting that he circulated language yesterday that seeks to address “our last remaining differences”, he had called on delegates to demonstrate maximum flexibility, “on behalf of the hundreds of millions of children and adults worldwide who lack access to quality education”.

Pakistan’s delegate said coming up with a new paragraph when the adoption is 11 hours away undermines the processes of the multilateral system. Speaking after the withdrawal, she reminded delegates of the 263 million children who are deprived of education. While comprehensive sexuality education may be a priority in some countries, it is regrettable that delegates of those States promoted that priority as if there was nothing else to be discussed on this resolution.

What prevents the international community from achieving Goal 4 is not the lack of sexuality education, but the lack of schools and books and water, she stressed.

Iran’s delegate said terms such as sexual and reproductive education are not acceptable to her country, while Nigeria’s delegate expressed concern about the deletion of language regarding the parents’ responsibility and right to guide the religious and moral education of their children, as well as other language relating to women’s and girls’ critical contributions to their families and children.

The representative of Ethiopia said she was not able to get guidance from her capital because of the late hour at which the new language was circulated. She said operative paragraphs 16 and 17 represent a red line that countries such as hers will not cross.

However, the representative of Sweden, speaking for the European Union, commended the text for its language focusing on ensuring access to sexual and reproductive health and reproductive health-care services. The reference to evidence-based comprehensive education on human sexuality is language that has been previously agreed by the Commission, she said. Expressing regret that, despite her delegation’s flexibility, an outcome could not be reached, she said it is frustrating that a small number of countries prevented an outcome. She reiterated every individual’s right to quality and affordable sexual and reproductive education.

The speaker for Ghana said comprehensive sexuality education aims to equip children and young people with knowledge, skills, attitudes and values to make choices, just like any education. In her country, it helps prevent teenage pregnancies and child marriages while serving as a reminder that access to water in schools is a right. Comprehensive sexuality education helps people choose life over death and good over bad. “My mind goes back to Africa,” she said, adding that information is power. Later, she clarified that she was not speaking on behalf of African countries.

She also underscored that she was talking of reproductive health
education and services, as based on country norms,
and not on comprehensive sexuality education.

What is Comprehensive Sexuality Education?

By now you’re aware that CSE is a loaded term and wondering what it means.  Here’s a video and a website that provides answers to that question.  All you wanted to know, but were afraid to ask.

Ten minute video here: http://www.comprehensivesexualityeducation.org/act-now-2/stop-cse-petition/

Footnote:  More Good News, From Chile

Chilean Right Triumphs In Key Vote On Attempt To Impose ‘World’s Most Progressive’ Constitution

For example a year ago as the new draft was pushed forward, The Guardian quoted progressives as follows:

María Elisa Quinteros, the president of the gender-equal, 154-member assembly will formally present the draft at a ceremony in the port city of Antofagasta on Monday afternoon.

“This is an ecological and equal constitution with social rights at its very core,” she said in an interview.

Among the long list of rights and freedoms the draft enshrines, the new constitution makes higher education free, ensures gender parity across government and makes the state responsible for preventing, adapting to and mitigating climate change.

One social media commentator noted the progressives’ rewrite plan ultimately backfired in spectacular fashion…

  1. Socialists in Chile attempt to rewrite the constitution
  2. It backfired so hard they give the right-wing parties a supermajority in parliament 
  3. Socialists effectively handed the mandate to rewrite the country’s constitution to a bunch of Pinochetists

This “new vision” has been roundly rejected with Sunday’s vote. It was largely independent and left-wing constituents which had drafted that first attempt at a major overhaul, following previous mass street protests against inequality which demanded drastic reforms.