New Puritans On the March

Andrew Doyle writes at Spiked The New Puritans must be stopped.  Excerpts in italics with my bolds and added images

A regressive, authoritarian ideology is cannibalising public life.

My book, The New Puritans: How the Religion of Social Justice Captured the Western World, is my attempt to grapple with this disturbing new reality. A new paperback edition has been published this week, and I had hoped that by this point, it would already have started to seem out of date. In truth, the problems I describe in the book are accelerating. Novels by Roald Dahl, PG Wodehouse and Agatha Christie have since been rewritten by ‘sensitivity readers’ (newspeak for ‘censors’). The Irish government is currently passing new hate-speech laws that are similarly draconian to those passed by the Scottish government in 2021. Prestigious scientific journals are publishing pseudoscience in order to uphold this new ideology, too. Only this week the Scientific American ran a piece entitled ‘Here’s why human sex is not binary’, illustrated with an image of the male and female gametes that prove that it is.

It’s difficult to keep up with these baffling developments. Most of us have noticed the rise of this new ideology that is now dominant in all of our major cultural, educational, political and corporate institutions. We can see that its impact is divisive, regressive and illiberal, and yet it describes itself using progressive-sounding terminology, such as ‘social justice’, ‘anti-racism’ and ‘equity’.

When language becomes unmoored from meaning,
we are all at risk of mistaking change for progress.

We have seen that the disciples of this new religion are pushing for more and more censorship, whether that be through the cancellation of comedians, the deletion of potentially offensive scenes in old television shows, or stronger ‘hate speech’ laws. We have seen women physically assaulted for standing up for their sex-based rights. We have seen how anyone who questions the new orthodoxies jeopardises their career prospects and risks being publicly shamed. The existence of what we now call ‘cancel culture’ is often denied by those who indulge in it the most, but its list of casualties expands by the day.

Those of us who are taking a stand against these cultural revolutionaries are often told that we should just ignore them. Who cares if a few zealots are demanding that we attend ‘unconscious bias’ training sessions? Who cares if civil servants and teachers and staff at the BBC are being encouraged to announce their pronouns in emails and at the beginning of meetings? Who cares if the Ministry of Defence is holding LGBTQIA+ coffee mornings to discuss pansexuality? If we let them get on with it, the logic goes, all of this will just go away.

But this is very wrong. If we ignore these developments,
the culture warriors won’t fade away – they’ll win.

These activists are promoting an authoritarian creed, and are doing untold damage to our world, while believing they are making it better. If your toddler starts smashing up the crockery, you don’t just politely wait for it to finish. Sometimes you have to intervene in order to prevent further damage.


1875 was coldest in 10,000 years, Warming A Good Thing

Jørgen Peder Steffensen, of Denmark’s Niels Bohr Institute, is one of the most experienced experts in ice core analysis, in both Greenland and Antarctica. In this video he explains a coincidence that has misled those alarmed about the warming recovery since the Little Ice Age.  And if you skip to 2:25, you will see the huge error we have made and the assumptions and extrapolations based on that error.  Transcript below is from closed captions with my bolds and added images. H/T Raymond

What do ice cores tell us about the history of climate change and the present trend? 

This ice is from the Viking age around the year one thousand, also called the medieval warm period. We believe that in Greenland the Medieval Warm Period was about one and a half degrees warmer on average than today

NorthGRIP the Greenland ice core project is being reopened to drill the last few meters through the ice sheet to the rock beneath the research station. The ice core over three kilometers in length has been hauled up to the surface piece by piece, and contains important data on the history of the climate of the earth. It bears the fingerprints of climatic conditions over more than 120 thousand years.

When we remove a drilled ice core we leave a hole, and we insert a thermometer in the hole. We are able to map out the temperature through the three kilometer ice sheet. Now that temperature, if we do it precisely enough with a thousandth of a degree accuracy, then the ice has not forgotten how cold or warm it was on the surface at the time the snow fell.

So using those temperatures we have been able to reconstruct the temperatures of the last ten thousand years. Here we have our picture of the temperature reconstructions that we have from Greenland in the graphical form. And if we go back along this axis it’s going back in time. This is the last 8 000 years we have plotted here. On this axis we have the temperatures at the site in Greenland, and we can see that if we go back from now about 4000 years ago, we would have temperatures up here for about 4 000 years in the past that on average were two and a half degrees warmer than today.

Reconstructed temperatures for Greenland ice cores Dye3 and GRIP. (A) The temperature from 8000 BP to present; (B) the temperature from AD 0-2000 (after Dahl-Jensen et al., 1998). The observed difference in amplitude between the two cores is a result of their different geographic location in relation to the variability in atmospheric circulation. Source: Reconstructed-temperatures-for-Greenland-ice-cores-Dye3-and-GRIP-A

Now as we go forward to approach our time, we can see that in the period after four thousand years ago and up to the two thousand years ago (which is actually the Roman Age) the temperatures have been decreasing in Greenland by two and a half degrees. Then temperatures increased gradually up to a maximum point around a thousand years ago, we call it the Medieval Warm Period. And then temperatures declined and go down to minimum around 1650 a.d., before coming back up a little in the 18th century.

And then around 1875 we have right here the lowest point in the last 10,000 years.
And that matches exactly the time when meteorological observations started
.

Other core samples from elsewhere in Greenland confirmed that the little ice age ended about 140 years ago at the coldest point in the last 10,000 years. The natural pronounced alteration of warm and cold periods back in time has also been confirmed elsewhere in the northern hemisphere. Carbon 14 dating of organic matter from peat bogs and tree rings confirms the pattern. Also the data from stalactite caves in China and measurements from North Africa.

The problem is that we can all agree completely that we have had a global temperature increase in the 20th century. Yes, but an increase from what? It was probably an increase from the lowest point we’ve had for the last 10,000 years. And this means it will be very hard indeed to prove whether the increase of temperature in the 20th century was man-made or it’s a natural variation. That would be very hard because we made ourselves an extremely poor experiment when we started to observe meteorology at the coldest time in the last ten thousand years.

Dr. Syun Akasofu 2009 diagram from his paper Two Natural Components of Recent Warming.


ESG Battle Over Italian Energy Giant

Enel, Italy’s largest energy utility is in the news with conflict over appointing a new CEO because  aspirations differ between ESG investors and the Italian government.   There are headlines like these:

Norway’s oil fund rejects Rome’s candidate for Enel chair, Financial Times

Wanted! Investors demand Italy hire renewable expert, global networker to run Enel, Zawya

Government board nominations for Enel run into opposition, msn

Enel confirms 2023 guidance, enters press blackout on nominations, Reuters

MILAN (Reuters) – Italy’s biggest utility, Enel, confirmed its full-year guidance and entered a press blackout period ahead of a May 10 shareholder vote on a challenged board shake-up.

The group, whose main shareholder is Italy’s Treasury with nearly a 24%-stake, is at the centre of a governance row that will be decided at the AGM scheduled for next Wednesday.

The Treasury has proposed a new management, putting forward a slate of six new candidates and ousting current Enel CEO Francesco Starace, who has been at the helm since 2014.

Hedge fund Covalis, which holds around 1% in Enel, presented an alternative list of nominees, criticising the process under which the government picked its candidates.  Covalis said the system that led to the government’s nominations “undermines investor confidence, erodes value and is out of line with international standards of best practice in shareholder democracy”.[Would those best practices be ESG?]

Proxy adviser Frontis Governance has urged shareholders to back the candidates promoted by Covalis and reject names put forward by the Treasury, in a report tailored for Switzerland’s Ethos, a group of pension funds and other investors.

On the financial side, Enel’s ordinary earnings before interest, taxes, depreciation and amortization (EBITDA) in the first quarter rose 22% to 5.5 billion euros above an analyst consensus of 5.4 billion euros.  Net debt at the end of March was 58.9 billion euros, down from 60.1 billion euros at the end of last year.

Starace described the results in the first three months of 2023 as outstanding and said the group had already exceeded half of its 21 billion euro ($23 billion) asset sale target unveiled last November.

The state-controlled group intends to focus its business on the core markets of Italy, Spain, the United States, Brazil, Chile and Colombia.

Wanted! Investors demand Italy hire renewable expert, global networker to run Enel,  Zawya

Expertise in renewables and an international focus are what investors want to see from a new head of state-controlled Enel, as Italy’s government screens candidates to replace the energy group’s long-serving chief executive.

Prime Minister Giorgia Meloni’s administration is determined to oust current CEO Francesco Starace, several sources told Reuters. In charge since 2014, Starace is in the crosshairs of Meloni’s inner circle as he is deemed too independent.

Meloni’s office is also concerned about the group’s debt pile. But sources familiar with the matter said that head hunters hired by the Treasury are finding it tricky to put forward potential successors with the broad range of skills required to run one of Europe’s largest utilities.

With almost 60 Gigawatt of installed capacity, Enel is one
of the world’s biggest players in renewable energy

Starace won plaudits for his commitment to green energy. However, investors and the government grew restless over a debt pile that had grown to around 60 billion euros ($65.40 billion) in 2022 from 45.5 billion in 2020, when Starace was reappointed for a third term.

The company, which has been hit by soaring gas prices and government measures capping bills to shield consumers, saw net profit slip to 5.4 billion euros last year, from 5.6 billion euros in 2021.

The new CEO should not sacrifice the group’s exposure to North America and confirm its dividend policy, a number of investors said.

“People in Italy may prefer that Enel focuses on making things as much as possible in its home country and not investing so much abroad, but the company has no choice… if it wants to attract foreign investors,” said Vincent McEntegart, multi-asset investment manager at Aegon Asset Management, an Enel shareholder with assets under management worth $311 billion.

For Enel, U.S. President Joe Biden’s green energy subsidy package could mean double digit returns in North America compared with single digit in Europe, McEntegart said, adding such returns would underpin the group’s attractive dividend policy.

Since Starace was appointed CEO in May 2014, Enel has increased its
installed renewable energy capacity to 59 GW from 36 GW at the end of 2013.

Starace’s mantra has been electrification of consumption and digitalisation of grids and he said last year he wanted to leverage a renewed focus on energy security around the world to accelerate the group’s exit from natural gas. The group currently plans to become carbon free in 2040.

“My priorities for the new CEO would be to continue to roll out renewables and accelerate the exit from gas,” Simone Siliani, the director for Italy’s Fondazione Finanza Etica, told Reuters.  Finanza Etica, which is an active investor on ESG issues, has been holding a tiny stake in Enel since 2008.

“Enel can make the difference if Italy wants to meet its decarbonisation goals,” added Siliani.

Summary: 

Once again we have climatist financiers using ESG to push zero carbon against the mission of providing secure and affordable energy that citizens need.


How Much Warming Reduction by Spending $50,000,000,000,000?

From Daily Caller:  Biden Official Speechless After John Kennedy Grills Him On Simple Question

Department of Energy Deputy Secretary David Turk testified Wednesday before the Senate committee on appropriations to discuss the 2024 budget request for the Department of Energy.

Kennedy noted the budget requests a 38% increase in green energy funding while cutting nuclear energy funding with barely an increase fossil fuel energy. Kennedy then asked Turk for an estimate of how much it would cost to be carbon neutral by 2050, with Turk refusing to provide a number. Kennedy first said Turk’s colleagues have presented a figure in the range of $50 trillion before asking how much would temperatures be affected by that massive spending.

“If you could answer my question: if we spend $50 trillion to become carbon neutral in the United States of America by 2050, you’re the deputy secretary of energy, give me your estimate of how much that is going to reduce world temperature.”

“So first of all it’s a net cost, it’s what benefits we’re having by getting our act together and reducing all of those climate benefits, we’re seeing –” Turk said before Kennedy interjected.

“I’m gonna ask again, maybe I’m not being clear: if we spent $50 trillion to become carbon neutral by 2050 in the United States of America, how much is that going to reduce world temperatures?”

“This is a global problem so we need to reduce our emissions and we need to do everything we can –”

“How much if we do our part is it going to reduce world temperatures?”

“We’re 13% of global emissions–”

“You don’t know do you?” Kennedy asked, stunning Turk who had his mouth agape. “You don’t know, do ya?”

“You can do the math–”

“You don’t know do ya Mr. Secretary?” Kennedy again asked.

“So we’re 13% of global emissions–” Turk said.

“If you know why won’t you tell me?”

“If we went to 0 that would be a 13% less pollution,” Turk said.

“You don’t know do ya? You just want us to spend $50 trillion and you don’t have the slightest idea whether it’s going to reduce world temperatures,” Kennedy said. “Now I’m all for carbon neutrality, but you’re the Deputy Secretary of the Department of Energy and you’re advocating we spend trillions of dollars to seek carbon neutrality – and this isn’t your money or my money, it’s taxpayer money – and you can’t tell me how much it’s going to lower world temperatures? Or you won’t tell me, you know but you won’t?”

“In my heart of hearts there is no way the world gets its act together on climate change unless the U.S. leads,” Turk responded, before Kennedy once again asked him for a number.

The Department of Energy is requesting $51,99 billion to, among other things, advance “critical climate goals,” according to Turk.

Bjorn Lomborg Answers the Question

From WUWT: WSJ and Lomborg show just how useless is the “Inflation Reduction Act” at tackling climate

As seen in the figure above provided by Lomborg, we get somewhere between 0.028 and 0.0009°F reduction in temperature by 2100 for about 400 billion dollars in climate spending contained in the bill.

At that rate, simple math suggests the amount of money required to achieve the much desired 1.5°C (2.7°F) reduction in temperature using the best case reduction of 0.028°F would be $38,571,428,571,428 or approximately 39 Trillion dollars. The worst-case temperature reduction of 0.0009°F would cost a staggering 1,200,000,000,000,000 dollars or ONE QUADRILLION TWO HUNDRED TRILLION DOLLARS.

To put that number in perspective, according to the World Bank, the 2020 world economy in U.S. dollars was approximately $84.7 trillion. Assuming it would actually work, to have a meaningful effect on climate, the world would have to spend about half the global annual economy for the best-case scenario. If you think inflation is bad now, just wait for those sorts of numbers.

Summary:

Even if you buy UN IPCC assumptions about reducing carbon emissions reducing global warming, the cost is outrageous for neglible benefit.  What a rip-off.


Love America or Love Woke

Update on the cultural war for America’s soul comes from the heart of California reported by Breitbart Bar Patrons Standing for National Anthem Sparks Outrage: ‘The Most Dangerous Situation’.  Excerpts in italics with my bolds and added images.

At Rainbow Oaks Restaurant — just an hour outside of San Diego — a TikTok user shared that she had faced the most “dangerous” situation she had ever been in. At noon, while she was eating her stack of pancakes, about a dozen people stood up for the Star-Spangled Banner being played on the bar’s TVs.

As first reported by Fox News, the TikTok user who goes by the screen name @Paulinaappa_0 recorded the patriotic display and included the caption: “By far the most dangerous situation I’ve ever been in #godblessamerica #getout #illegal #whitepeoplethings.”

The Tik Tok video racked up 3.1 million views and over 19,000 comments with the vast majority affirming Paulina’s feelings of fear and disgust.

For the past six years, the restaurant has played the National Anthem every day at noon, according to the restaurant’s Facebook page.

Patriotism has suffered a steep decline in the last couple of decades. A March 2023 survey conducted by the Wall Street Journal found that 38 percent of respondents said patriotism was “very important” to them. When this same question was asked in 1998, 70 percent of people said it was “very important,” the newspaper reported.

This phobia towards the National Anthem or the American flag
is not a new phenomenon.

Two years ago, the New York Post reported that a California school teacher, Kristin Pitzen, removed the American flag from her classroom and put the LGBTQ pride flag in its place. Echoing the same cry of Paulina and her thousands of commenters, Pitzen said the American flag made her feel “uncomfortable.”

As for Hollywood actor and evangelist Kirk Cameron, neither the American flag nor the National Anthem strike fear into his eyes but rather hope in his heart. A viral video from February, shows Cameron leading a room full of children and parents in the National Anthem at a public library in Savannah, Georgia, in February. Cameron is on a 14-city book tour to combat the “wokeness” being pushed on children.

“We don’t want this woke garbage,” Cameron said in an interview with the Daily Signal. “It leads to brokenness and bondage and leads to misery. What we want is what our country was built on, which was the Bible and faith and family and love for country.”

What’s Wrong With “All Cars Shall Be Electric”

First “Common Good Capitalism” is an Oxymoron

Donald J. Boudreaux explains this newly minted term and that it really means imposing choices in the marketplace.  His AIER article is What’s Called “Common Good Capitalism” Would Work Against the Common Good.  Excerpts in italics with my bolds.

The foundation upon which the case for so-called “common good capitalism” rests is rickety at best. As I explained in my previous column, the empirical claims used to justify this ill-defined version of capitalism range from questionable to downright false, while much of the economic reasoning deployed by “common good capitalists” is a nest of confusion. These flaws alone are enough to fully discredit the case for “common good capitalism.”

Yet “common good capitalism” is marred by an even deeper problem: it rejects the liberalism from which true capitalism springs, the absence of which makes impossible the operation of a dynamic market order that maximizes the prospects of individuals to achieve as many as possible of their goals.

“Common good capitalists” have in mind an economic system profoundly different from that which is championed today by liberal scholars.  What each “common good capitalist” wants is an economic system engineered to serve his or her preferred set of concrete ends. Gone would be the liberal freedom of individuals to choose and pursue their own ends. Under “common good capitalism,” everyone would be conscripted to produce and consume in ways meant to promote only the ends favored by “common good capitalists.”

Note the irony. The economic system that, say, Oren Cass claims to advocate as a means of promoting the common good is, in reality, a means of promoting only the good as conceived by Oren Cass (which, for him, consists largely of an economy with more manufacturing jobs and a smaller financial sector). The hubris here is undeniable. “Common good capitalists” not only presume to have divined which concrete ends are best to guide the actions of hundreds of millions of individuals, nearly all of whom are strangers to them, but also are so confident in their divinations that they advocate pursuing these with the use of force.


The liberal doesn’t object to attempts to persuade others to adopt different and, hopefully, better ends. By all peaceful means, do your best to persuade me to embrace, as the lodestar for my choice of concrete ends, Catholic Social Teaching, economic nationalism, Marxism, veganism, or whatever other teaching or -ism you believe best defines the common good. But do not presume that your sincere embrace of a specific system of concrete values provides sufficient warrant for you to compel me and others to behave as if we share your particular values.

To the extent that the state intrudes into market processes in order to redirect
these toward the achievement of particular ends, it replaces market
competition and cooperation with command-economy dirigisme.

Income earners are not allowed to use the fruits of their creativity and efforts as they choose. Instead, consumption ‘decisions’ will be directed by government officials. The result will be a reallocation of resources achieved through the use, mostly, of tariffs and subsidies. And by so redirecting consumption expenditures, the pattern of production will obviously also be changed from what would prevail in a free market. (In fact, the specific goal of most “common good capitalists” seems to be the achievement of a particular manner of production — for example, more factory jobs — than would arise with markets left free.)

The capitalist economy, by its very nature, is not and cannot be
a tool for achieving particular concrete outcomes.

The capitalist economy, instead, is the name that we give to that ongoing, ever-evolving, organic order of production and exchange that arises spontaneously whenever individuals are free to pursue diverse peaceful ends of their own choosing and to do so in whatever peaceful ways they think best. That the results serve the common good is clear, if by “common good” we mean the highest possible chance of as many individuals as possible to achieve as many as possible of their own individually chosen goals. But let the state attempt to constrain and contort economic activity in the pursuit of a particular set of “common” concrete ends that everyone is compelled to serve, and capitalism disappears. It is replaced by what is more accurately called “[fill in the blank]’s-particular-notion-of-the-good statism,” with the blank filled by the name of whichever “common good capitalist” happens currently to be in power.

A Case In Point:  Murphy’s Law Applies to Electric Cars and Trucks 

Forcing Consumers to Purchase Electric Vehicles: A New Low for the Biden Administration by Jonathan Lesser at Real Clear Energy. Excerpts in italics with my bolds.

If electric vehicles are so wonderful,
why are consumers and businesses being forced to buy them?

The US Environmental Protection Agency’s (EPA) new emissions standards for vehicles, released earlier this month, require manufacturers to increase overall fuel efficiency by over 25% by 2026, effectively mandating that EV’s make up two thirds of car sales. The EPA claims this will provide a total of over $1 trillion in benefits by 2055, reduce crude oil imports by 20 billion barrels, and reduce CO2 emissions by 10 billion tons.

What’s not to like? Just about everything.

Ruinous Economic Impacts

Let’s start with the economic impacts, which will be ruinous. First, the price of EVs will increase; that’s basic economics. The new rules will require that about two-thirds of the vehicles manufacturers sell are EVs. Given that most consumers do not purchase EVs, the best way to do that is to raise prices on internal combustion (ICE) vehicles until they are more costly than EVs. (Today, the reverse is true, with the average EV costing around $65,000, while the average ICE vehicle costs around $48,000.) Increasing provides an umbrella under which EV prices can be raised, too. So, if a consumer or business wants to purchase a new vehicle, they effectively will be forced to buy a more costly EV.

Battery Demand Over the Top

Second, increasing the demand for EVs will increase the demand for the materials to manufacture batteries, which are the single largest cost of an EV. Prices for rare earths, for example, have increased between 60% and 400% since 2020. Prices for lithium, the basic ingredient in most EV batteries, have increased by about 400%. Moreover, the US continues to prevent development of new mines to supply those materials. Instead, China has a stranglehold on them, and lax environmental rules to boot.

Electric Power Mostly Carbon

Then there is the electricity needed to charge those EVs, along with the charging stations in homes, apartment buildings, and on highways. Claims that this electricity will actually reduce emissions are based on huge predicted increases in wind and solar energy development. Yet, the US Energy Information Administration projects that, by 2050, wind and solar will provide only about 40% of electricity supplies. Consequently, much of the electricity needed to charge those millions of EVs will be provided by natural gas and even coal.

So, while the EPA may limit tailpipe emissions,
it will transfer many of those emissions to power plants.

Inflated Electricity Bills

Electricity costs will also increase, negating the anticipated savings from “refuelling” those EVs. That’s why the federal government has provided subsidies for wind and solar energy development for 45 years and why so many states implemented green energy mandates: developers of wind and solar could not, and still cannot, compete on price alone, despite proponents’ claims.

No Measurable Impact on Climate

But let’s suppose those hurdles magically are overcome. The environmental justification for the EPA rule is nonetheless absurd. The claimed reductions in CO2 emissions will have no measurable impact on world climate. Reducing CO2 emissions by 10 billion tons between 2027 and 2055 sounds like a lot. But world CO2 emissions were 34 billion metric tons in 2021 alone. So, over 28 years, the EPA’s proposed rule will reduce CO2 emissions by the equivalent of about four months of world CO2 emissions. And world emissions continue to increase because developing nations, especially China and India, have no intentions to restrict their economies.

Why Impose EVs?

The basic economic impacts, along with the negligible climate benefits, raise a simple question: why is the Biden Administration pursuing this EV windmill-tilting exercise? By effectively forcing consumers and businesses to purchase vehicles they do not want, the Administration will impose yet more damage on American’s standard of living, reducing mobility and raise costs.

That can’t possibly be their goal, right?

If only arm-twisting were prohibited beyond the ring.


Does More CO2 Warm or Cool the Planet?

There are various answers to the title question.  IPCC doctrine asserts that not only does more CO2 induce warming, it also triggers a water vapor positive feedback that triples the warming.  Many other scientists, including some skeptical of any climate “emergency,” agree some CO2 warming is likely, but doubt the positive feedback, with the possibility the sign is wrong. Still others point out that increases of CO2 lag temperature increases on all time scales, from ice core data to last month’s observations.  CO2 can hardly be claimed to cause warming, when CO2 changes do not precede the effect.  [See Temps Cause CO2 Changes, Not the Reverse. ]

Below is a post describing how CO2 warming is not only lacking, but more CO2 actually increases planetary cooling.  The mathematical analysis reveals a fundamental error in the past and only now subjected to correction.

Fatal Flaw in Earth Energy Balance Diagrams

Prof. Warren Stannard of Western Australia University provides the math analysis to correct the above mistaken energy balance cartoon published in 1997.  His paper in Natural Science (2018) is The Greenhouse Effect: An Evaluation of Arrhenius’ Thesis and a New Energy Equilibrium Model.  Excerpts in italics with my bolds and exhibits.

Abstract

In 1896, Svante Arrhenius proposed a model predicting that increased concentration of carbon dioxide and water vapour in the atmosphere would result in a warming of the planet. In his model, the warming effects of atmospheric carbon dioxide and water vapour in preventing heat flow from the Earth’ s surface (now known as the “Greenhouse Effect”) are counteracted by a cooling effect where the same gasses are responsible for the radiation of heat to space from the atmosphere. His analysis found that there was a net warming effect and his model has remained the foundation of the Enhanced Greenhouse Effect—Global Warming hypothesis.

This paper attempts to quantify the parameters in his equations but on evaluation his model cannot produce thermodynamic equilibrium. A modified model is proposed which reveals that increased atmospheric emissivity enhances the ability of the atmosphere to radiate heat to space overcoming the cooling effect resulting in a net cooling of the planet. In consideration of this result, there is a need for greenhouse effect—global warming models to be revised.

1. Introduction

In 1896 Arrhenius proposed that changes in the levels of “carbonic acid” (carbon dioxide) in the atmosphere could substantially alter the surface temperature of the Earth. This has come to be known as the greenhouse effect. Arrhenius’ paper, “On the Influence of Carbonic Acid in the Air upon the Temperature of the Ground”, was published in Philosophical Magazine.  Arrhenius concludes:

“If the quantity of carbonic acid in the air should sink to one-half its present percentage, the temperature would fall by about 4˚; a diminution to one-quarter would reduce the temperature by 8˚. On the other hand, any doubling of the percentage of carbon dioxide in the air would raise the temperature of the earth’s surface by 4˚; and if the carbon dioxide were increased fourfold, the temperature would rise by 8˚ ” [ 2 ].

It is interesting to note that Arrhenius considered this greenhouse effect a positive thing if we were to avoid the ice ages of the past. Nevertheless, Arrhenius’ theory has become the foundation of the enhanced greenhouse effect―global warming hypothesis in the 21st century. His model remains the basis for most modern energy equilibrium models.

2. Arrhenius’ Energy Equilibrium Model

Arrhenius’ proposed a two-part energy equilibrium model in which the atmosphere radiates the same amount of heat to space as it receives and, likewise, the ground transfers the same amount of heat to the atmosphere and to space as it receives. The model contains the following assumptions:

Heat conducted from the center of the Earth is neglected.

Heat flow by convection between the surface and the atmosphere and throughout the atmosphere remains constant.

Cloud cover remains constant. This is questionable but allows the model to be quantified.

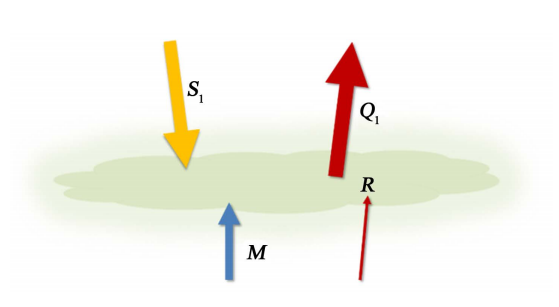
Part 1: Equilibrium of the Air

The balance of heat flow to and from the air (or atmosphere) has four components as shown in Figure 1. The arrow labelled S1 indicates the solar energy absorbed by the atmosphere. R indicates the infra-red radiation from the surface of the Earth to the atmosphere, M is the quantity of heat “conveyed” to the atmosphere by convection and Q1 represents heat loss from the atmosphere to space by radiation. All quantities are measured in terms of energy per unit area per unit time (W/m2).

Figure 1. Model of the energy balance of the atmosphere. The heat received by the atmosphere ( R+M+S1 ) equals the heat lost to space (Q1). In this single layer atmospheric model, the absorbing and emitting layers are one and the same.

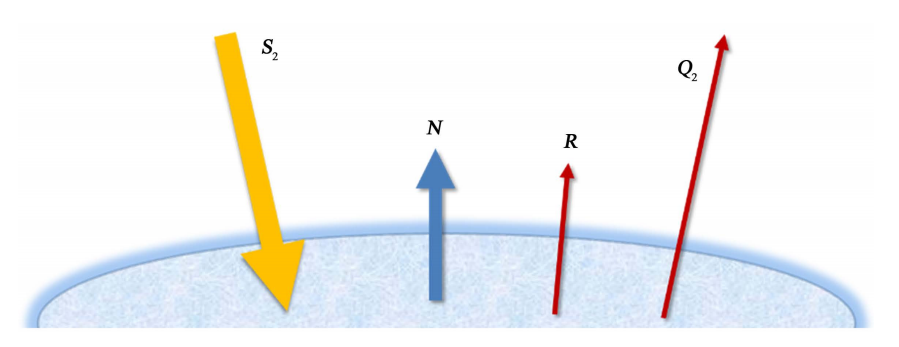
Part 2: Thermal Equilibrium of the Ground

In the second part of his model, Arrhenius describes the heat flow equilibrium at the “ground” or surface of the Earth. There are four contributions to the surface heat flow as shown in Figure 2. S2 is the solar energy absorbed by the surface, R is the infra-red radiation emitted from the surface and transferred to the atmosphere, N is the heat conveyed to the atmosphere by convection and Q2 is the heat radiated to space from the surface. Note: Here Arrhenius uses the term N for the convective heat flow. It is equivalent to the term M used in the air equilibrium model.

Figure 2. The energy balance at the surface of the Earth. The energy received by the ground is equal to the energy lost.

3. Finding the Temperature of the Earth

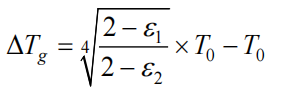
Arrhenius combined these equations and, by eliminating the temperature of the atmosphere which according to Arrhenius “has no considerable interest”, he arrived at the following relationship:

ΔTg  is the expected change in the temperature of the Earth for a change in atmospheric emissivity from ε1 to ε2. Arrhenius determined that the current transparency of the atmosphere was 0.31 and, therefore the emissivity/absorptivity ε1 = 0.69. The current mean temperature for the surface of the Earth can be assumed to be To = 288 K.

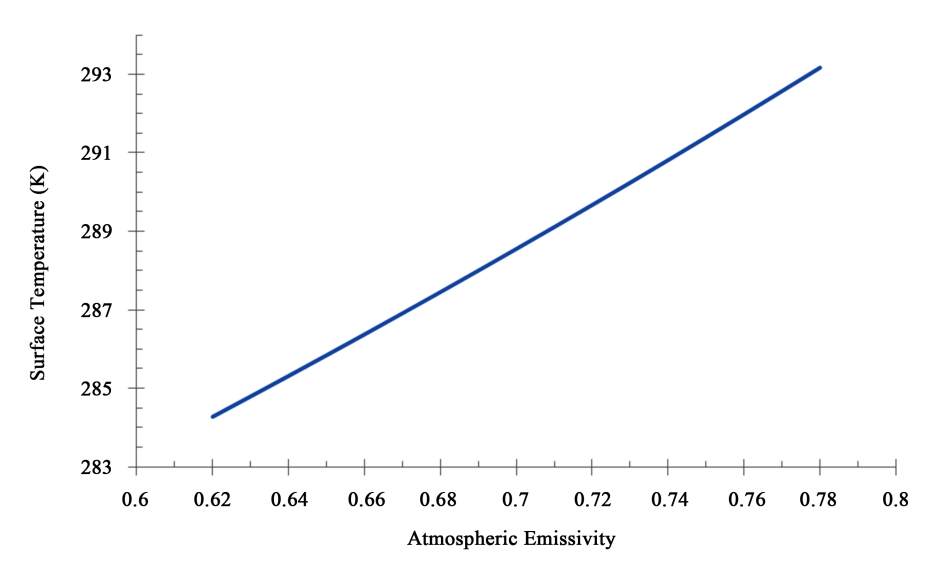
Figure 3. Arrhenius’ model is used to determine the mean surface temperature of the Earth as a function of atmospheric emissivity ε. For initial conditions, ε = 0.69 and the surface temperature is 288 K. An increase in atmospheric emissivity produces an increase in the surface temperature of the Earth.

Arrhenius estimated that a doubling of carbon dioxide concentration in the atmosphere would produce a change in emissivity from 0.69 to 0.78 raising the temperature of the surface by approximately 6 K. This value would be considered high by modern climate researchers; however, Arrhenius’ model has become the foundation of the greenhouse-global warming theory today. Arrhenius made no attempt to quantify the specific heat flow values in his model. At the time of his paper there was little quantitative data available relating to heat flow for the Earth.

4. Evaluation of Arrhenius’ Model under Present Conditions

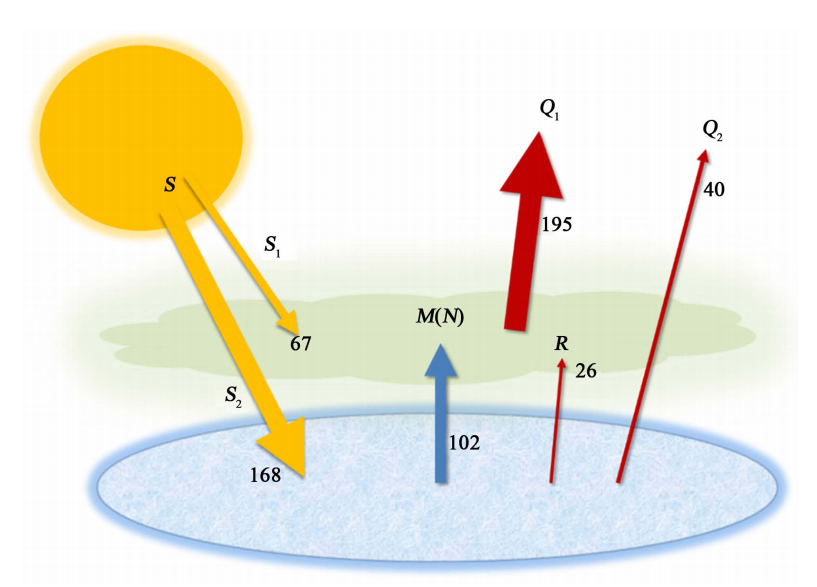
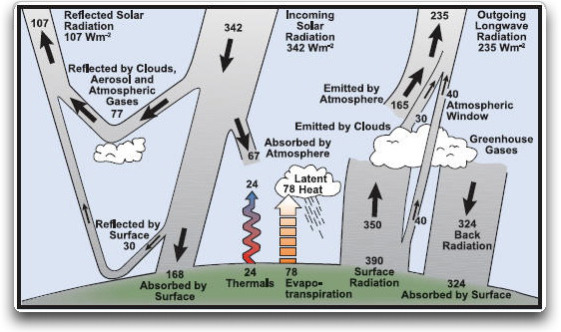
More recently, Kiehl and Trenberth (K & T) [ 3 ] and others have quantified the heat flow values used in Arrhenius’ model. K & T’s data are summarised in Figure 4.

The reflected solar radiation, which plays no part in the energy balance described in this model, is ignored. R is the net radiative transfer from the ground to the atmosphere derived from K & T’s diagram. The majority of the heat radiated to space originates from the atmosphere (Q1 > Q2). And the majority of the heat lost from the ground is by means of convection to the atmosphere (M > R + Q2).

Figure 4. Model of the mean energy budget of the earth as determined by Kiehl and Trenberth.

Equation (5)    Q2=(1−ε)σνT4e(5)

Substituting ε = 0.567, ν = 1.0 and Tg = 288 K we get:  Q2=149.2 W/m2

Using Arrhenius value of 0.69 for the atmospheric emissivity Q2 = 120.9 W/m2.

Both values are significantly more than the 40 W/m2 determined by K & T.
The equation will not balance, something is clearly wrong.

Figure 5 illustrates the problem.

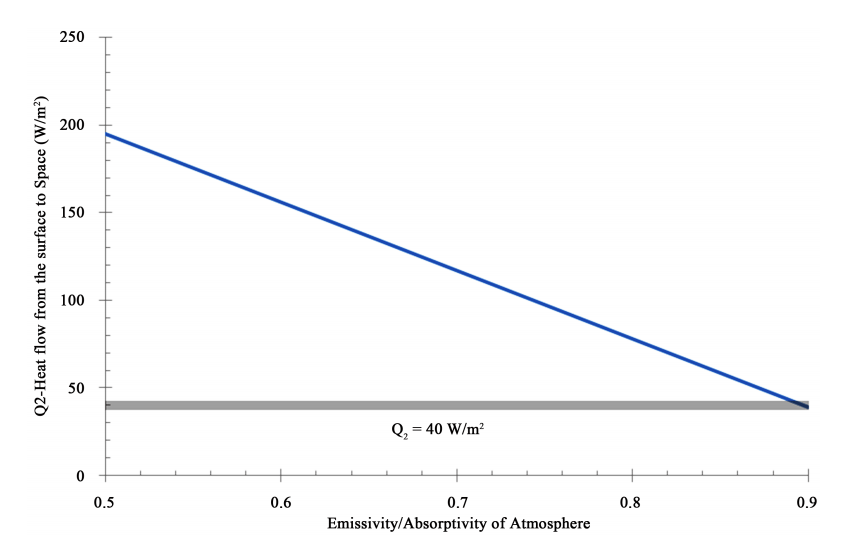
Equation (5) is based on the Stefan-Boltzmann law which is an empirical relationship which describes the amount of radiation from a hot surface passing through a vacuum to a region of space at a temperature of absolute zero. This is clearly not the case for radiation passing through the Earth’s atmosphere and as a result the amount of heat lost by radiation has been grossly overestimated.

No amount of adjusting parameters will allow this relationship to produce
sensible quantities and the required net heat flow of 40 W/m2.

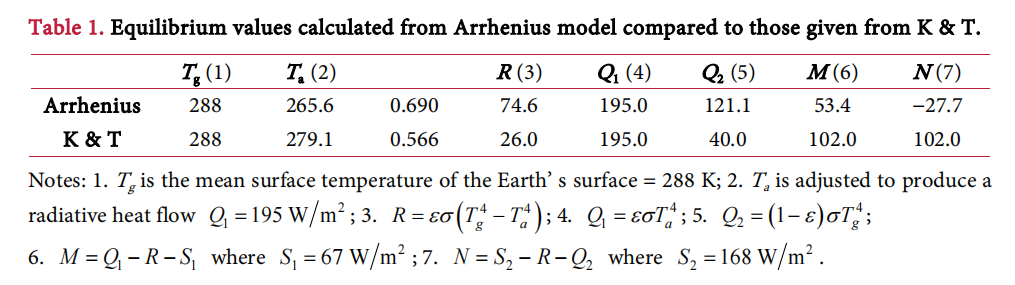
This error affects the equilibrium heat flow values in Arrhenius’ model and the model is not able to produce a reasonable approximation of present day conditions as shown in Table 1. In particular, the convective heat flow takes on very different values from the two parts of the model. The values M and N in the table should be equivalent.

5. A New Energy Equilibrium Model

A modified model is proposed which will determine the change in surface temperature of the Earth caused by a change in the emissivity of the atmosphere (as would occur when greenhouse gas concentrations change). The model incorporates the following ideas:

1) The total heat radiated from the Earth ( Q1+Q2Q1+Q2 ) will remain constant and equal to the total solar radiation absorbed by the Earth ( S1+S2S1+S2 ).

2) Convective heat flow M remains constant. Convective heat flow between two regions is dependent on their temperature difference, as expressed by Newton’s Law of cooling1. The temperature difference between the atmosphere and the ground is maintained at 8.9 K (see Equation 7(a)). M = 102 W/m2 (K & T).

3) A surface temperature of 288 K and an atmospheric emissivity of 0.567 (Equation (7b)) is assumed for initial or present conditions.

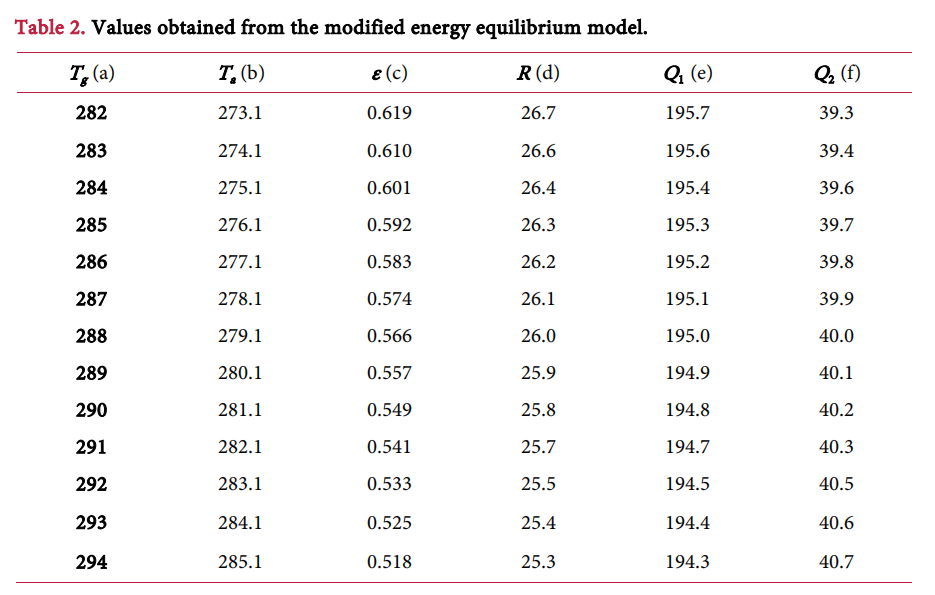
Equation (9) represents the new model relating the emissivity of the atmosphere ε to the surface temperature Tg. Results from this model are shown in Table 2. The table shows the individual heat flow quantities and the temperature of the surface of the Earth that is required to maintain equilibrium:

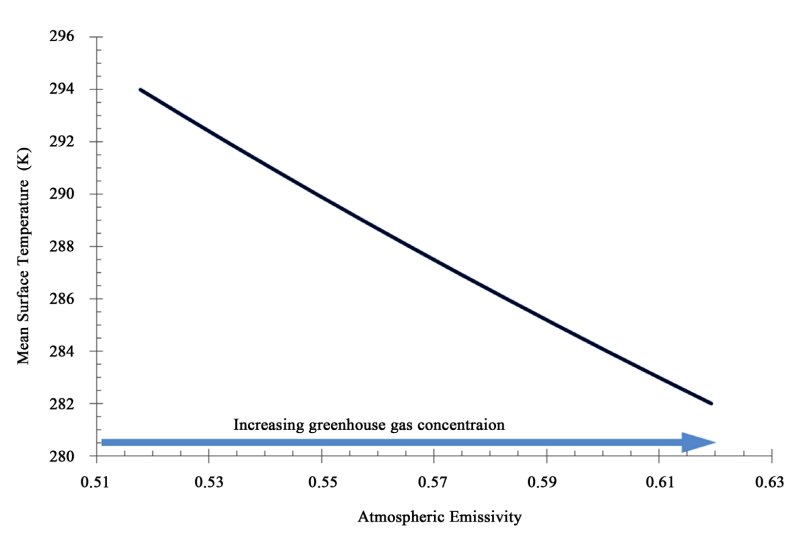
The table shows that as the value of the atmospheric emissivity ε is increased less heat flows from the Earth’s surface to space, Q2 decreases. This is what would be expected. As well, more heat is radiated to space from the atmosphere; Q1 increases. This is also expected. The total energy radiated to space Q1+Q2=235 W/m2 . A plot of the resultant surface temperature Tg versus the atmospheric emissivity ε is shown below Figure 6.

Figure 6. Plot of the Earth’s mean surface temperature as a function of the atmospheric emissivity. This model predicts that the temperature of the Earth will decrease as the emissivity of the atmosphere increases.

6. Conclusion

Arrhenius identified the fact that the emissivity/absorptivity of the atmosphere increased with increasing greenhouse gas concentrations and this would affect the temperature of the Earth. He understood that infra-red active gases in the atmosphere contribute both to the absorption of radiation from the Earth’s surface and to the emission of radiation to space from the atmosphere. These were competing processes; one trapped heat, warming the Earth; the other released heat, cooling the Earth. He derived a relationship between the surface temperature and the emissivity of the atmosphere and deduced that an increase in emissivity led to an increase in the surface temperature of the Earth.

However, his model is unable to produce sensible results for the heat flow quantities as determined by K & T and others. In particular, his model and all similar recent models, grossly exaggerate the quantity of radiative heat flow from the Earth’s surface to space. A new energy equilibrium model has been proposed which is consistent with the measured heat flow quantities and maintains thermal equilibrium. This model predicts the changes in the heat flow quantities in response to changes in atmospheric emissivity and reveals that Arrhenius’ prediction is reversed. Increasing atmospheric emissivity due to increased greenhouse gas concentrations will have a net cooling effect.

It is therefore proposed by the author that any attempt to curtail emissions of CO2
will have no effect in curbing global warming.

Summary:

If Stannard is right, then the unthinkable, inconvenient truth is:  More CO2 cools, rather than warms the planet.  As noted before, we have enjoyed a modern warming period with the recovery of temperatures ending the Little Ice Age.  But cold is the greater threat to human life and prosperity, and as well to the biosphere.  Society’s priorities should be to ensure reliable affordable energy, and robust infrastructure to meet the demands of future cooling, which will eventually bring down CO2 concentrations in its wake.

Footnote: 

A comment below refers to the cartoon image at the top which was an older version of K & T.  The more recent version was used by the author and has slightly different numbers.  Below is the actual model he analyzed:

I agree that these energy budgets oversimplify the real world, and the author’s intention is not to correct the details, but to show that the models fail when taken at face value. He is focusing on the imbalance arising from applying Stefan-Boltzmann law to an atmospheric planet.  As noted below there are other challenging issues such as using the average frequency of visual light for calculating W/m^2, which is not realistic for earth’s LW radiation.

2023 April Arctic Ice Melt Abates

The graph shows that coming out of the annual March maximum, April 2023 began 238k km2 lower than the 17 year average.  SII even showed extents ~200k km2 lower than MASIE on April 1.  However, after two weeks both indices tracked with the average until month end.  According to MASIE, the typical April loses 1100 km2, but this year lost only 918k km2.  SII shows a loss of only 590k km2 during April. Meanwhile, other years, especially 2007 were losing ice much more rapidly than average.  

Why is this important?  All the claims of global climate emergency depend on dangerously higher temperatures, lower sea ice, and rising sea levels.  The lack of additional warming is documented in a post Satellite Temps Hit Bottom: February 2023.

The lack of acceleration in sea levels along coastlines has been discussed also.  See USCS Warnings of Coastal Floodings

Also, a longer term perspective is informative:

post-glacial_sea_level
The table below shows the distribution of Sea Ice across the Arctic Regions, on average, this year and 2007.

Region 2023120 Day 120 Average 2023-Ave. 2007120 2023-2007
 (0) Northern_Hemisphere 13446987 13514506  -67519  13108068 338919 
 (1) Beaufort_Sea 1070966 1067918  3048  1059189 11777 
 (2) Chukchi_Sea 966006 956111  9895  949246 16760 
 (3) East_Siberian_Sea 1087137 1085582  1555  1080176 6961 
 (4) Laptev_Sea 897845 890425  7420  875661 22184 
 (5) Kara_Sea 933170 912998  20172  864664 68506 
 (6) Barents_Sea 415992 553986  -137994  396544 19449 
 (7) Greenland_Sea 761413 648178  113235  644438 116975 
 (8) Baffin_Bay_Gulf_of_St._Lawrence 1123308 1207572  -84264  1147115 -23807 
 (9) Canadian_Archipelago 854843 848924  5918  838032 16810 
 (10) Hudson_Bay 1249469 1238384  11085  1222074 27396 
 (11) Central_Arctic 3239670 3230693  8977  3241034 -1364 
 (12) Bering_Sea 491550 473366  18184  475489 16061 
 (13) Baltic_Sea 32086 20744  11342  14684 17402 
(14) Sea_of_Okhotsk 321714 376553  -54840  295743 25971 

Overall, the extent is slightly below average by 68k km2, or 0.5%.  The main deficits are in Barents, Baffin and Okhotsk, partly offset by a surplus in Greenland Sea.