Glenn Spitzer turns the table on alarmists in his American Thinker article Who Are the Real Climate Change Deniers? Excerpts in italics with my bolds and added images.
Who are these “climate change deniers” we hear so much about? Does anyone really doubt the climate changes? Well, yes. There are climate change deniers — a lot of them. They live right under our noses, and they are celebrated. Here’s a quote from one of the most famous climate change deniers:
Our civilization has never experienced any environmental shift remotely similar to this. Today’s climate pattern has existed throughout the entire history of human civilization.
That was Al Gore in 2007. According to Gore, the climate was “shiftless” for thousands of years — a paradigm of stability.
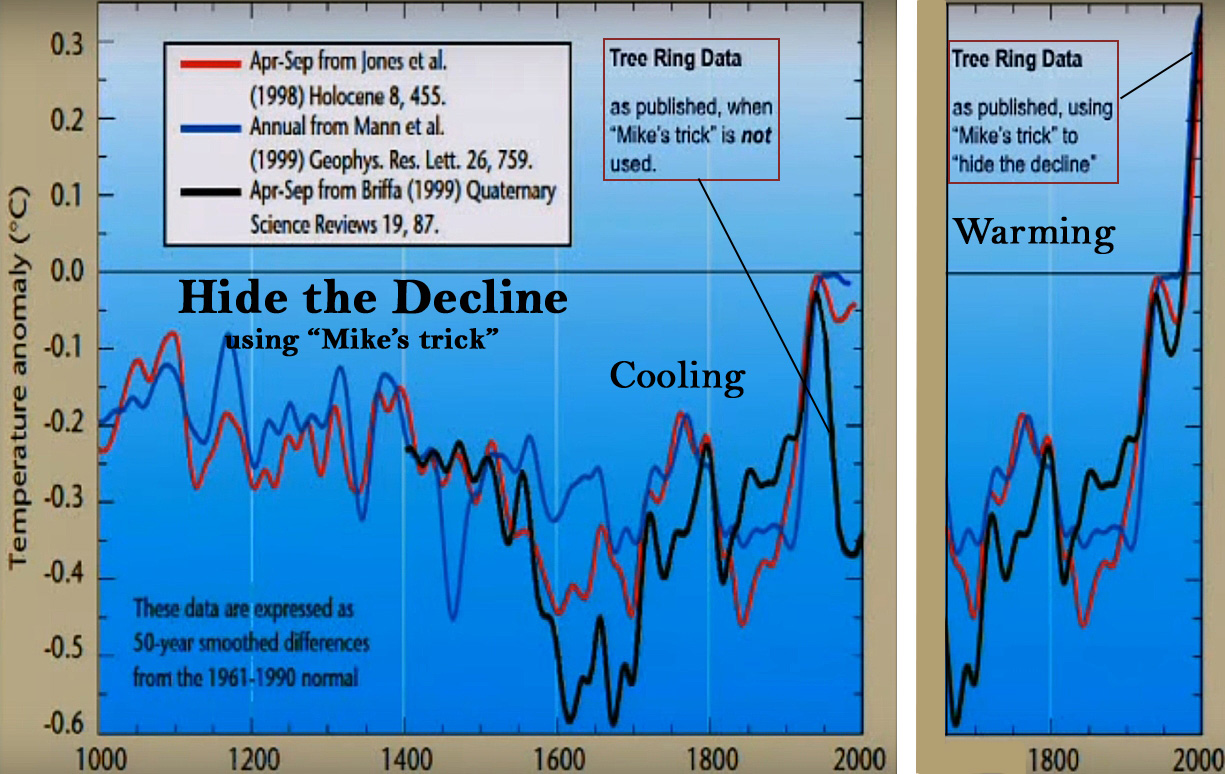
Gore’s quote was a restatement of Michael Mann’s 1998 “hockey stick.” Mann argued that the Earth’s climate held steady for all of human history (the hockey stick handle), until suddenly, in the 1900s, the temperatures increased, representing the upturned blade of the hockey stick.
Mann’s theory is the basis of the modern CO2-focused “global warming” movement, which ironically morphed into the “climate change” movement. Mann’s theory informs the positions taken by the Intergovernmental Panel on Climate Change (IPCC), the agency dictating policy to your local, state, and federal governments.
The most important assumption in Mann’s theory is that there was no climate change prior to the 20th century. But this assumption is false. It is climate change denial; it is the sacrifice of truth for a desired outcome.
The first graph appeared in the IPCC 1990 First Assessment Report (FAR) credited to H.H.Lamb, first director of CRU-UEA. The second graph was featured in 2001 IPCC Third Assessment Report (TAR) the famous hockey stick credited to M. Mann.
Mann’s 1998 study intentionally ignored several thousand scientific publications showing other periods of climate change throughout human history, such as the Medieval Warm Period (about A.D. 900 to 1300), the Little Ice Age (about 1300 to 1915), and the Roman Warm Period (about A.D. 1 to 500). Despite claims of perpetual stability, it turns out the climate is always changing.
Scientists estimate that, during the Medieval Warm Period, for example, the temperatures in parts of Europe were 1.0–1.4° Celsius (1.8–2.5° Fahrenheit) warmer than they are now. Oxygen isotope studies in China, Germany, Greenland, Ireland, New Zealand, Switzerland, and Tibet, as well as tree ring data from many sites throughout the world, confirm the Medieval Warm Period. The studies are so numerous (several thousand published papers confirming this warming) that it raises the obvious question: “Why do climate activists deny that the climate is always changing?”
There are two important reasons why activists deny climate change. First, the acceptance of prior warming periods undermines the argument that a modern warming is an existential threat, and second, prior warming periods undermine the idea that anthropogenic (man-made) CO2 is the primary cause of climate change.
The Medieval Warm Period is a particularly inconvenient truth for the modern climate activists because it shows that warming has beneficial effects on humanity. As the European region became warmer, agriculture spread and generated food surpluses. The European population doubled. In short, the Medieval Warm Period underscores the reality that, while humans struggle in colder weather, we generally thrive in warmer weather.
In other words: no crisis justifying extraordinary intervention.
But more importantly, what does a constantly changing climate say about the effects of anthropogenic CO2?
The fact that the climate has been changing significantly for thousands of years (actually millions) raises the question: what causes climate change? This is a messy question. Activists seek to foreclose options by addressing causation through simple correlation. If climate change is only a recent phenomenon, one that began coincidentally with the rise in anthropogenic CO2, then causation is simple.
However, if this fact pattern is a fiction, then the correlation argument falls apart. When we understand the climate is always changing, and was changing well before the rise of anthropogenic CO2, then we are confronted with the reality that other factors are at play. Anthropogenic CO2 is placed in proper context as a potential factor of uncertain significance. Importantly, when simple correlation no longer drives our analysis, we are freed to assess other causal factors more seriously.
When people acknowledge that anthropogenic CO2 could not possibly cause climate change throughout human history, they are forced to question their religion. When guided by truth instead of ideology, the following questions become more interesting:
How is it that the last six great ice ages started with far more CO2 in the atmosphere than we have now?
Figure 16. The geological history of CO2 level and temperature proxy for the past 400 million years. CO2 levels now are ~ 400ppm
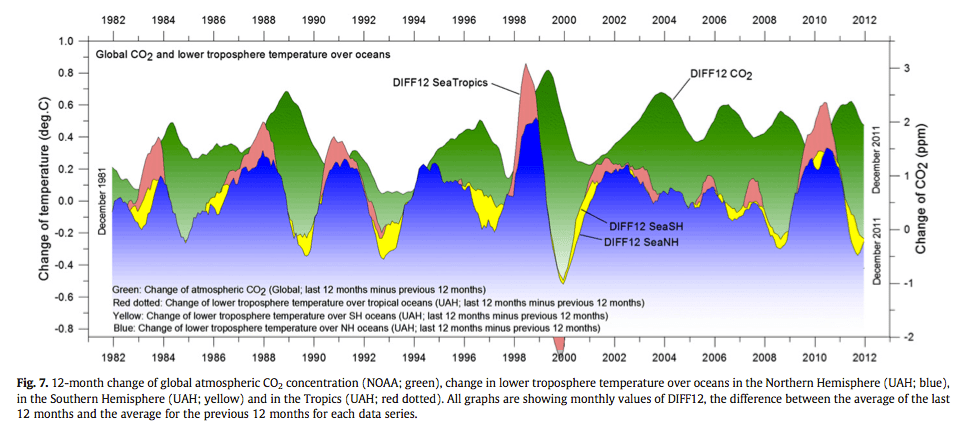
Is it true, as many experts note, that temperatures drive CO2 levels, and not the other way around?
Highlights ► Changes in global atmospheric CO2 are lagging 11–12 months behind changes in global sea surface temperature. ► Changes in global atmospheric CO2 are lagging 9.5–10 months behind changes in global air surface temperature. ► Changes in global atmospheric CO2 are lagging about 9 months behind changes in global lower troposphere temperature. ► Changes in ocean temperatures explain a substantial part of the observed changes in atmospheric CO2 since January 1980. ► Changes in atmospheric CO2 are not tracking changes in human emissions.
How does anthropogenic CO2 drive climate when it makes up less than 5% of total CO2 (with most coming from the oceans, volcanoes, decaying vegetation, and forest fires)?
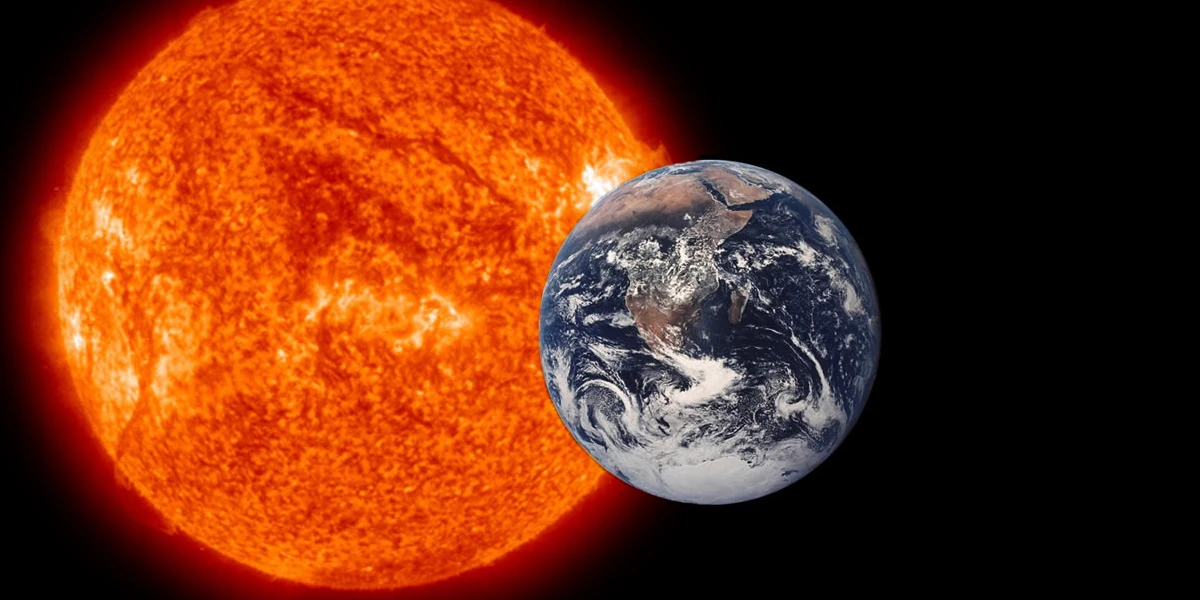
Isn’t the sun the most important cause of climate, and what effects follow from sun spots and solar flares?
If greenhouse gases (GHGs) are the most significant drivers of climate change, then why do we focus on CO2, when water vapor (i.e., clouds) is a far more impactful GHG? (In fact, there have been a flurry of recent published studies on the effects of clouds.)
For many in science, self-preservation and status remain subordinate to truth and courage. Many have sacrificed research funding and reputation to criticize Mann’s theories, including IPCC lead authors John Christy (former NASA climatologist) and Richard Lindzen (former MIT professor). In fact, numerous climate experts upended their professional lives by pointing out that Mann’s theory is more activism than fact (including Professors Tim Ball, Ian Clark, Ian Plimer, NirShaviv, Piers Corbyn, Steven Koonin, Judith Curry, and William Happer — to name a few).
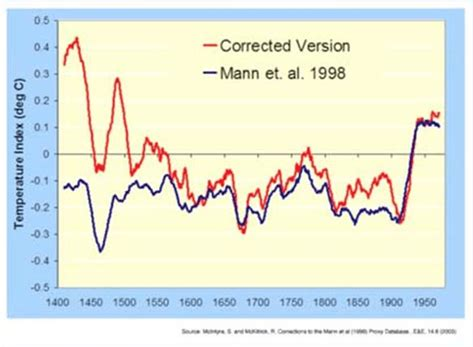
Experts Steve McIntyre and Ross McKitrick presented a detailed analysis of the flaws of Mann’s 1998 theory in a series of studies in 2003 and 2005, detailing the numerous technical flaws with Mann’s analysis. They found that Mann’s theory was invalid “due to collation errors, unjustifiable truncation or extrapolation of source data, obsolete data, geographical location errors, incorrect calculation of principal components and other quality control defects.”
Hockey stick graph corrected by McKitrick and McIntyre after removing Mann’s errors.
In a 2014 paper, McKitrick summarized the theory’s most significant problem as an issue of unreliable proxy data. Namely, Mann relied on a small and controversial subset of tree ring records of bristlecone pine cores from high and arid mountains in the U.S. Southwest. The scientists who published the tree ring data on which Mann relied (published by Graybill and Idso in 1993) specifically warned that the data should not be used for temperature reconstruction and that the 20th-century data had regional anomalies.
The overarching takeaway here is that we cannot cede the power of thought to the “experts.” Experts serve an important role in that they assist us in analyzing matters beyond our common understanding. But experts are mere fallible humans. When they are controlled by their biases, flawed in their analysis, or misguided by incorrect data, then we must reject their conclusions.
Today, the collapse of FTX and the recent criminal conviction of founder and CEO Sam Bankman-Fried (who is facing a lifetime behind bars) brings Enron, Skilling, and Lay to mind. But, despite the magnitude of SBF’s fraud, it pales in comparison to the ongoing fraud being perpetrated mostly on America and its Western allies in the name of “climate change.”
A bit like FTX, but unlike Enron, there are plenty of warning signs that the “Green Revolution” is about to come tumbling down and its loudest advocates brought to account. The main thing keeping the mirages afloat today is the massive egos and their investments in folly that may leave them going down with the ship.
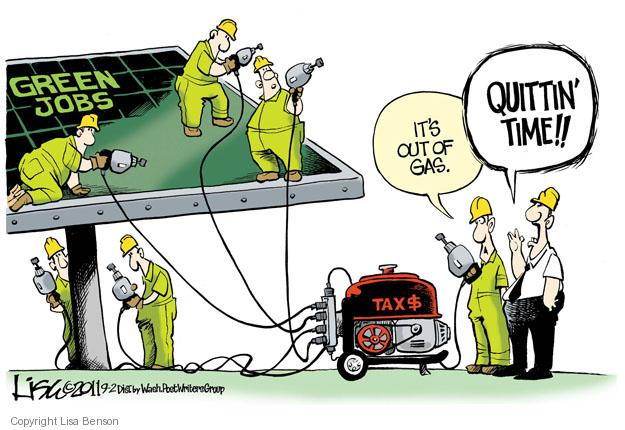
While the “Green Revolution” has been under way for decades, it is the Biden Administration that has imposed mandates, attacked popular energy sources and transportation options, and waged war against traditional industrial development. Europeans and states like California had earlier imposed their own mandates with supposedly “hard” deadlines for abolishing the use of oil, natural gas, coal, and every tool or vehicle that uses them.
The green war on fossil fuels, as fleshed out in the “Net Zero” campaign,
is perhaps history’s greatest example of philosophical fraud.
And the corollary: Reality is also that which happens instead of what you wanted and expected.
“To dream the impossible dream” and turn it into reality would mean sacrificing an estimated 6,000 useful products that rely on byproducts from crude oil refineries – products that range from asphalt for highways to fertilizers, cosmetics, synthetic rubber, medicines and medical devices, cleaning products, plastics, so many more. The 3 billion who live without the benefits fossil fuels have provided are also the poorest, sickest, and most vulnerable humans on the planet.
Cracks are already developing in the “Net Zero” world, what with countries backing away from the mandates they so recently touted while marching around like peacocks in mating season. In March the European Union reached an agreement with Germany to formally back away from its total ban on internal combustion engines in 2035.
Still, 30 countries are signatories to the Glasgow Declaration that would force all vehicles sold by 2040 to have zero carbon dioxide emissions, and 21 others have crafted plans to ban new ICE vehicle sales earlier than 2040. Dozens of major cities and states, most notably California and the California clone states, intend to disallow new ICE vehicles by 2035.
Several problems stand in the way of their utopian dream. Even EV advocates are now admitting the “EV-olution” has to overcome “serious issues” – like the use of child labor in lithium mining, the woefully inadequate EV charging infrastructure, and an unprepared power grid. Yet the biggest obstacle is that a majority of the Earth’s people object to having EVs – or heat pumps, or electric stoves, and so on — shoved down their throats.
EVs may be fine for short-trip urban travel but not for construction equipment, airplanes, or even urban buses, as evidenced by the recent horrific scene in San Francisco when a Google-operated electric bus lost power and slid backwards downhill into nine vehicles. Today’s EVs are wholly impractical for mountain and prairie residents or others making long trips (worse with children).
Like Ken Lay with Enron, the Green revolution has relied heavily on government subsidies and a “revolution always” business philosophy aimed at making pariahs of anyone who dares oppose the grandiose – but fatally flawed – plan.
During the Obama Administration, Solyndra went under despite a $535 million government-guaranteed loan, none of which was paid back. Forbes, citing OpenTheBooks.com, noted that taxpayers were left holding the notes for $400 million given to Abound Solar, $280 million wasted by CaliSolar, $193 million doled out to Fisker Automotive (with another $336 million canceled), and $132 million to A123 Systems (a failed battery maker).
Undaunted, the Biden Administration’s $2.3 trillion “jobs” package was rife with more subsidies for technologies that by their own admission are unsustainable. Yet despite all the free money, Ford, General Motors, and many other automakers are backing away from multibillion-dollar investments in new EV factories as new EV sales have slowed despite increased rebates.
Ford in March projected a loss of $3 billion on electric vehicles in 2023, offsetting profits of as much as $14 billion from its other divisions. Ford also admitted losses of $900 million in 2021 and $2.1 billion in 2022 in its EV division. Ford and GM believe their EV fortunes will turn around by 2025, but those rosy scenarios seem wholly dependent upon Biden (or an even “greener” Democrat) winning the White House next November.
Even with a Green win in 2024, reality will still bite the EV dream. China has been quietly moving toward total dominance in the global EV marketplace – largely because it controls the lithium battery market. Financial Times wrote in September that China is so far ahead in the EV market that its competitors are trailing in the dust.
Biden’s reliance on huge subsidies to underwrite the “Green Revolution” has brought soaring inflation to the U.S. that is taking away purchasing power faster than it can increase subsidies and Mafia-style “incentives” (you will buy what we want you to buy, or else!).
Lay died of a heart attack shortly after his trial, leaving behind “a legacy of shame” characterized by “mismanagement and dishonesty” that led Politico to rank him as the third-worst American CEO of all time.
America’s doddering President Biden, now facing pre-impeachment hearings for other alleged mistakes, may not live to see his name smeared as Lay’s once was. But does anyone truly believe Biden is calling all the shots here?
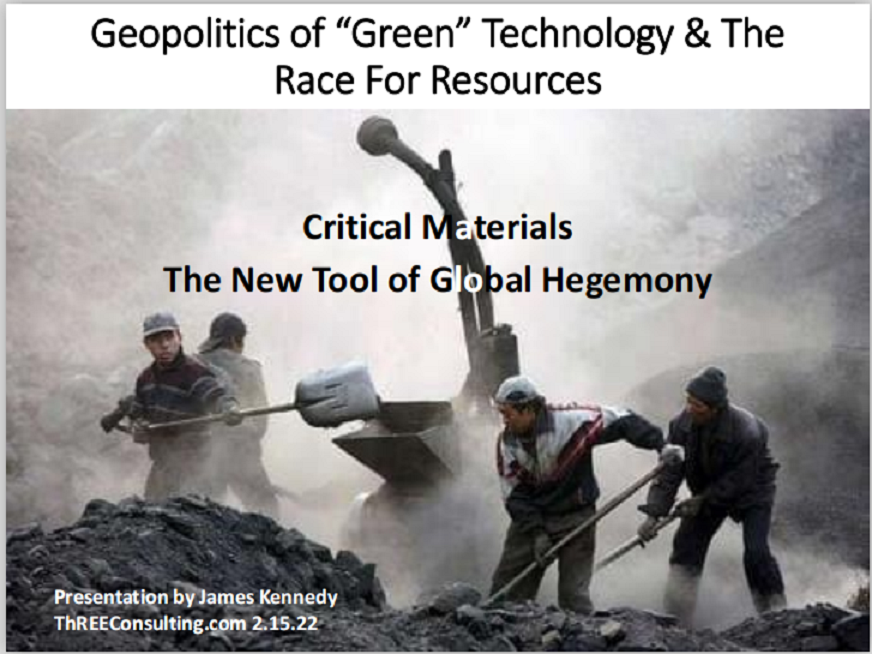
Who will, then, get the blame if America’s forced march to
EV subservience to Xi’s China brings an end to
America’s hegemony on the world stage?
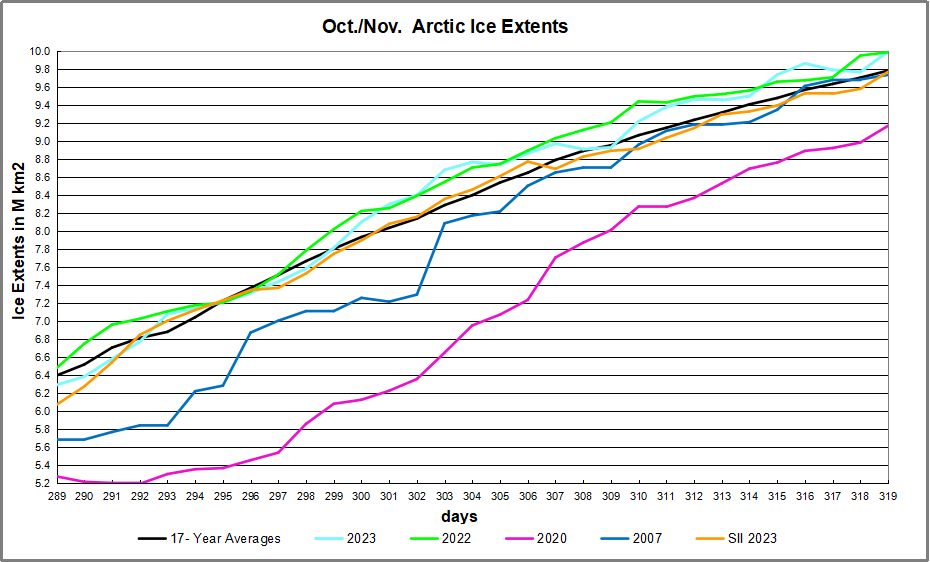
The animation shows the rapid growth of Arctic ice extent during November 2023, from day 304 to yesterday, day 319. For all of the fuss over the September minimum, little is said about Arctic ice growing back rapidly; that’s 4 Wadhams in October, plus another 1.3M in Nov to total 10M km2, or 10 Wadhams. The Russian side on the left froze over in October, and now at the center bottom you can see Beaufort sea and Canadian Archipelago icing up. Center right is Baffin Bay growing ice as well.
The graph below shows the last 30 days of 2023 compared to the 17 year average (2006 to 2022 inclusive), to SII (Sea Ice Index) and some notable years.
From Mid October to Mid November 2023, MASIE shows NH ice extent growing from 6.3 M km2 to 10M. That matches 2022 and exceeds the 17 year average by more than 200K km2. SII (Sea Ice Index) is only slightly lower.
The table below shows the distribution of ice in the Arctic Ocean basins.
Region
2023319
Day 319 Ave.
2023-Ave.
2007319
2023-2007
(0) Northern_Hemisphere
9997068
9784253
212815
9737614
259454
(1) Beaufort_Sea
1051194
1063450
-12257
1053727
-2533
(2) Chukchi_Sea
596947
629695
-32748
503783
93164
(3) East_Siberian_Sea
1064913
1075985
-11072
1043952
20960
(4) Laptev_Sea
897845
897217
628
897845
0
(5) Kara_Sea
696199
658489
37710
765376
-69177
(6) Barents_Sea
245998
154920
91078
145438
100560
(7) Greenland_Sea
613312
460620
152692
527575
85737
(8) Baffin_Bay_Gulf_of_St._Lawrence
536576
526706
9870
533931
2645
(9) Canadian_Archipelago
841536
850736
-9200
852539
-11003
(10) Hudson_Bay
161371
234076
-72704
231544
-70173
(11) Central_Arctic
3236821
3174741
62081
3156228
80594
Overall ice extent has 212k km2 above average or 2%. The only sizeable deficit is in Hudson Bay, more than offset by surpluses elsewhere, especiallly in Greenland and Barents seas, along with the Central Arctic.
Multi-institutional research team finds declining
nitrogen availability in a nitrogen-rich world.
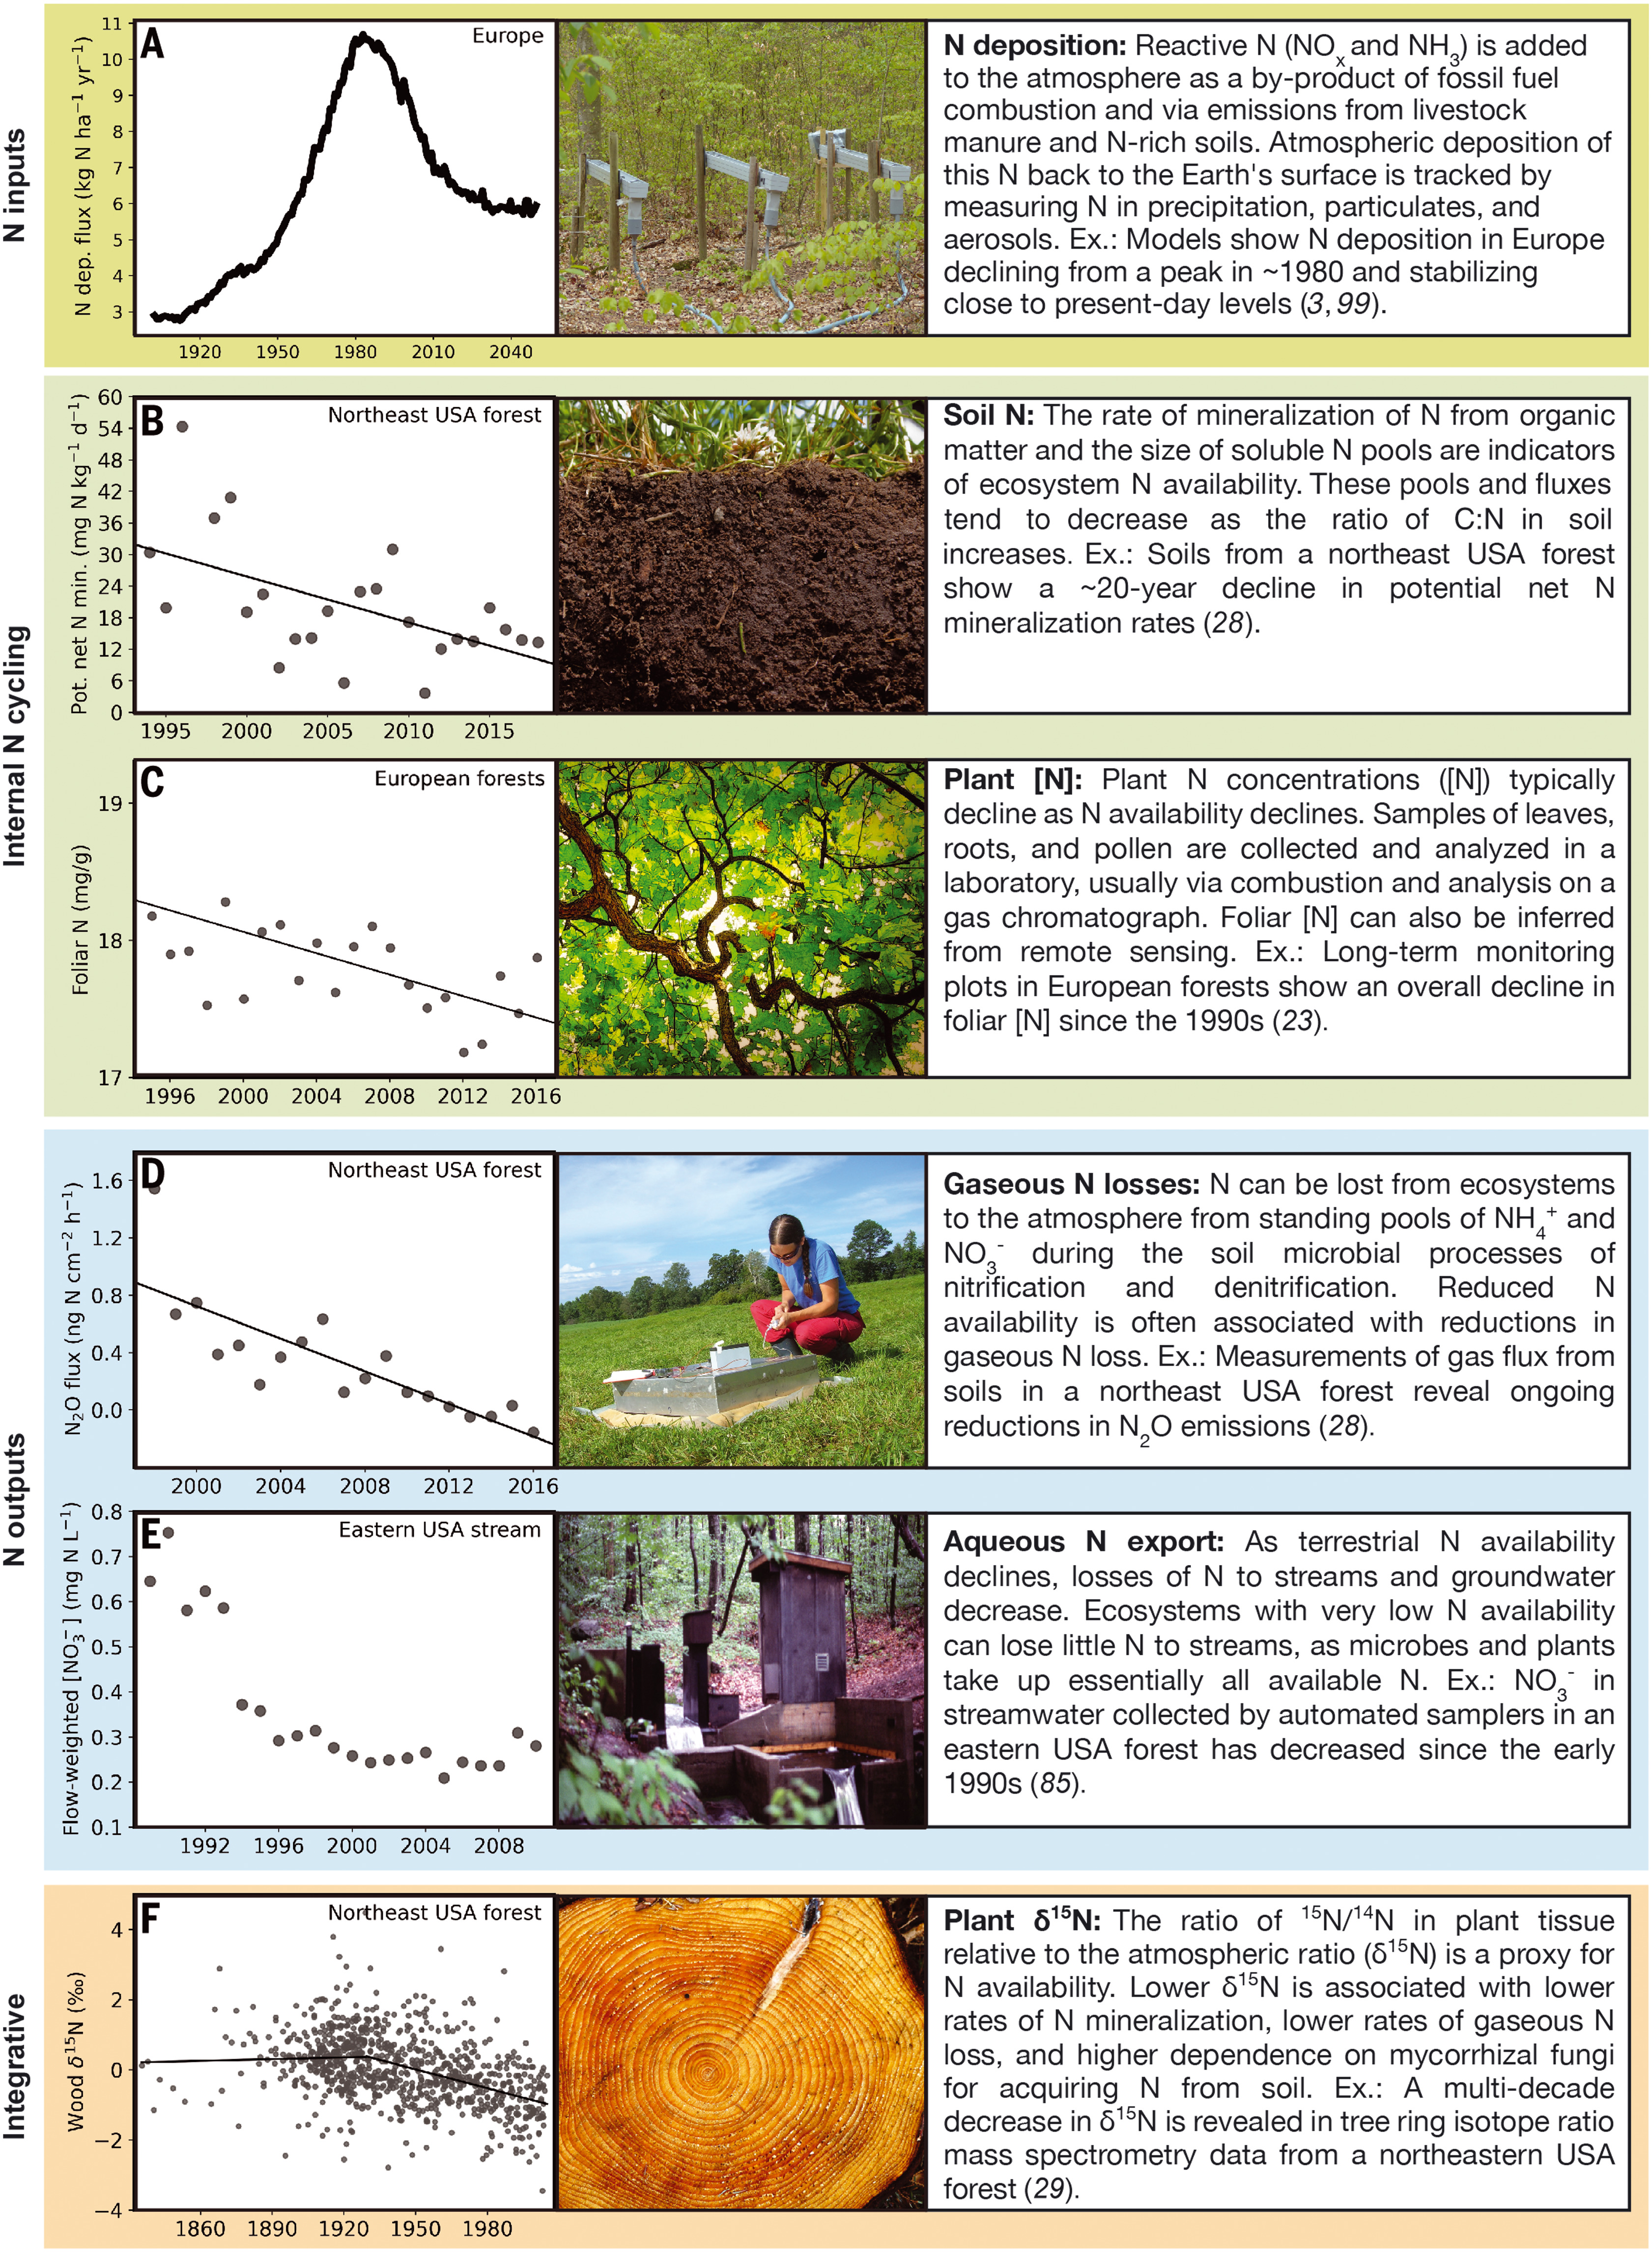
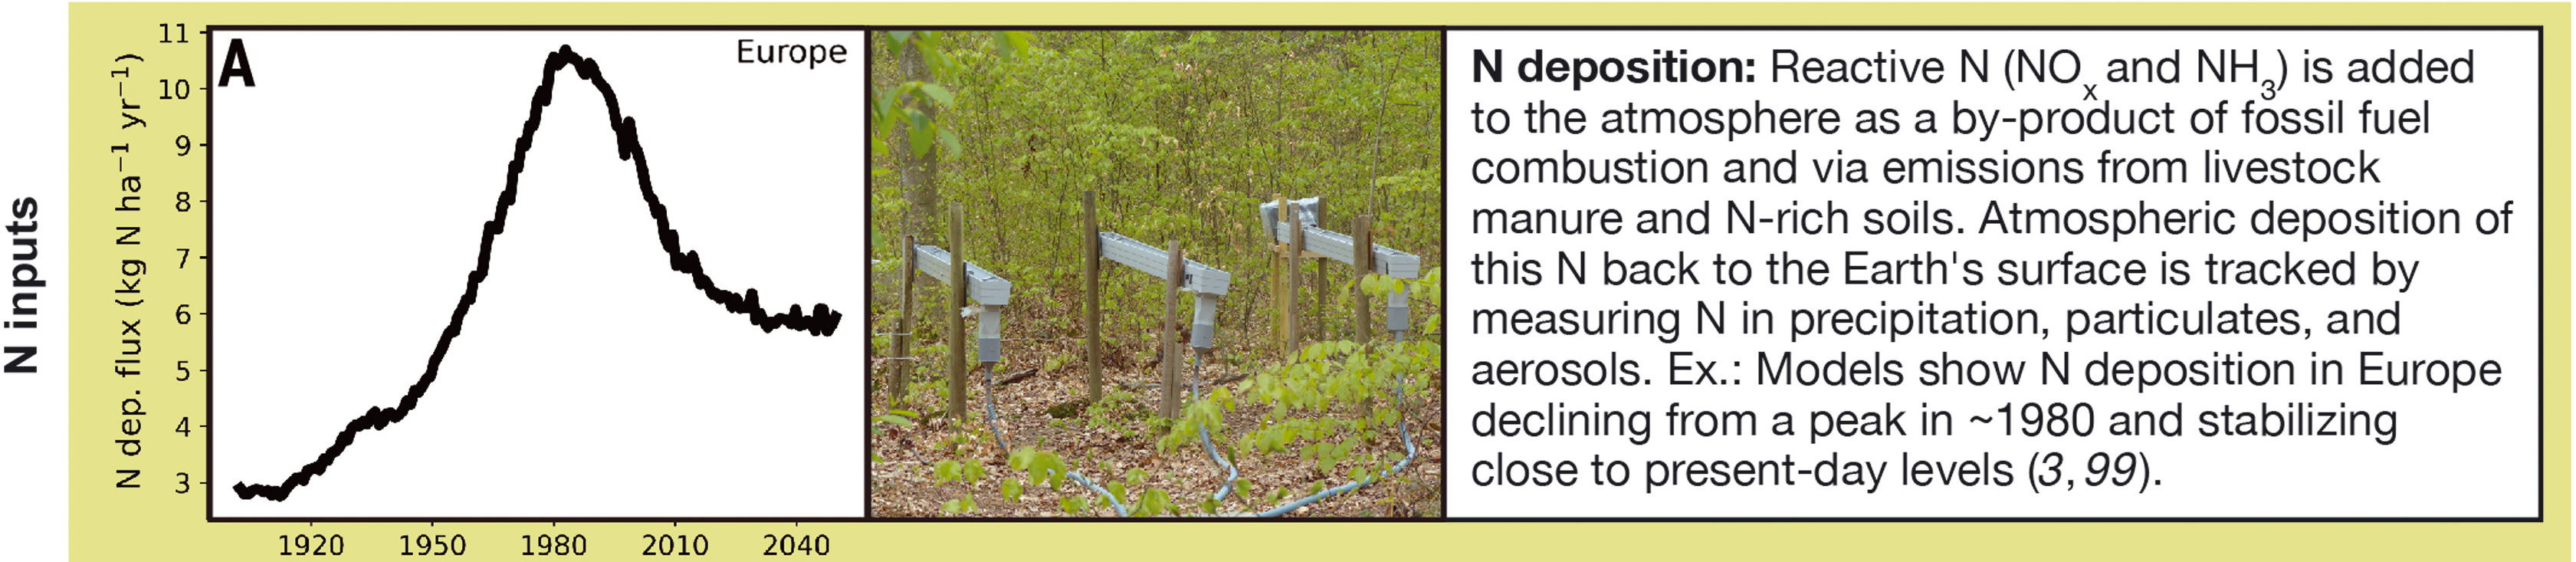
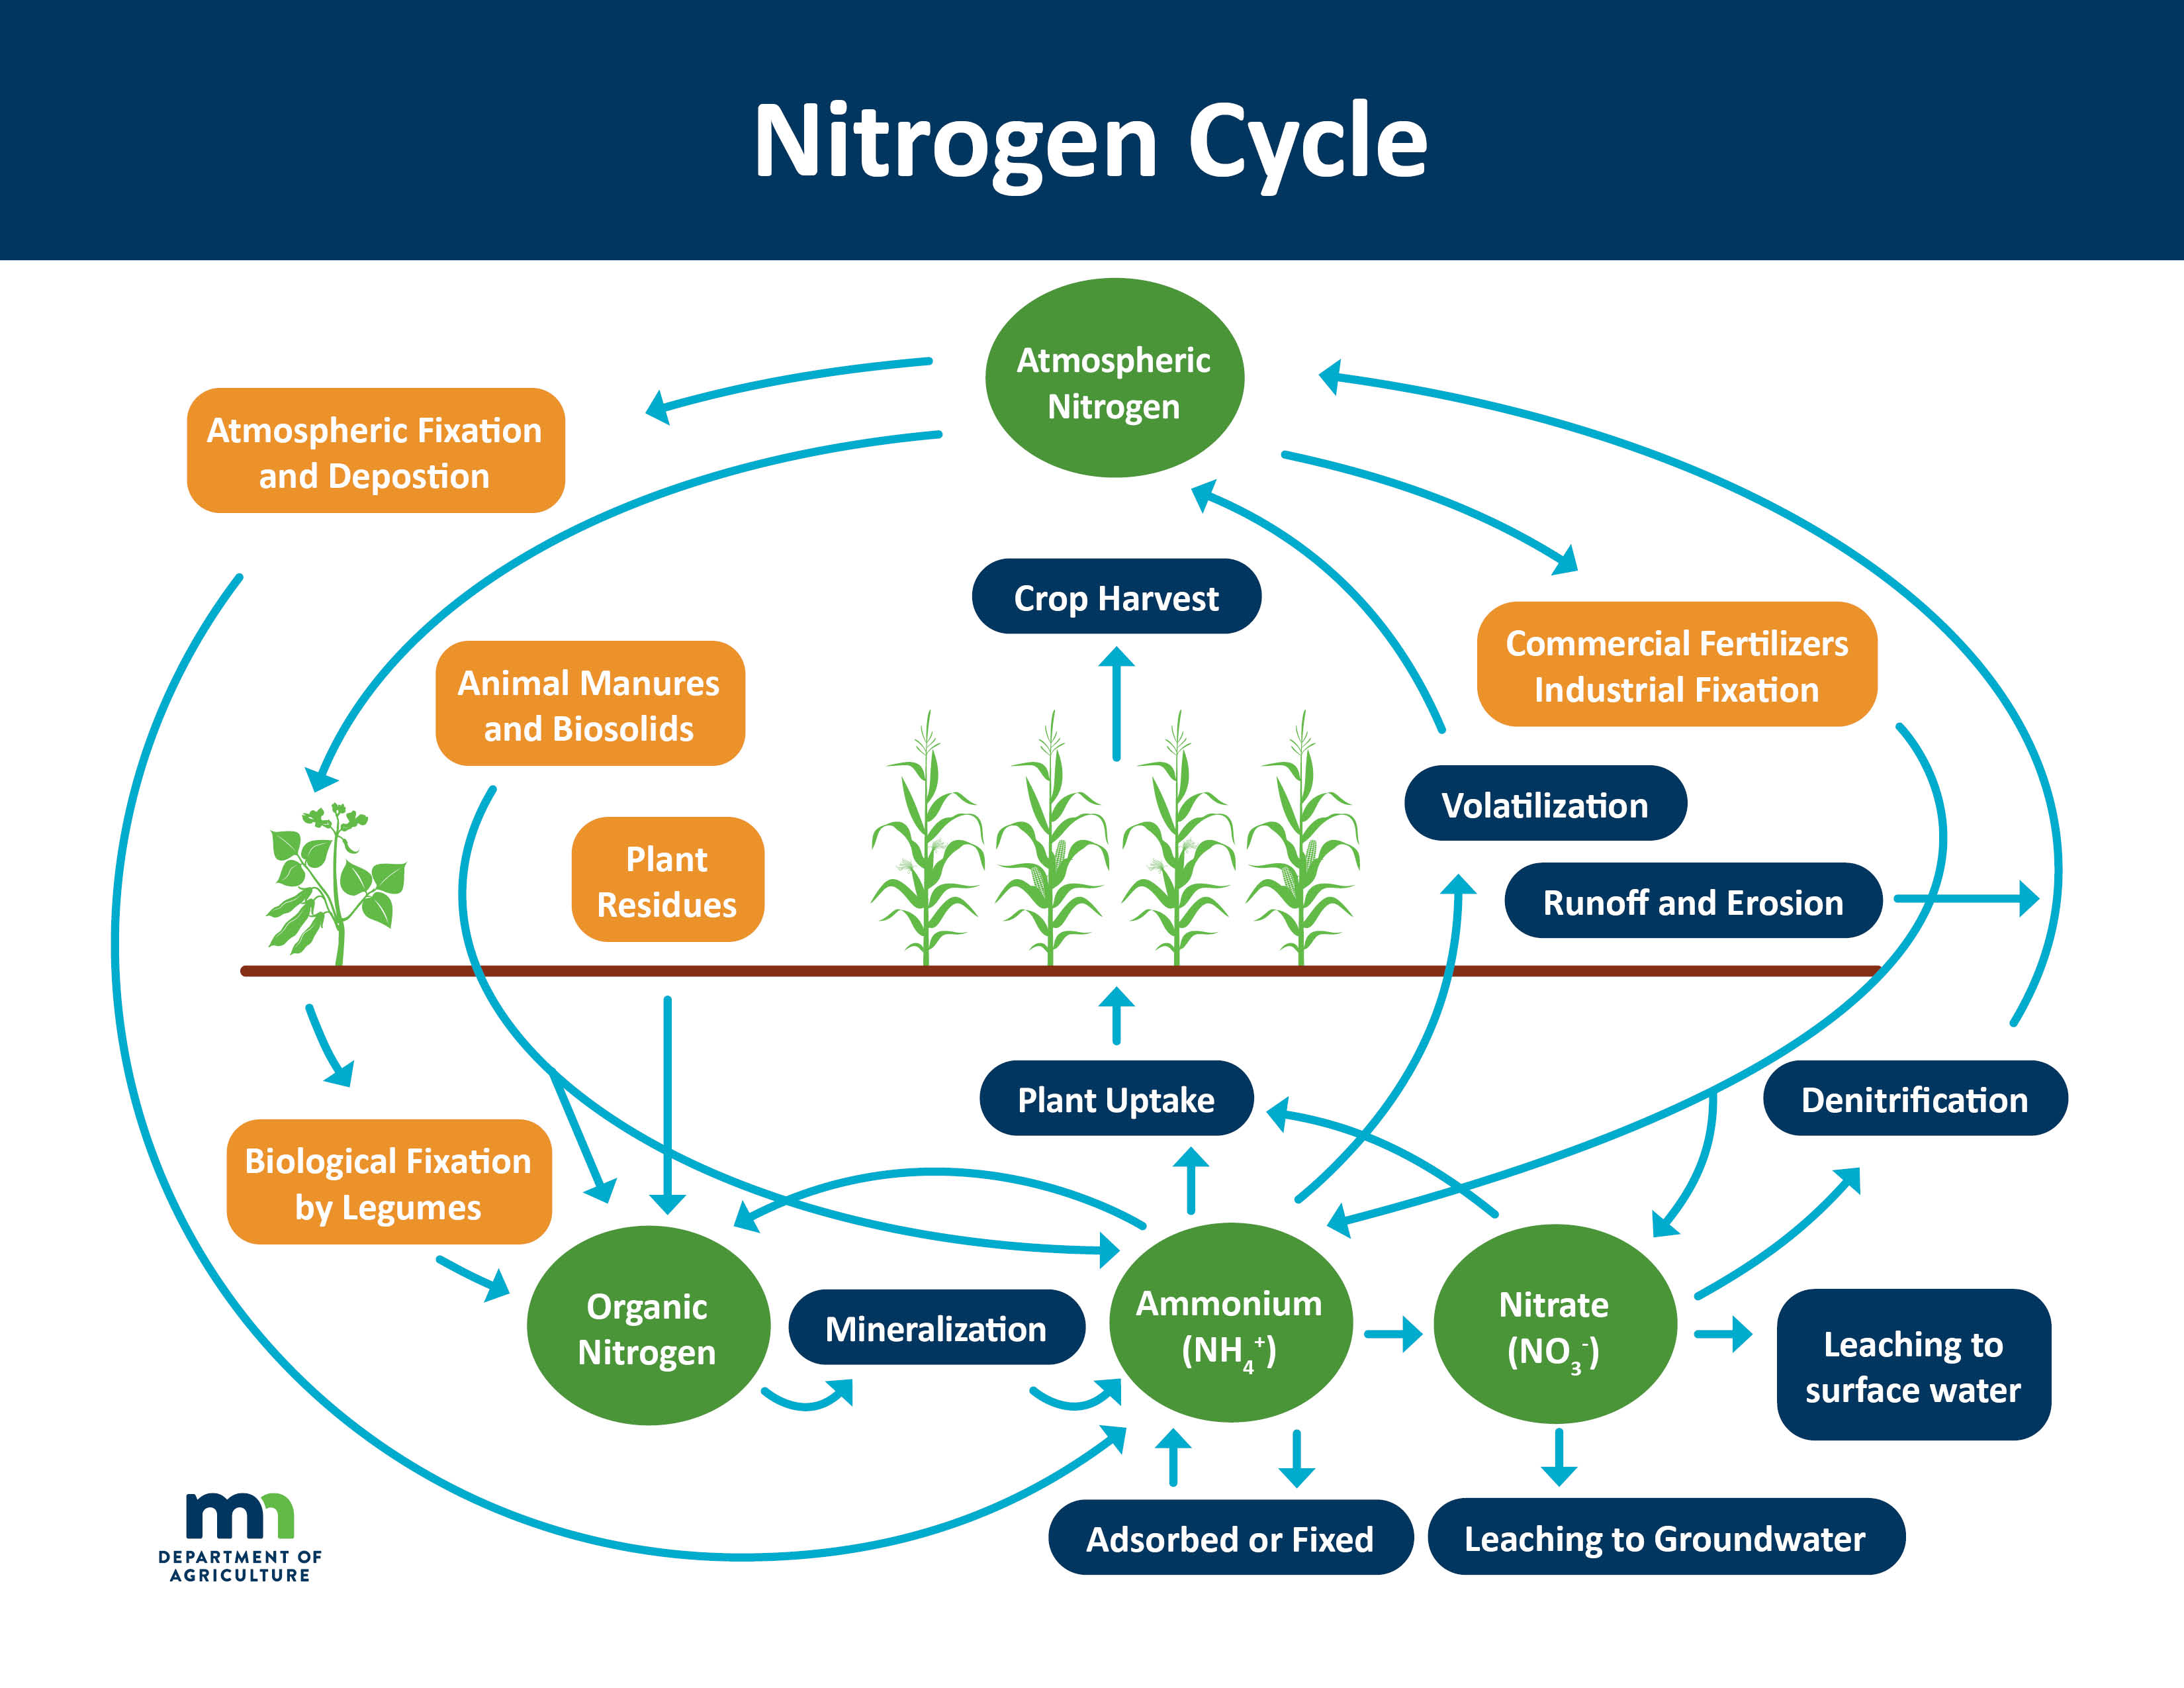
Since the mid-20th century, research and discussion have focused on the negative effects of excess nitrogen on terrestrial and aquatic ecosystems. However, new evidence indicates that the world is now experiencing a dual trajectory in nitrogen availability. Following years of attention to surplus nitrogen in the environment, our evolving understanding has led to new concerns about nitrogen insufficiency in areas of the world that do not receive significant inputs of nitrogen from human activities. In a new review paper, “Evidence, Causes, and Consequences of Declining Nitrogen Availability in Terrestrial Ecosystems,” in the journal Science, a multi-institutional team of researchers describes the causes of declining nitrogen availability and how it affects ecosystem function.
Over the last century, humans have more than doubled the global supply of reactive nitrogen through industrial and agricultural activities. This nitrogen becomes concentrated in streams, inland lakes, and coastal bodies of water, sometimes resulting in eutrophication, low-oxygen dead zones, and harmful algal blooms. These negative impacts of excess nitrogen have led scientists to study nitrogen as a pollutant.However, rising carbon dioxide and other global changes have increased demand for nitrogen by plants and microbes, and the research team’s newly published paper demonstrates that nitrogen availability is declining in many regions of the world, with important consequences for plant growth.
[Note the Nitrogen Deposition graph in the top diagram. It peaked in the 1980s, yet in 2023 it is being used to force farmers off their land in the Netherlands,Canada, Ireland and other nations to come]
Nitrogen is an essential element for plants and the animals that eat them. Gardens, forests, and fisheries are all more productive when they are fertilized with nitrogen. If plant nitrogen becomes less available, trees grow more slowly and their leaves are less nutritious to insects, potentially reducing growth and reproduction, not only of insects, but also the birds and bats that feed on them.
“When nitrogen is less available, every living thing holds on to the element for longer, slowing the flow of nitrogen from one organism to another through the food chain. This is why we can say that the nitrogen cycle is seizing up,” said Andrew Elmore, senior author on the paper, and a professor of landscape ecology at the University of Maryland Center for Environmental Science and at the National Socio-Environmental Synthesis Center.
On top of increasing atmospheric carbon dioxide, rising global temperatures also affect plant and microbial processes associated with nitrogen supply and demand. Warming often improves conditions for growth, which can result in longer growing seasons, leading plant nitrogen demand to exceed the supply available in soils. Disturbances, including wildfires, can also remove nitrogen from systems and reduce availability over time.
Intercalibration of isotopic records from leaves, tree rings, and lake sediments suggests that N availability in many terrestrial ecosystems has steadily declined since the beginning of the industrial era. Reductions in N availability may affect many aspects of ecosystem functioning, including carbon sequestration and herbivore nutrition. Shaded areas indicate 80% prediction intervals; marker size is proportional to the number of measurements in each annual mean.Isotope data: (tree ring) K. K. McLauchlan et al., Sci. Rep.7, 7856 (2017); (lake sediment) G. W. Holtgrieve et al., Science334, 1545–1548 (2011); (foliar) J. M. Craine et al., Nat. Ecol. Evol.2, 1735–1744 (2018)
Our evolving understanding of the Earth system has led to new concerns about N insufficiency after years of attention to surplus N in the environment. An integrated suite of responses will be needed to simultaneously manage both of these problems. Given the potential implications of declining N availability for food webs, carbon sequestration, and other ecosystem functions and services, it is important that research, management, and policy actions be taken before the consequences of declining N availability become more severe. It can be difficult to create a shared understanding of the N cycle and the many effects of N on ecosystem health and human well-being. The combination of excess N and declining N availability, in which outcomes vary widely across landscapes, adds to this challenge. Developing dialogues among diverse stakeholders—scientists, ecosystem managers, and others—will be necessary for alleviating and adapting to declining N availability in an N-rich world.
A war against farmers has emerged, threatening to push them off the land they’ve farmed for generations. As small and mid-sized farms close their doors, governments and corporate entities can scoop up the land. Those in control of the land control the food supply and, along with it, the people.
In Canada, Trudeau’s Liberals have announced a goal of a 50 percent reduction in emissions from fertilizer, a major producer of nitrous oxide, over the next seven years.
“Fertilizer Canada slammed the government’s short-sighted approach, arguing that reducing nitrogen fertilizer use “will have considerable impact on Canadian farmers’ incomes and reduce overall Canadian exports and GDP.”
They may as well slam their heads against a barn door. When it comes to Canada’s re-invention as a socialist state, nothing will knock the communist ship off its course.
“A report compiled by Meyers Norris Penny suggests that regulated fertilizer reduction could cost Canadian farmers $48 billion by 2030 and reduce crop sizes.”
Justin Trudeau has waged war against his own country since the day he became PM in 2015. This man doesn’t like our country very much, and in particular, maintains an innate hatred toward working class Canadians. Perhaps it’s because he has never been one. Then again, it could be part of a larger plot unfolding within society.
It was destined to roll around eventually: an attack on Canadian farmers under that gloriously green, climate emergency banner. This recent Trudeau move involves limiting the usage of fertilizer — a substance, when delivered in its most smelly, natural form, reminds us of what the federal Liberals have long shoveled upon Alberta.
Cutting the bull and arriving at the meat, so to speak: the government intends to effectively reduce farmers’ use of fertilizer by 50 per cent — in scientific terms by limiting the use of the key ingredient nitrous oxide — as part of its bid to severely reduce carbon emissions and thereby fight accelerating climate change.
Farmers, instead, want any fertilizer reductions measured by how much food is produced compared to the amount of fertilizer used, something western growers are striving for already, as growing more for less saves them money in addition to curbing emissions.
Now, when there’s a global food emergency looming due to the ongoing war in Ukraine, such a practical step would seem eminently sensible. But no, Trudeau is demanding an absolute reduction in usage, which will naturally result in less food being produced.
Contributing to global starvation has now become
part of current Canadian public policy.
This latest stupidity was undoubtedly spawned when our prime minister — always looking to one-up any country competing in the green-morality sweepstakes — learned the Dutch government intended such a move.
In the Netherlands that immediately resulted in mass protests by furious farmers, who closed highways with tractors, brought cows to the capital, threatening to slaughter them on parliamentary steps, while blocking vital food distribution centres.
Is the Nitrogen Crisis Real?
“In 2021, the European Union’s Natura 2000 network released a map of areas in the Netherlands that are now protected against nitrogen emissions. Any Dutch farmer who operates their farm within 5 kilometers of a Natura 2000 protected area would now need to severely curtail their nitrogen output, which in turn would limit their production”
Dutch dairy farmer Nynke Koopmans with the Forum for Democracy believes the nitrogen problem is made up. “It’s one big lie,” she says. “The nitrogen has nothing to do with environmental. It’s just getting rid of farmers.” Another farmer said if new nitrogen rules go into effect, he’d have to reduce his herd of 58 milking cows down to six.
Nitrogen scientist Jaap C. Hanekamp was working for a government committee to study nitrogen, tasked with analyzing the government’s nitrogen model. He told Balmakov:8
“The whole policy is based on the deposition model about how to deal with nitrogen emissions on nature areas. And I looked at the validation studies and show that the model is actually crap. It doesn’t work. And doesn’t matter. They still continue using it, which is, in a sense, unsettling. I mean, really, can we do such a thing in terms of policy? Use a model which doesn’t work? It’s never about innovation, it’s always about getting rid of farmers.”
Paper by C. A. de Lange, J. D. Ferguson, W. Happer, and W. A. van Wijngaarden. Excerpts in italics with my bolds.
Higher concentrations of atmospheric nitrous oxide (N2O) are expected to slightly warm Earth’s surface because of increases in radiative forcing. Radiative forcing is the difference in the net upward thermal radiation flux from the Earth through a transparent atmosphere and radiation through an otherwise identical atmosphere with greenhouse gases. Radiative forcing, normally measured in Wm−2, depends on latitude, longitude and altitude, but it is often quoted for the tropopause, about 11 km of altitude for temperate latitudes, or for the top of the atmosphere at around 90 km.
For current concentrations of greenhouse gases, the radiative forcing per added N2O molecule is about 230 times larger than the forcing per added carbon dioxide (CO2) molecule. This is due to the heavy saturation of the absorption band of the relatively abundant greenhouse gas, CO2, compared to the much smaller saturation of the absorption bands of the trace greenhouse gas N2O.
But the rate of increase of CO2 molecules, about 2.5 ppm/year (ppm = part per million by mole), is about 3000 times larger than increase of N2O molecules, which has held steady at around 0.00085 ppm/year since the year 1985. So, the contribution of nitrous oxide to the annual increase in forcing is 230/3000 or about 1/13 that of CO2. If the main greenhouse gases, CO2, CH4 and N2O have contributed about 0.1 C/decade of the warming observed over the past few decades, this would correspond to about 0.00064 K per year or 0.064 K per century of warming from N2O.
Proposals to place harsh restrictions on nitrous oxide emissions
because of warming fears are not justified by these facts.
Restrictions would cause serious harm;
for example, by jeopardizing world food supplies.
It all looks as the “nitrogen war” in the Netherlands is an anticipation of the conflict between environment awareness organizations and agriculture, industry over production systems and its consequences.
“I really understand their anger,” Marcel Crok, a Dutch science writer and co-founder of the Climate Intelligence Foundation, said in an interview. “The farmers are also angry because they say, ‘we are the only sector who get all the blame.’ What about industry? What about the traffic? Maybe we should just ban all the cars in the Netherlands because they also emit nitrogen.”
“This plan as announced in practice means that, in certain areas, farmers have to reduce their nitrogen emissions by 70%,” he continued. “That means they simply have to quit.”
The proposal to sharply cut nitrogen emissions is tied to a 2019 Dutch court decision forcing the nation’s government to take more aggressive measures to curb nitrogen emissions. The Netherlands, though, has heavily regulated agriculture emissions since the 1990s and farmers have largely complied with such rules, Crok said.
Netherlands emits a large quantity of nitrogen because of its massive agriculture industry which accounts for about 87% of the country’s 124 million kilograms of annual ammonia emissions, a US Department of Agriculture report showed. The nation exported US$26.8 billion worth of food products despite having a relatively tiny population compared to other major producers, according to World Bank data.
“It is not very rational to curb the Dutch agriculture if you realize that they have the highest production per acre in the world and therefore the environmental load per kilogram food is lower than elsewhere,” Simon Rozendaal, a Dutch journalist and chemists said. “So, in a sense Dutch agriculture is a benefit for climate as well as biodiversity.”
“This will definitely affect ordinary civilians and is part of a global agenda, so everyone around the world, especially Western countries, should be aware that this is something that is not just about the Dutch government. This is part of the ‘2030 agenda,’ this is part of the ‘great reset.’
”Similar protests could soon happen in the U.K. and parts of the European Union where natural gas and energy costs are near historic levels, according to Benny Peiser, the director of the London-based Global Warming Policy Foundation. In the U.K., increased prices are expected to send 24% of households, or about 6.5 million households, into fuel poverty.
“The issue is that despite this growing energy crisis in Europe, some governments still prioritize the climate agenda which makes energy ever more expensive, or which forces farmers to close their farms because that is the top priority, still, for a number of governments,” Peiser argued. “This whole green agenda is causing huge burdens.”
“The Dutch are driven mad by these policies because it’s killing their businesses and the farmers are fighting back big time,” he said. “This is what’s going to happen all over Europe. I have no doubt that, come winter and millions of families can’t heat their homes or pay their bills anymore, that there will be unrest all over Europe.”
The post below updates the UAH record of air temperatures over land and ocean. Each month and year exposed again the growing disconnect between the real world and the Zero Carbon zealots. It is as though the anti-hydrocarbon band wagon hopes to drown out the data contradicting their justification for the Great Energy Transition. Yes, there is warming from an El Nino buildup coincidental with North Atlantic warming, but no basis to blame it on CO2.
As an overview consider how recent rapid cooling completely overcame the warming from the last 3 El Ninos (1998, 2010 and 2016). The UAH record shows that the effects of the last one were gone as of April 2021, again in November 2021, and in February and June 2022 At year end 2022 and continuing into 2023 global temp anomaly matched or went lower than average since 1995, an ENSO neutral year. (UAH baseline is now 1991-2020).
For reference I added an overlay of CO2 annual concentrations as measured at Mauna Loa. While temperatures fluctuated up and down ending flat, CO2 went up steadily by ~60 ppm, a 15% increase.
Furthermore, going back to previous warmings prior to the satellite record shows that the entire rise of 0.8C since 1947 is due to oceanic, not human activity.
The animation is an update of a previous analysis from Dr. Murry Salby. These graphs use Hadcrut4 and include the 2016 El Nino warming event. The exhibit shows since 1947 GMT warmed by 0.8 C, from 13.9 to 14.7, as estimated by Hadcrut4. This resulted from three natural warming events involving ocean cycles. The most recent rise 2013-16 lifted temperatures by 0.2C. Previously the 1997-98 El Nino produced a plateau increase of 0.4C. Before that, a rise from 1977-81 added 0.2C to start the warming since 1947.
Importantly, the theory of human-caused global warming asserts that increasing CO2 in the atmosphere changes the baseline and causes systemic warming in our climate. On the contrary, all of the warming since 1947 was episodic, coming from three brief events associated with oceanic cycles. And now in 2023 we are seeing an amazing episode with a temperature spike driven by ocean air warming along with higher land air temps.
Update August 3, 2021
Chris Schoeneveld has produced a similar graph to the animation above, with a temperature series combining HadCRUT4 and UAH6. H/T WUWT
October 2023 Update New Warming Spike Led by Tropics High
With apologies to Paul Revere, this post is on the lookout for cooler weather with an eye on both the Land and the Sea. While you will hear a lot about 2020-21 temperatures matching 2016 as the highest ever, that spin ignores how fast the cooling set in. The UAH data analyzed below shows that warming from the last El Nino had fully dissipated with chilly temperatures in all regions. After a warming blip in 2022, land and ocean temps dropped again with 2023 starting below the mean since 1995. Spring and Summer 2023 saw a series of warmings. Now in October a new high resulted from a major rise in ocean air temps in all regions, along with higher land air temps in NH and Tropics.
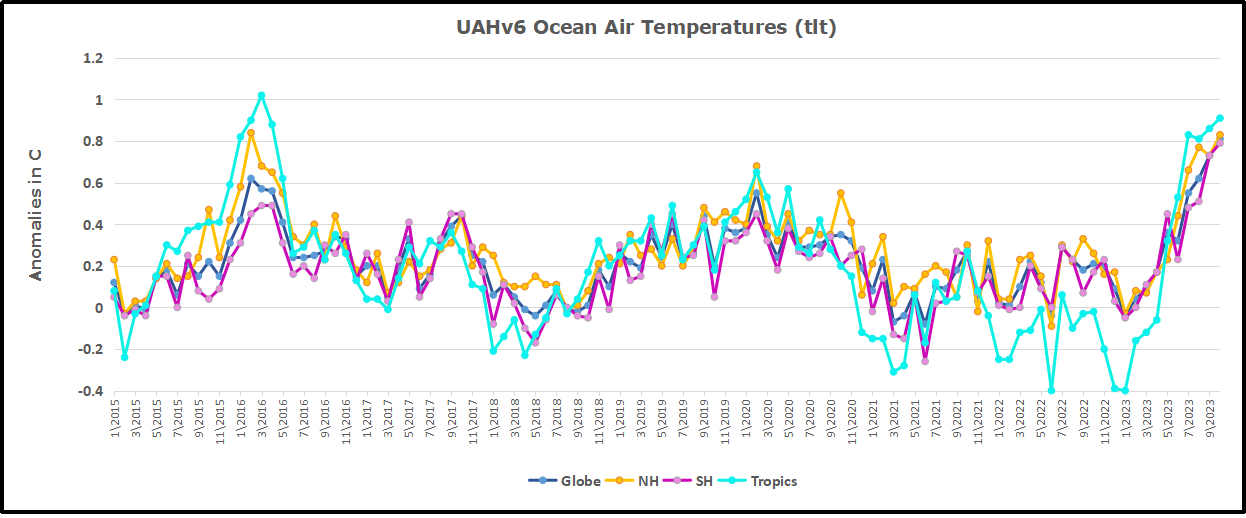
UAH has updated their tlt (temperatures in lower troposphere) dataset for October 2023. Posts on their reading of ocean air temps this month preceded updated records from HadSST4. I last posted on SSTs using HadSST4 September 2023 Ocean Warming Crests, Solar Coincidence? This month also has a separate graph of land air temps because the comparisons and contrasts are interesting as we contemplate possible cooling in coming months and years. Sometimes air temps over land diverge from ocean air changes. For example in October 2023, a new warming high was driven by ocean air temps despite SH land temps dropping back down. The Tropics and NH showed warming in both land and sea air.
In October, as shown later on, Global ocean air reached a record high peak with all regions warming, especially Tropics. Land air temps rose in NH and Tropics, with a SH dropping down. Thus the land + ocean Global UAH temperature is now exceeding the 2016 peak.
Note: UAH has shifted their baseline from 1981-2010 to 1991-2020 beginning with January 2021. In the charts below, the trends and fluctuations remain the same but the anomaly values change with the baseline reference shift.
Presently sea surface temperatures (SST) are the best available indicator of heat content gained or lost from earth’s climate system. Enthalpy is the thermodynamic term for total heat content in a system, and humidity differences in air parcels affect enthalpy. Measuring water temperature directly avoids distorted impressions from air measurements. In addition, ocean covers 71% of the planet surface and thus dominates surface temperature estimates. Eventually we will likely have reliable means of recording water temperatures at depth.
Recently, Dr. Ole Humlum reported from his research that air temperatures lag 2-3 months behind changes in SST. Thus the cooling oceans now portend cooling land air temperatures to follow. He also observed that changes in CO2 atmospheric concentrations lag behind SST by 11-12 months. This latter point is addressed in a previous post Who to Blame for Rising CO2?
After a change in priorities, updates are now exclusive to HadSST4. For comparison we can also look at lower troposphere temperatures (TLT) from UAHv6 which are now posted for September. The temperature record is derived from microwave sounding units (MSU) on board satellites like the one pictured above. Recently there was a change in UAH processing of satellite drift corrections, including dropping one platform which can no longer be corrected. The graphs below are taken from the revised and current dataset.
The UAH dataset includes temperature results for air above the oceans, and thus should be most comparable to the SSTs. There is the additional feature that ocean air temps avoid Urban Heat Islands (UHI). The graph below shows monthly anomalies for ocean air temps since January 2015.
Note 2020 was warmed mainly by a spike in February in all regions, and secondarily by an October spike in NH alone. In 2021, SH and the Tropics both pulled the Global anomaly down to a new low in April. Then SH and Tropics upward spikes, along with NH warming brought Global temps to a peak in October. That warmth was gone as November 2021 ocean temps plummeted everywhere. After an upward bump 01/2022 temps reversed and plunged downward in June. After an upward spike in July, ocean air everywhere cooled in August and also in September.
After sharp cooling everywhere in January 2023, all regions were into negative territory. Note the Tropics matched the lowest value, but since have spiked sharply upward +1.26C, with the largest increases in April to July 2023. NH also warmed 0.7C in the last 4 months, while SH ocean air rose the same. Global Ocean air October 2023 is now exceeding 2016, the main difference being the much higher rise in SH anomalies since April. The strength of the El Nino will determine the latter part of this year.
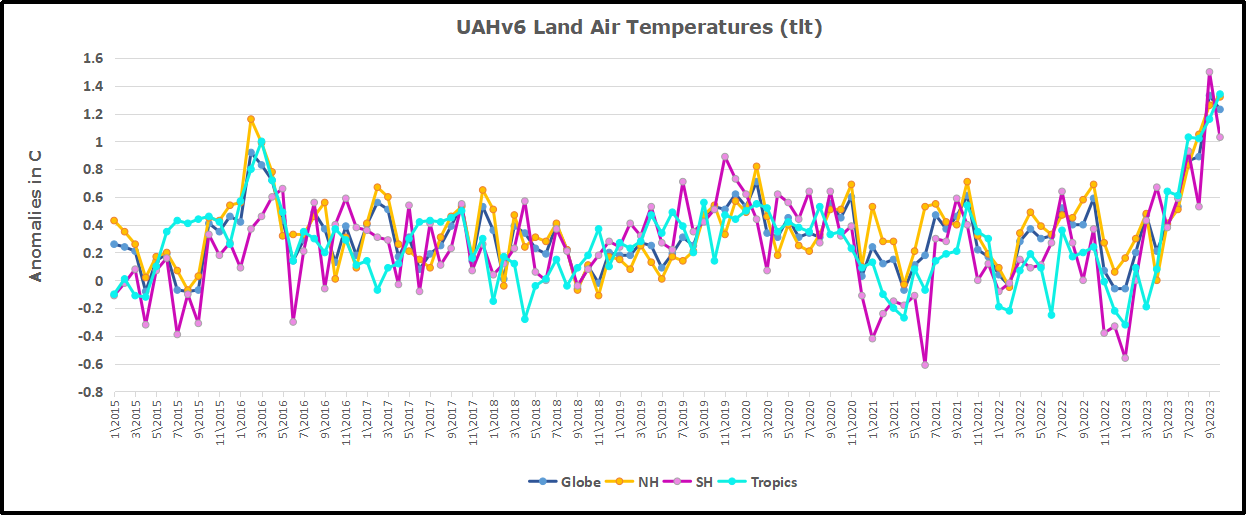
Land Air Temperatures Tracking Downward in Seesaw Pattern
We sometimes overlook that in climate temperature records, while the oceans are measured directly with SSTs, land temps are measured only indirectly. The land temperature records at surface stations sample air temps at 2 meters above ground. UAH gives tlt anomalies for air over land separately from ocean air temps. The graph updated for September is below.
Here we have fresh evidence of the greater volatility of the Land temperatures, along with extraordinary departures by SH land. Land temps are dominated by NH with a 2021 spike in January, then dropping before rising in the summer to peak in October 2021. As with the ocean air temps, all that was erased in November with a sharp cooling everywhere. After a summer 2022 NH spike, land temps dropped everywhere, and in January, further cooling in SH and Tropics offset by an uptick in NH.
Remarkably, in 2023, SH land air anomaly shot up 1.5C, from -0.56C in January to +0.93 in July, then dropped to 0.53 in August. In September SH shot up again to 1.5C. Tropical land temps are up 1.48 since January and NH Land air temps rose 0.9, mostly since May. Despite SH land air dropping in October, the consolidated rise greatly exceeds the upward spikes peaking in 2016.
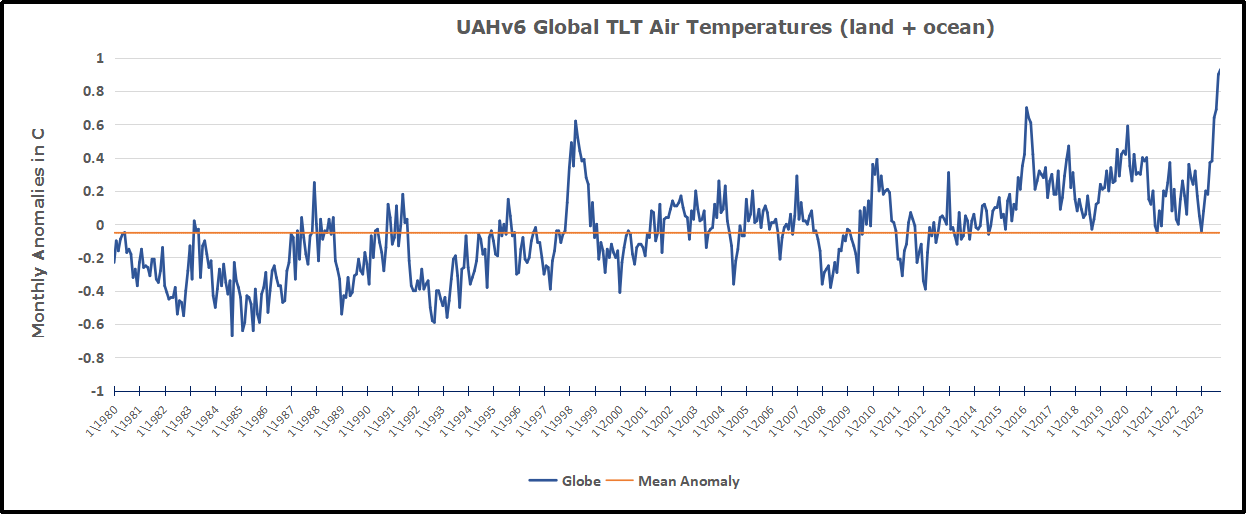
The Bigger Picture UAH Global Since 1980
The chart shows monthly Global anomalies starting 01/1980 to present. The average monthly anomaly is -0.06, for this period of more than four decades. The graph shows the 1998 El Nino after which the mean resumed, and again after the smaller 2010 event. The 2016 El Nino matched 1998 peak and in addition NH after effects lasted longer, followed by the NH warming 2019-20. An upward bump in 2021 was reversed with temps having returned close to the mean as of 2/2022. March and April brought warmer Global temps, later reversed.
With the sharp drops in Nov., Dec. and January 2023 temps, there was no increase over 1980. Now in 2023 the buildup to the October peak exceeds the sharp April peak of the El Nino 1998 event. It also surpasses the February peak in 2016. Where it goes from here, up or down, remains to be seen.
The graph reminds of another chart showing the abrupt ejection of humid air from Hunga Tonga eruption.
TLTs include mixing above the oceans and probably some influence from nearby more volatile land temps. Clearly NH and Global land temps have been dropping in a seesaw pattern, nearly 1C lower than the 2016 peak. Since the ocean has 1000 times the heat capacity as the atmosphere, that cooling is a significant driving force. TLT measures started the recent cooling later than SSTs from HadSST3, but are now showing the same pattern. Despite the three El Ninos, their warming has not persisted prior to 2023, and without them it would probably have cooled since 1995. Of course, the future has not yet been written.
I’ll summarize a recent paper that was published by our Coalition stating that coal, oil and natural gas are the greenest of the energy sources. The paper was published by one of our distinguished members Dr. Indur Goklany. This is no lightweight scientist we’re talking about here. Dr.Goklany opens his paper with his clear statement: Contrary to the claims of proponents of the green New Deal and Net Zero, fossil fuels are the greenest of fuels. In summary Dr Goklany’s findings and our paper are consistent with our view that fossil fuels are Treasures to be valued and used for the benefit of humanity. Their demonization is irrational and destructive to our society.
Coal and oil fueled the Industrial Revolution which gave us unprecedented prosperity and health. Together with natural gas they promise to raise billions of people in developing countries from poverty and deprivation.
in short we love CO2 and so should you. And in order to forestall a question I know will be coming, let me answer it ahead of time. What is my solution. You may have driven the Pennsylvania Turnpike and seen our billboard up near New Stanton. It’s a picture of a woman resting comfortably in bed and the title is: Sleep well, there is no climate crisis, there is no climate emergency.
There is no climate crisis. We see modest warming and increasing CO2 leading to gigantic benefits to our ecosystems and Humanity. We should celebrate that.
Based on a non-fiction book of the same name by historian Cornelius Ryan, A Bridge Too Far is a 1977 epic war film depicting Operation Market Garden, a failed Allied operation using paratroopers to secure three bridges over three key rivers in Nazi-occupied Netherlands during World War II. The phrase has come to mean “a long shot”, or an overly ambitious plan.
The metaphor can now be applied to 2023 regarding the onslaught of ESG bureaucratic regulation burdening enterprises around the world. Jon McGowan explains in his Forbes article The SEC’s New Rule May Inadvertently Kill ESG Funds. Excerpts in italics with my bolds and added images.
Securities and Exchange Commission recently announced a rule requiring environmental, social, and governance funds to be 80% aligned with the fund’s stated goals. This could reveal a long-held secret of ESG funds: to be competitive, they are packed with more profitable investments that are not green.
ESG is a type of investing where non-financial factors
are considered in the decision-making process.
ESG has grown quickly over the past few years, pushed by global action to meet the net zero goals of the Paris Accords. Globally, those non-financial factors are primarily focused on sustainability. However, in the US there has been an added focus relating to LGBTQ+ issues that some have deemed political, causing controversy.
The growth of ESG has sparked regulation for sustainable reporting standards for businesses. The European Union was the first, with the European Sustainability Reporting Standards that were approved in July and set to go into effect January 1. The ESRS will require publicly traded and large privately held companies to report greenhouse gas emissions, actions taken by the entity to reduce GHG emissions, and other green policies. Eventually it will expand to small and medium-sized enterprises. While reporting will be mandatory, no environmentally friendly action is required. The SEC is set to release similar standards for the US in October.
[Note: Bloomberg reports this week Banks May Escape EU’s Toughest ESG Regulation So Far Lawmakers, member states are negotiating due diligence rule
Firms face new civil liability, large fines under the proposal
The increased interest in ESG caused fund managers and businesses to adjust their practices. This sudden shift raised concerns of greenwashing, or the exaggeration of environmentally friendly initiatives to appear greener than they actually are. A new term, climate washing, has recently developed that is specific to the exaggeration of climate change initiatives.
Greenwashing for marketing purposes, while misleading, rarely met the standard of a regulatory violation. However, when greenwashing is directed at investors it could violate financial regulations and fall under the authority of the SEC. The SEC recently fined Deutsche Bank’s investment arm, DWS, $19 million for “materially misleading statements” relating to greenwashing in ESG funds. However, enforcement is problematic as the threshold for what constitutes greenwashing was not previously defined.
That changed when the SEC announced a new rule that requires ESG funds to match at least 80% of their portfolio with the stated goals of the fund. This new rule came just weeks after the SEC issued a round of subpoenas to an unknown number of fund managers relating to their ESG fund practices.
While the 80% requirement will settle greenwashing concerns,
it could be problematic for the viability of ESG funds.
Environmentalist and aligned organizations have frequently expressed concerns that some ESG funds were stacked with investments that were contrary to sustainable goals.A 2022 study by ESG Book found that ESG funds on average produced 14% higher GHG emissions than traditional funds. The same study found ESG funds investing in mining and fossil fuels, including Shell, Exxon Mobile, and BHP Group. The ESG Book study is not alone or new. Multiple studies have been released by environmental think tanks chastising ESG funds for not being sustainable.
Fund managers are placed in a precarious position of trying to offer
environmentally friendly funds, while also
meeting their fiduciary duty to maximize returns.
In doing so, they are forced to offset the underperformance of sustainable investments with investments in companies that are high profit, but contrary to the green goals. The result is funds that are not truly green, but greenish.
The new SEC rule will force fund managers to limit that practice to 20% of the fund. The unsettled question is how that will impact returns.ESG funds already underperform compared to traditional funds, the 80% rule may make them no longer a viable investment.
With COP28 scheduled to start on November 30, 2023 in Dubai, Climate Crisis Central decided the Greenland Ice Sheet is the doomsday story this week. For Example:
North Greenland ice shelves have lost 35% of their volume, with “dramatic consequences” for sea level rise, study says CBS News
Greenland’s ice shelves have shrunk by more than a THIRD since 1978 – and will cause global sea levels to rise by 6.8 FEET if they collapse entirely, study warns Daily Mail
Alarming collapse of Greenland ice shelves sparks warning of sea level rise Live Science
Greenland’s northern glaciers are in trouble, threatening ‘dramatic’ sea level rise, study shows CNN
Greenland glaciers melt five times faster than 20 years ago Reuters
Satellite data and 100-year-old images reveal quickening retreat of Greenland’s glaciers Space.com
Etc., Etc., Etc.
The scare du jour is about Greenland Ice Sheet (GIS) and how it will melt out and flood us all. It’s declared that GIS has passed its tipping point, and we are doomed. Typical is this report from phys.org Study finds Greenland’s glacier retreat rate has doubled over past two decades. Excerpts in italics with my bolds.
Although glaciers in Greenland have experienced retreat throughout the last century, the rate of their retreat has rapidly accelerated over the last two decades. According to the multiyear collaborative effort between the United States and Denmark, the rate of glacial retreat during the 21st century is twice as fastas retreat during the 20th century. And, despite the range of climates and topographical characteristics across Greenland, the findings are ubiquitous, even among Earth’s northernmost glaciers.
The findings underscore the region’s sensitivity to rising temperatures due to human-caused climate change. The study is published in the journal Nature Climate Change.
“Our study places the recent retreat of peripheral glaciers across Greenland’s diverse climate zones into a century-long perspective and suggests that their rate of retreat in the 21st century is largely unprecedented on a century timescale,” said Laura Larocca, the study’s first author. “The only major possible exception are glaciers in northeast Greenland, where it looks like recent increases in snowfall might be slowing retreat.”
The study finds that climate change explains the accelerated glacier retreat and that glaciers across Greenland respond quickly to changing temperatures. This highlights the importance of slowing global warming.
“Our activities over the next couple decades will greatly affect these glaciers. Every bit of temperature increase really matters,” Larocca said.
Annual Greenland Fluctuations in Perspective
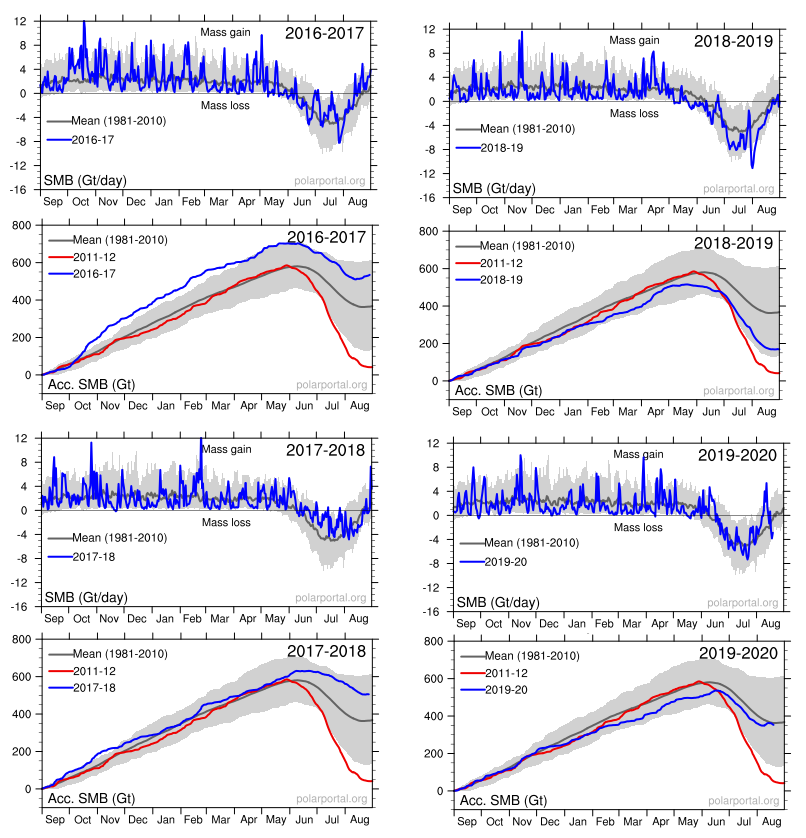
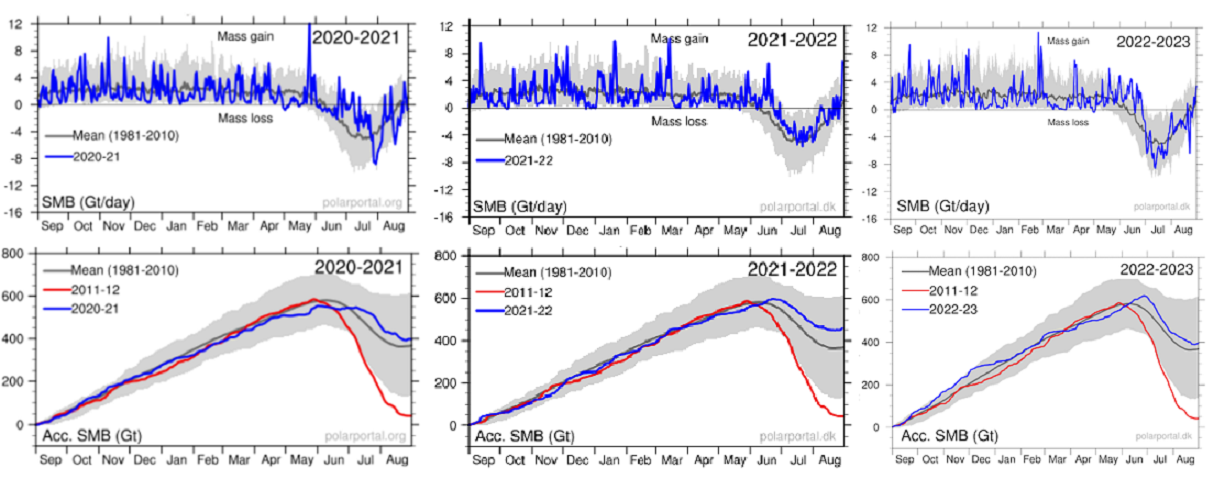
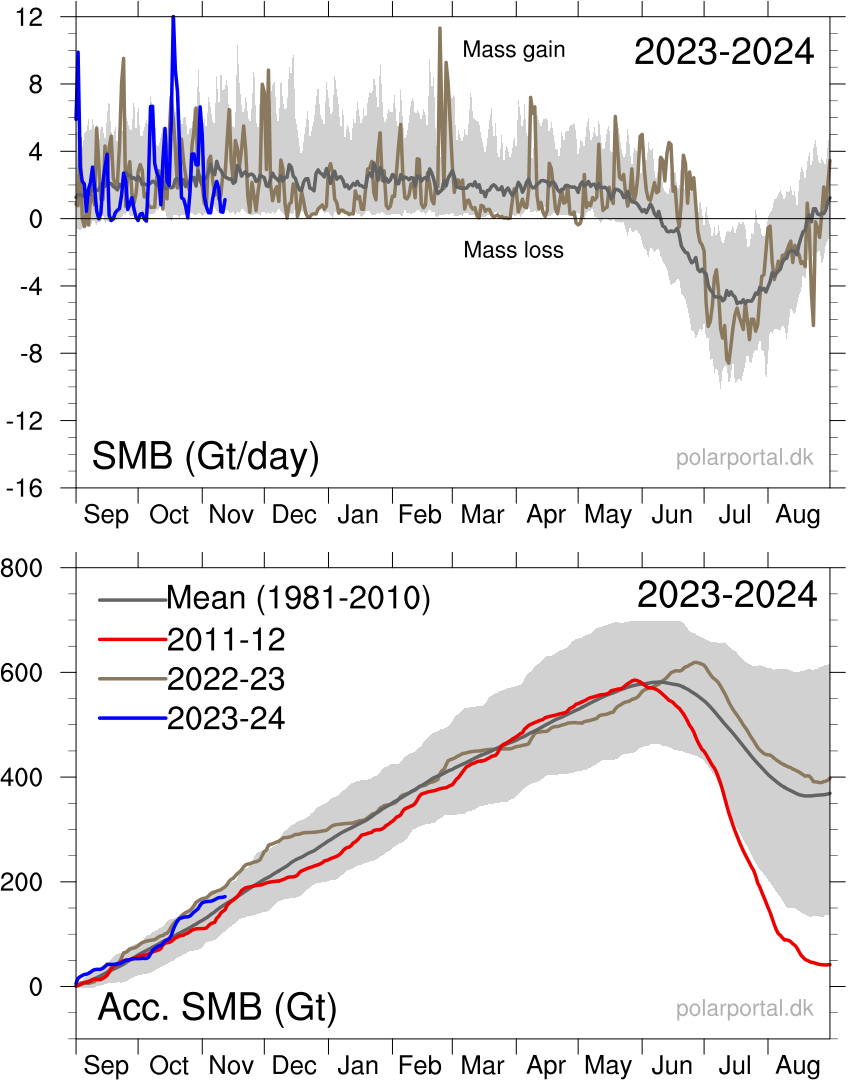
Panic is warranted only if you treat this as proof of an alarmist narrative and ignore the facts and context in which natural variation occurs. For starters, consider the last seven years of GIS fluctuations reported by DMI and summarized in the fourteen graphs below. Note the noisy blue lines showing how the surface mass balance (SMB) changes its daily weight by 8 or 10 gigatonnes (Gt) around the baseline mean from 1981 to 2010. Note also the summer decrease between May and August each year before recovering to match or exceed the mean.
The other seven graphs show the accumulation of SMB for each of the last seven years including 2023. Tipping Point? Note that in both 2017 and 2018, SMB ended about 500 Gt higher than the year began, and way higher than 2012, which added nothing. Then came 2019 dropping below the mean, but still above 2012. Finally, the last three years exceeded the 30-year average. Note also that the charts do not integrate from previous years; i.e. each year starts at zero and shows the accumulation only for that year. Thus the gains from 2017 and 2018 do not result in 2019 starting the year up 1000 Gt, but from zero. Nor will the gains in 2021, 2022 and 2023 be added to the base.
And if you’re wondering, the current year is also above average.
While they may appear solid, all ice sheets—which are essentially giant glaciers—experience movement: ice flows downslope either through the process of deformation or sliding. The latest results suggest that the movement of the ice on the GIS is dominated by sliding, not deformation. This process is moving ice to the marginal zones of the sheet, where melting occurs, at a much faster rate.
“The study was motivated by a major unknown in how the ice of Greenland moves from the cold interior, to the melting regions on the margins,” Neil Humphrey, a professor of geology from the University of Wyoming and author of the study, told Newsweek. “The ice is known to move both by sliding over the bedrock under the ice, and by oozing (deforming) like slowly flowing honey or molasses. What was unknown was the ratio between these two modes of motion—sliding or deforming.
“This lack of understanding makes predicting the future difficult, since we know how to calculate the flowing, but do not know much about sliding,” he said. “Although melt can occur anywhere in Greenland, the only place that significant melt can occur is in the low altitude margins. The center (high altitude) of the ice is too cold for the melt to contribute significant water to the oceans; that only occurs at the margins. Therefore ice has to get from where it snows in the interior to the margins.
“The implications for having high sliding along the margin of the ice sheet means that thinning or thickening along the margins due to changes in ice speed can occur much more rapidly than previously thought,” Maier said. “This is really important; as when the ice sheet thins or thickens it will either increase the rate of melting or alternatively become more resilient in a changing climate.“
“There has been some debate as to whether ice flow along the edges of Greenland should be considered mostly deformation or mostly sliding,” Maier says. “This has to do with uncertainty of trying to calculate deformation motion using surface measurements alone. Our direct measurements of sliding- dominated motion, along with sliding measurements made by other research teams in Greenland, make a pretty compelling argument that no matter where you go along the edges of Greenland, you are likely to have a lot of sliding.”
The sliding ice does two things, Humphrey says. First, it allows the ice to slide into the ocean and make icebergs, which then float away. Two, the ice slides into lower, warmer climate, where it can melt faster.
While it may sound dire, Humphrey notes the entire Greenland Ice Sheet is 5,000 to 10,000 feet thick.
“In a really big melt year, the ice sheet might melt a few feet. It means Greenland is going to be there another 10,000 years,” Humphrey says. “So, it’s not the catastrophe the media is overhyping.”
Humphrey has been working in Greenland for the past 30 years and says the Greenland Ice Sheet has only melted 10 feet during that time span.
Summary
The Greenland ice sheet is more than 1.2 miles thick in most regions. If all of its ice was to melt, global sea levels could be expected to rise by about 25 feet. However, this would take more than 10,000 years at the current rates of melting.
Background from Previous Post: Greenland Glaciers: History vs. Hysteria
The modern pattern of environmental scares started with Rachel Carson’s Silent Spring claiming chemicals are killing birds, only today it is windmills doing the carnage. That was followed by ever expanding doomsday scenarios, from DDT, to SST, to CFC, and now the most glorious of them all, CO2. In all cases the menace was placed in remote areas difficult for objective observers to verify or contradict. From the wilderness bird sanctuaries, the scares are now hiding in the stratosphere and more recently in the Arctic and Antarctic polar deserts. See Progressively Scaring the World (Lewin book synopsis)
The advantage of course is that no one can challenge the claims with facts on the ground, or on the ice. Correction: Scratch “no one”, because the climate faithful are the exception. Highly motivated to go to the ends of the earth, they will look through their alarmist glasses and bring back the news that we are indeed doomed for using fossil fuels.
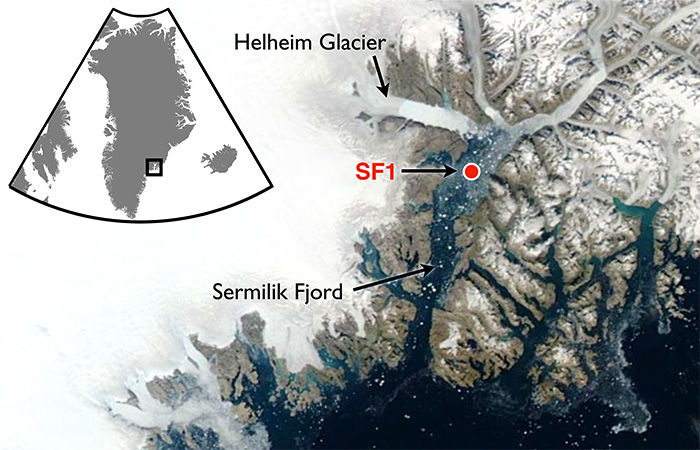
A recent example is a team of researchers from Dubai (the hot and sandy petro kingdom) going to Greenland to report on the melting of Helheim glacier there. The article is NYUAD team finds reasons behind Greenland’s glacier melt. Excerpts in italics with my bolds.
First the study and findings:
For the first time, warm waters that originate in the tropics have been found at uniform depth, displacing the cold polar water at the Helheim calving front, causing an unusually high melt rate. Typically, ocean waters near the terminus of an outlet glacier like Helheim are at the freezing point and cause little melting.
NYUAD researchers, led by Professor of Mathematics at NYU’s Courant Institute of Mathematical Sciences and Principal Investigator for NYU Abu Dhabi’s Centre for Sea Level Change David Holland, on August 5, deployed a helicopter-borne ocean temperature probe into a pond-like opening, created by warm ocean waters, in the usually thick and frozen melange in front of the glacier terminus.
Normally, warm, salty waters from the tropics travel north with the Gulf Stream, where at Greenland they meet with cold, fresh water coming from the polar region. Because the tropical waters are so salty, they normally sink beneath the polar waters. But Holland and his team discovered that the temperature of the ocean water at the base of the glacier was a uniform 4 degrees Centigrade from top to bottom at depth to 800 metres. The finding was also recently confirmed by Nasa’s OMG (Oceans Melting Greenland) project.
“This is unsustainable from the point of view of glacier mass balance as the warm waters are melting the glacier much faster than they can be replenished,” said Holland.
Surface melt drains through the ice sheet and flows under the glacier and into the ocean. Such fresh waters input at the calving front at depth have enormous buoyancy and want to reach the surface of the ocean at the calving front. In doing so, they draw the deep warm tropical water up to the surface, as well.
All around Greenland, at depth, warm tropical waters can be found at many locations. Their presence over time changes depending on the behaviour of the Gulf Stream. Over the last two decades, the warm tropical waters at depth have been found in abundance. Greenland outlet glaciers like Helheim have been melting rapidly and retreating since the arrival of these warm waters.
Then the Hysteria and Pledge of Alligiance to Global Warming
“We are surprised to learn that increased surface glacier melt due to warming atmosphere can trigger increased ocean melting of the glacier,” added Holland. “Essentially, the warming air and warming ocean water are delivering a troubling ‘one-two punch’ that is rapidly accelerating glacier melt.”
My comment: Hold on. They studied effects from warmer ocean water gaining access underneath that glacier. Oceans have roughly 1000 times the heat capacity of the atmosphere, so the idea that the air is warming the water is far-fetched. And remember also that long wave radiation of the sort that CO2 can emit can not penetrate beyond the first millimeter or so of the water surface. So how did warmer ocean water get attributed to rising CO2? Don’t ask, don’t tell. And the idea that air is melting Arctic glaciers is also unfounded.
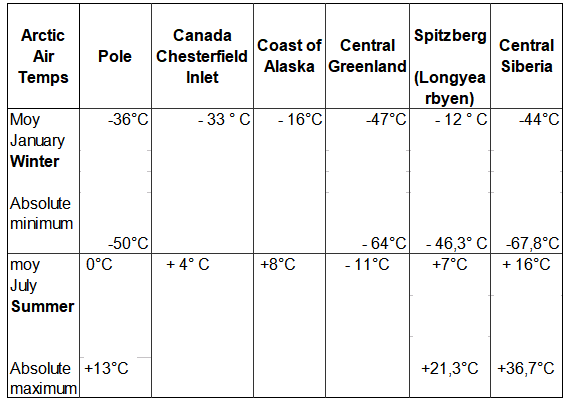
Consider the basics of air parcels in the Arctic.
The central region of the Arctic is very dry. Why? Firstly because the water is frozen and releases very little water vapour into the atmosphere. And secondly because (according to the laws of physics) cold air can retain very little moisture.
Greenland has the only veritable polar ice cap in the Arctic, meaning that the climate is even harsher (10°C colder) than at the North Pole, except along the coast and in the southern part of the landmass where the Atlantic has a warming effect. The marked stability of Greenland’s climate is due to a layer of very cold air just above ground level, air that is always heavier than the upper layers of the troposphere. The result of this is a strong, gravity-driven air flow down the slopes (i.e. catabatic winds), generating gusts that can reach 200 kph at ground level.
Arctic air temperatures Some history and scientific facts are needed to put these claims in context. Let’s start with what is known about Helheim Glacier.
Holocene history of the Helheim Glacier, southeast Greenland
Helheim Glacier ranks among the fastest flowing and most ice discharging outlets of the Greenland Ice Sheet (GrIS). After undergoing rapid speed-up in the early 2000s, understanding its long-term mass balance and dynamic has become increasingly important. Here, we present the first record of direct Holocene ice-marginal changes of the Helheim Glacier following the initial deglaciation. By analysing cores from lakes adjacent to the present ice margin, we pinpoint periods of advance and retreat. We target threshold lakes, which receive glacial meltwater only when the margin is at an advanced position, similar to the present. We show that, during the period from 10.5 to 9.6 cal ka BP, the extent of Helheim Glacier was similar to that of todays, after which it remained retracted for most of the Holocene until a re-advance caused it to reach its present extent at c. 0.3 cal ka BP, during the Little Ice Age (LIA). Thus, Helheim Glacier’s present extent is the largest since the last deglaciation, and its Holocene history shows that it is capable of recovering after several millennia of warming and retreat. Furthermore, the absence of advances beyond the present-day position during for example the 9.3 and 8.2 ka cold events as well as the early-Neoglacial suggest a substantial retreat during most of the Holocene.
The topography of Greenland shows why its ice cap has persisted for millenia despite its southerly location. It is a bowl surrounded by ridges except for a few outlets, Helheim being a major one.
Helheim Glacier is the fastest flowing glacier along the eastern edge of Greenland Ice Sheet and one of the island’s largest ocean-terminating rivers of ice. Named after the Vikings’ world of the dead, Helheim has kept scientists on their toes for the past two decades. Between 2000 and 2005, Helheim quickly increased the rate at which it dumped ice to the sea, while also rapidly retreating inland- a behavior also seen in other glaciers around Greenland. Since then, the ice loss has slowed down and the glacier’s front has partially recovered, readvancing by about 2 miles of the more than 4 miles it had initially retreated.
NASA has compiled a time series of airborne observations of Helheim’s changes into a new visualization that illustrates the complexity of studying Earth’s changing ice sheets. NASA uses satellites and airborne sensors to track variations in polar ice year after year to figure out what’s driving these changes and what impact they will have in the future on global concerns like sea level rise.
Since 1997, NASA has collected data over Helheim Glacier almost every year during annual airborne surveys of the Greenland Ice Sheet using an airborne laser altimeter called the Airborne Topographic Mapper (ATM). Since 2009 these surveys have continued as part of Operation IceBridge, NASA’s ongoing airborne survey of polar ice and its longest-running airborne mission. ATM measures the elevation of the glacier along a swath as the plane files along the middle of the glacier. By comparing the changes in the height of the glacier surface from year to year, scientists estimate how much ice the glacier has lost.
The animation begins by showing the NASA P-3 plane collecting elevation data in 1998. The laser instrument maps the glacier’s surface in a circular scanning pattern, firing laser shots that reflect off the ice and are recorded by the laser’s detectors aboard the airplane. The instrument measures the time it takes for the laser pulses to travel down to the ice and back to the aircraft, enabling scientists to measure the height of the ice surface. In the animation, the laser data is combined with three-dimensional images created from IceBridge’s high-resolution camera system. The animation then switches to data collected in 2013, showing how the surface elevation and position of the calving front (the edge of the glacier, from where it sheds ice) have changed over those 15 years.
Helheim’s calving front retreated about 2.5 miles between 1998 and 2013. It also thinned by around 330 feet during that period, one of the fastest thinning rates in Greenland.
“The calving front of the glacier most likely was perched on a ledge in the bedrock in 1998 and then something altered its equilibrium,” said Joe MacGregor, IceBridge deputy project scientist. “One of the most likely culprits is a change in ocean circulation or temperature, such that slightly warmer water entered into the fjord, melted a bit more ice and disturbed the glacier’s delicate balance of forces.”
In addition consider Greenland Ice Math
Prompted by comments from Gordon Walleville, let’s look at Greenland ice gains and losses in context. The ongoing SMB (surface mass balance) estimates ice sheet mass net from melting and sublimation losses and precipitation gains. Dynamic ice loss is a separate calculation of calving chunks of ice off the edges of the sheet, as discussed in the post above. The two factors are combined in a paper Forty-six years of Greenland Ice Sheet mass balance from 1972 to 2018 by Mouginot et al. (2019) Excerpt in italics. (“D” refers to dynamic ice loss.)
Greenland’s SMB averaged 422 ± 10 Gt/y in 1961–1989 (SI Appendix, Fig. S1H). It decreased from 506 ± 18 Gt/y in the 1970s to 410 ± 17 Gt/y in the 1980s and 1990s, 251 ± 20 Gt/y in 2010–2018, and a minimum at 145 ± 55 Gt/y in 2012. In 2018, SMB was above equilibrium at 449 ± 55 Gt, but the ice sheet still lost 105 ± 55 Gt, because D is well above equilibrium and 15 Gt higher than in 2017. In 1972–2000, D averaged 456 ± 1 Gt/y, near balance, to peak at 555 ± 12 Gt/y in 2018. In total, the mass loss increased to 286 ± 20 Gt/y in 2010–2018 due to an 18 ± 1% increase in D and a 48 ± 9% decrease in SMB. The ice sheet gained 47 ± 21 Gt/y in 1972–1980, and lost 50 ± 17 Gt/y in the 1980s, 41 ± 17 Gt/y in the 1990s, 187 ± 17 Gt/y in the 2000s, and 286 ± 20 Gt/y in 2010–2018 (Fig. 2). Since 1972, the ice sheet lost 4,976 ± 400 Gt, or 13.7 ± 1.1 mm SLR.
Doing the numbers: Greenland area 2.1 10^6 km2 80% ice cover, 1500 m thick in average- That is 2.5 Million Gton. Simplified to 1 km3 = 1 Gton
The estimated loss since 1972 is 5000 Gt (rounded off), which is 110 Gt a year. The more recent estimates are higher, in the 200 Gt range.
200 Gton is 0.008 % of the Greenland ice sheet mass.
Annual snowfall: From the Lost Squadron, we know at that particular spot, the ice increase since 1942 – 1990 was 1.5 m/year ( Planes were found 75 m below surface) Assume that yearly precipitation is 100 mm / year over the entire surface. That is 168000 Gton. Yes, Greenland is Big! Inflow = 168,000Gton. Outflow is 168,200 Gton.
So if that 200 Gton rate continued, (assuming as models do, despite air photos showing fluctuations), that ice loss would result in a 1% loss of Greenland ice in 800 years. (H/t Bengt Abelsson)
Comment:
Once again, history is a better guide than hysteria. Over time glaciers advance and retreat, and incursions of warm water are a key factor. Greenland ice cap and glaciers are part of the Arctic self-oscillating climate system operating on a quasi-60 year cycle.
The science about climate change is settled, right? We’re reassured by the media again and again that there is almost complete unanimity when it comes to the question of whether changes in the climate are caused by humans. And we’re also told there’s so much consensus that anyone who says otherwise isn’t a real scientist, but a “climate change skeptic” just trying to muddy the pristine waters of settled science. In this episode of America Uncovered, we look at the sun’s role in global warming, why so many human-caused-climate-change proponents don’t want to look at this data, and how they’re trying to discredit climate scientists who are looking at factors that question the human-caused climate-change narrative.
Transcript
For those who prefer to read, the Transcript is below in italics with my bolds and added images.
The UN and prominent scientific organizations say the science is settled. No one can dispute that climate change is mainly caused by humans. Those who question it are insulted and shunned. Which is exactly the way the scientific method is supposed to work.
Welcome to America Uncovered. I’m Chris Chappell. Everywhere you look these days, it seems there’s someone pushing “the narrative.” America is irredeemably racist . Christopher Columbus was evil. Pineapple on pizza is gross . Wrong! Its sweet tanginess is a great counterbalance to the salt and acidity of the sauce. Refine your palates, you swine.
Journalists push narratives all the time, but so do scientists. Now, there’s this naive notion that scientists are above pushing narratives, because all they do is look at provable facts. But that couldn’t be further from the truth, especially for complex topics where the facts aren’t always so clear cut.
Look no further than the climate change debate. The most influential scientific organizations make it sound like it is a fact supported almost unanimously by the scientific community that climate change is mostly man-made. Which should immediately make you start questioning things, since no community unanimously believes anything. If they did, then 10 out of 10 dentists would recommend Crest toothpaste .
Just look at how the UN presents the topic. According to the UN’s Intergovernmental Panel on Climate Change (IPCC) 2023 report, “Human activities are responsible for global warming” by increasing greenhouse gasses. “It is unequivocal that human influence has warmed the atmosphere, ocean and land.” In other words, don’t question it! You *have* to accept that humans are the driving factor for climate change. There’s not supposed to be debate in science. That’s why we still believe the Earth is the center of the universe and everything revolves around it. That science was settled centuries ago!
This type of messaging has had a profound impact on public policy all over the world. Billions of dollars have gone into addressing climate change and studying its effects. The narrative about man-made climate change is so loud and pervasive that CNN can ask, “why are we still debating climate change?” and reasonably expect readers to say, “yeah!”
In reality, though, it’s a lot more complicated than that. I’ve debunked the “97% of scientists agree on man-made climate change” narrative in a previous episode. The reality is, there’s no consensus on how large of a role human activity plays in climate change or even how climate is changing.
How they invented the “97% of scientists agree” meme.
Now, I’ve said this before, and I’ll say it again—I’m not a conspiracy theorist, and I’m not taking sides on the climate change debate either. I’m not necessarily dismissing the idea that mankind is driving climate change, but I’m not going to say that everything’s settled, because it’s not.
Uh oh, I just said something nuanced. You know what that means: Goodbye, YouTube ad revenue. And that is exactly the problem! It’s not very popular to question the climate change narrative, especially when billions of dollars are on the line. But there are some scientists who question the narrative anyway. One of the most prominent voices is Wei-Hock—or Willie—Soon , a Malaysian Astrophysicist and aerospace engineer who used to work at the Harvard–Smithsonian Center for Astrophysics.
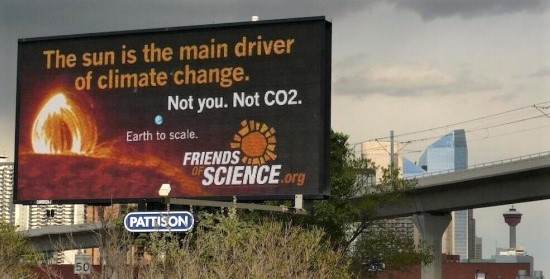
Soon is known for promoting the hypothesis that the sun may have more to do with current climate change than human activity. He’s not necessarily saying that there’s no such thing as man-made climate change, but he is very vocal about how the UN reportedly suppresses the sun’s role in climate change. I should have known the sun was diabolical. After all, it kills me every time I play Super Mario 3.
Over the years, Soon’s research has been attacked by other scientists and the mainstream media. Carbon Brief released an explainer pushing back against the idea that the sun is responsible for recent climate change. Slate said that “[Soon’s] science has been refuted.” Because “The science is in, it’s extremely clear, and the consensus among climate scientists is solid.” 10 out of 10 scientists agree!
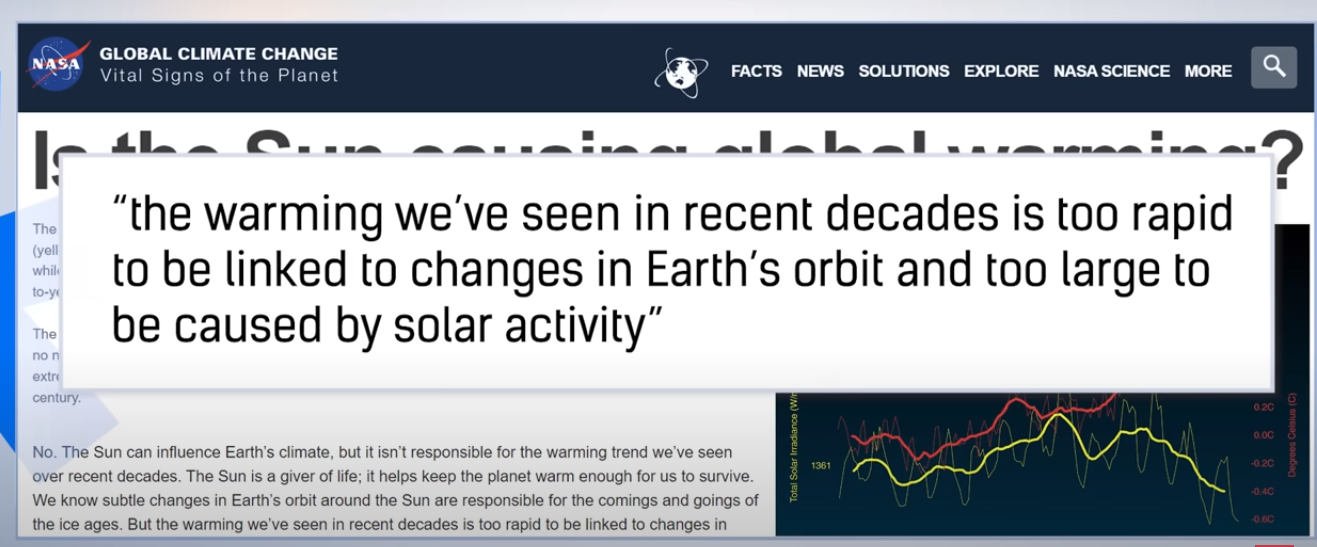
The Union of Concerned Scientists, the Imperial College London, the World Meteorological Organization, and a whole bunch more organizations all say the same thing. NASA is especially adamant about shutting down the sun theory. In its explainer, NASA says, “The Sun can influence Earth’s climate, but it isn’t responsible for the warming trend we’ve seen over recent decades.”
Okay, but what about when it chases you through the desert levels? Explain that, science! NASA and other scientific organizations argue that there isn’t any increase in solar energy reaching the planet. “So, there is a line, and the scientific community is well in agreement. According to NASA, scientists agree that the solar cycle is not driving the changes in Earth’s climate that we’re currently seeing. If we saw solar radiation increasing for a long period of time, we could see those effects on our climate, but the changes between solar cycles are pretty small and not able to drive the drastic changes we’ve seen over the last few decades.”
Plus, if there were so many solar rays, then how come we don’t have a real life Fantastic Four, hm?Science. Settled. Keep an eye on NASA. There’s a reason why NASA in particular is vocal in debunking the sun theory, which I’ll get into later in this episode.
Now, that’s how science works. One scientist puts out research, and other scientists challenge the results. But apparently, refuting Soon’s science wasn’t enough. The scientific community and the mainstream media went after Soon personally, and not always in the most honest of ways.
Scientists and the mainstream media have attacked Soon’s research on the sun’s role in climate change, but they’ve also attacked Soon, and it can be a bit disingenuous. For example, since 2011, the environmentalist nonprofit Greenpeace has pushed the idea that Soon’s research was funded by the fossil-fuel industry and suggested that Soon improperly concealed his funding sources in one of his publications.
But that’s misleading. According to The Heartland Institute, “As a working scientist… Soon had no authority to sign a research contract to receive a grant, let alone to decide and dictate the terms of such contracts.” Who did have the authority? Soon’s employer. “Dr. Soon and other working scientists like him are paid by the Smithsonian, not by the external funder, to carry out those duties. Simply put, Dr. Soon is employed by the Smithsonian to conduct research paid for by external grants obtained by the Smithsonian.” So, if true, it would have been the Smithsonian that accepted money from the fossil-fuel industry.
Meanwhile, The Union of Concerned Scientists suggests that Soon’s work was part of a broader pattern of deception by fossil fuel companies. And as for the mainstream media? Well, they have disdainfully called Soon a climate skeptic. The problem is, Soon isn’t the only scientist asking questions. In 2021, Soon, along with almost 2 dozen other scientists from all over the world, published a study on the Institute of Physics Publishing asking, “How much has the Sun influenced Northern Hemisphere temperature trends?” They called it “an ongoing debate.”
It’s a pretty dense read. But to summarize, the study points to solar radiation on the Earth’s atmosphere as the driver of global warming and cites dozens of other studies that point to the sun—not human activity—as the primary driver of climate change. The study also argues that the way the UN’s Intergovernmental Panel on Climate Change concluded that climate change was man-made was flawed. It ignored data, such as NASA’s sun-monitoring satellite data, which the authors argued would’ve countered the man-made climate change narrative.
According to the lead study author, Ronan Connolly , “Depending on which published data and studies you use, you can show that all of the warming is caused by the sun, but the IPCC uses a different data set to come up with the opposite conclusion.” Climate is seriously complex, and there’s a lot of data to consider, so this could just be a mistake, but Connolly doesn’t seem to think so. “In their insistence on forcing a so-called scientific consensus, the IPCC seems to have decided to consider only those data sets and studies that support their chosen narrative.”
This didn’t sit well with most climate change scientists. One 2022 study tried to debunk the sun theory as “erroneous”. Those authors pretty much argued it was a waste of time that could be better used on areas of “legitimate scientific uncertainty”. However, Soon and various other scientists came out with three new studies earlier this year that say otherwise.
This one looked at datasets that the UN didn’t look into to conclude that the UN underestimated the sun’s role in global warming. This included data from NASA’s satellites. Which is a pretty big flex, using data from an organization that doesn’t agree with you to prove your point. Their study also argues that the UN underestimated how weather stations are impacted by urbanization, which generates heat from human activity.
It’s similar to the conclusions made by this study, which specifically addressed the 2022 study that criticized the sun theory. This other study specifically compared Japan and the US to show the impact that urbanization has on weather station data collection. So they’re essentially saying that the way they collect data was flawed, and so were their conclusions.
Now, the studies aren’t completely dismissing the idea that climate change is man-made. They’re simply saying that there isn’t enough data to determine whether global warming is mostly man-made, mostly natural, or a combination of both. Which is why Willie Soon is one of thousands of scientists who have signed the World Climate Declaration, which says that there is no climate emergency…and that “natural as well as anthropogenic factors cause warming.”
One of the scientists involved in the research said the analysis “opens the door to a proper scientific investigation into the causes of climate change.” But it turns out certain scientists are absolutely livid about these studies. They want to slam that door shut , barricade it, and put up a “get off my lawn” sign.”
Some scientists are angry about the multiple studies done by Soon and his colleagues regarding the sun’s role in climate change, and they’re making their displeasure known. But the way these scientists speak to other scientists makes them sound like fourth-grade bullies rather than professional researchers.
For example, Atmospheric science professor Michael Mann of Pennsylvania State University —The guy famous for what’s called the hockey stick graph—Referred to the authors of one of the studies as “a group of climate denier [clowns]”. Which is ridiculous, because clowns aren’t climate deniers. They’re better than anyone at reducing emissions by carpooling with 30 of them in a single vehicle .
Mann also apparently sees anyone whom he classifies as a climate denier of being “truly awful human beings”. I don’t remember the part of the scientific method where you call names on anyone who questions you. Oh wait, there it is. Many climate scientists are quick to dismiss studies that don’t align with the climate change narrative.
For example, Gareth Jones of the UK’s Meteorologist Office called a review that disagreed with him “nonsense.” Jones also seems to enjoy smearing people like the editor of the journal Climate, saying that he “has a bit of a reputation, so much so that other climate contrarians distance themselves from him”.
Then there’s Gavin Schmidt, the director of the NASA Goddard Institute for Space Studies. He mocked one of the authors, calling his work “BS” . Schmidt also said, “The only point of this paper (which every climate denier and their dog has jumped onto), is to launder dirty ‘science’ into a clean made-for-Fox meme.”
Dirty science? Is that like Weird Science if it was rated R instead of PG-13? Schmidt is even using a Freedom of Information Act request to demand one of the editor’s emails with relevant scientists. This seems a lot like intimidation to try to coerce uniformity in the scientific community, rather than allowing for disagreement to try to get to the facts.
Climatologist Judith Curry at Georgia Institute of Technology told The Epoch Times that “The response by Schmidt, Mann, and others, particularly with regard to the FOIA request regarding editorial discussions on this paper, reflects their ongoing attempts to control the scientific as well as public dialogue on climate change”.
If you ask me, this also reflects just how arrogant
people in the scientific community have become.
For example, the UN’s under-secretary-general for global communications last year had the audacity to say that the UN “owns” the science. She even admitted that the UN was working with Google to manipulate search results! “We partnered with Google for example. If you Google climate change, at the top of your search, you will get all kinds of UN resources. We started this partnership when we were shocked to see that when we googled climate change we were getting incredibly distorted information right at the top. So we’re becoming much more proactive, you know. We own the science, and we think that the world, you know, should know it.”
“Own the science”? How arrogant do you have to be to believe that you “own” science? What, are they gonna have a garage sale and try to get people to buy the theory of gravity from them, since they “own” it? It’s this kind of “ownership” that allows for organizations like the UN to pre-emptively silence dissent with very little regard for both free speech or even science itself.
You’d be very, very mistaken if you believe that scientists are above politics and bias or that they should not be questioned. Let’s not forget that politicians and scientists said that there was zero evidence Covid came from a lab leaks…and that lockdowns were the best way to deal with the pandemic, despite warnings to the contrary.
The people pushing those narratives thought that they couldn’t possibly be wrong, but in hindsight, they look pretty foolish. Trying to coerce people to a consensus of what you think is the science, isn’t real science. Real science would acknowledge that scientists don’t always have all the data and examine different approaches with professionalism.
Of course there are going to be people who believe in disinformation. But what’s to stop organizations as powerful as the UN from spreading their own disinformation? If we have scientists who are trying to spin facts that favor corporate interests in fossi fuels, tobacco, and fast food, then don’t you think the same could happen for the interests of climate change activists?
People will spread disinformation about anything. Even things that are obviously false, like Pineapple on pizza being anything less than amazing. Like climate change scientists, YouTube loves restricting debate and discussions about things it finds too controversial, such as climate change.
 Glenn Spitzer turns the table on alarmists in his American Thinker article Who Are the Real Climate Change Deniers? Excerpts in italics with my bolds and added images.