
The animation shows remarkable growth of Arctic ice extent just since COP28 began. As noted in the previous Arctic ice post, Hudson Bay (lower right) was a lagging region, but freezing accelerated there. At the top, Barents and Greenland sea added ice. As well, both Bering and Okhotsk seas (far left) added fast ice on coastlines. In all, half a Wadham, 517k km2 of ice extent was added in just three days.

A Lufthansa aircraft at the snow-covered Munich airport on Saturday. Photograph: Karl-Josef Hildenbrand/AP
Coincidently, COP28 also triggered heavy snow bringing chaos to southern Germany causing Munich to suspend flights to anywhere, including Dubai.
The graph below shows the gains in ice extent erasing a brief deficit to average.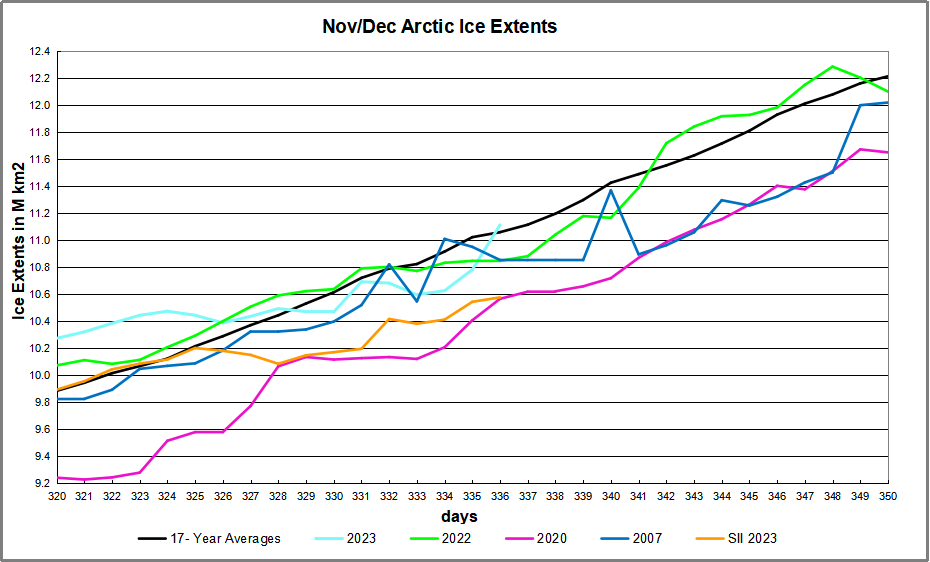
MASIE shows a gain of ~0.5M km2 from day 334 to 336, now exceeding average after being lower briefly. SII (Sea Ice Index) also rose but is still estimating ice extent ~500k km2 lower.

The table below shows the distribution of ice in the Arctic Ocean basins.
| Region | 2023336 | Day 336 | 2023-Ave. | 2007336 | 2023-2007 |
| (0) Northern_Hemisphere | 11113626 | 11059843 | 53782 | 10853632 | 259993 |
| (1) Beaufort_Sea | 1070966 | 1069301 | 1665 | 1054586 | 16380 |
| (2) Chukchi_Sea | 765844 | 797154 | -31311 | 607874 | 157970 |
| (3) East_Siberian_Sea | 1087137 | 1080765 | 6372 | 1023256 | 63882 |
| (4) Laptev_Sea | 897845 | 897835 | 9 | 897845 | 0 |
| (5) Kara_Sea | 812779 | 796332 | 16446 | 829462 | -16683 |
| (6) Barents_Sea | 350616 | 259899 | 90717 | 222769 | 127847 |
| (7) Greenland_Sea | 711570 | 538651 | 172919 | 541176 | 170393 |
| (8) Baffin_Bay_Gulf_of_St._Lawrence | 571757 | 697517 | -125760 | 755390 | -183633 |
| (9) Canadian_Archipelago | 854860 | 853409 | 1451 | 852556 | 2304 |
| (10) Hudson_Bay | 553841 | 636088 | -82247 | 812965 | -259124 |
| (11) Central_Arctic | 3220281 | 3198662 | 21619 | 3177278 | 43003 |
| (12) Bering_Sea | 82391 | 154107 | -71716 | 27916 | 54475 |
| (13) Baltic_Sea | 23276 | 4889 | 18387 | 2898 | 20378 |
| (14) Sea_of_Okhotsk | 106202 | 70731 | 35471 | 46377 | 59826 |
Note that Arctic ice now exceeds 11M km2, or 74% of last March maximum. As shown in the table above, the main deficits to average are in Hudson and Baffin Bays, along with less ice in Bering Sea. Offsetting are surpluses elsewhere, especially in Barents and Greenland seas.


One comment