Helter Skelter Climate Policies

Ross McKitrick explains the dangers of making climate policies willy-nilly in his Financial Post article Economists’ letter misses the point about the carbon tax revolt.  Excerpts in italics with my bolds and added images.

Yes, the carbon tax works great in a ‘first-best’ world where it’s the
only carbon policy. In the real world, carbon policies are piled high.

An open letter is circulating online among my economist colleagues aiming to promote sound thinking on carbon taxes. It makes some valid points and will probably get waved around in the House of Commons before long. But it’s conspicuously selective in its focus, to the point of ignoring the main problems with Canadian climate policy as a whole.


EV charging sign Electric-vehicle mandates and subsidies are among the mountain of climate policies that have been piled on top of Canada’s carbon tax. PHOTO BY JOSHUA A. BICKEL/THE ASSOCIATED PRESS

There’s a massive pile of boulders blocking the road to efficient policy, including:

    • clean fuel regulations,
    • the oil-and-gas-sector emissions cap,
    • the electricity sector coal phase-out,
    • strict energy efficiency rules for new and existing buildings,
    • new performance mandates for natural gas-fired generation plants,
    • the regulatory blockade against liquified natural gas export facilities,
    • new motor vehicle fuel economy standards,
    • caps on fertilizer use on farms,
    • provincial ethanol production subsidies,
    • electric vehicle mandates and subsidies,
    • provincial renewable electricity mandates,
    • grid-scale battery storage experiments,
    • the Green Infrastructure Fund,
    • carbon capture and underground storage mandates, 
    • subsidies for electric buses and emergency vehicles in Canadian cities,
    • new aviation and rail sector emission limits,
      and many more.

Not one of these occasioned a letter of protest from Canadian economists.

Beside that mountain of boulders there’s a twig labelled “overstated objections to carbon pricing.” At the sight of it, hundreds of economists have rushed forward to sweep it off the road. What a help!

To my well-meaning colleagues I say: the pile of regulatory boulders
long ago made the economic case for carbon pricing irrelevant.

Layering a carbon tax on top of current and planned command-and-control regulations does not yield an efficient outcome, it just raises the overall cost to consumers. Which is why I can’t get excited about and certainly won’t sign the carbon-pricing letter. That’s not where the heavy lifting is needed.

My colleagues object to exaggerated claims about the cost of carbon taxes. Fair enough. But far worse are exaggerated claims about both the benefits of reducing carbon dioxide emissions and the economic opportunities associated with the so-called “energy transition.” Exaggeration about the benefits of emission reduction is traceable to poor-quality academic research, such as continued use of climate models known to have large, persistent warming biases and of the RCP8.5 emissions scenario, long since shown in the academic literature to be grossly exaggerated.

But a lot of it is simply groundless rhetoric. Climate activists, politicians and journalists have spent years blaming Canadians’ fossil fuel use for every bad weather event that comes along and shutting down rational debate with polemical cudgels such as “climate emergency” declarations. Again, none of this occasioned a cautionary letter from economists.

There’s another big issue on which the letter was silent. Suppose we did clear all the regulatory boulders along with the carbon-pricing-costs-too-much twig. How high should the carbon tax be? A few of the letter’s signatories are former students of mine so I expect they remember the formula for an optimal emissions tax in the presence of an existing tax system. If not, they can take their copy of Economic Analysis of Environmental Policy by Prof. McKitrick off the shelf, blow off the thick layer of dust and look it up. Or they can consult any of the half-dozen or so journal articles published since the 1970s that derive it. But I suspect most of the other signatories have never seen the formula and don’t even know it exists.

To be technical for a moment, the optimal carbon tax rate varies inversely with the marginal cost of the overall tax system. The higher the tax burden — and with our heavy reliance on income taxes our burden is high — the costlier it is at the margin to provide any public good, including emissions reductions. Economists call this a “second-best problem”: inefficiencies in one place, like the tax system, cause inefficiencies in other policy areas, yielding in this case a higher optimal level of emissions and a lower optimal carbon tax rate.

Based on reasonable estimates of the social cost of carbon and the marginal costs of our tax system, our carbon price is already high enough. In fact, it may well be too high. I say this as one of the only Canadian economists who has published on all aspects of the question. Believing in mainstream climate science and economics, as I do, does not oblige you to dismiss public complaints that the carbon tax is too costly.

Which raises my final point: the age of mass academic letter-writing has long since passed. Academia has become too politically one-sided. Universities don’t get to spend years filling their ranks with staff drawn from one side of the political spectrum and then expect to be viewed as neutral arbiters of public policy issues. The more signatories there are on a letter like this, the less impact it will have. People nowadays will make up their own minds, thank you very much, and a well-argued essay by an individual willing to stand alone may even carry more weight.

Online conversations today are about rising living costs, stagnant real wages and deindustrialization. Even if carbon pricing isn’t the main cause of all this, climate policy is playing a growing role and people can be excused for lumping it all together. The public would welcome insight from economists about how to deal with these challenges. A mass letter enthusing about carbon taxes doesn’t provide it.

There is no charge for content on this site, nor for subscribers to receive email notifications of postings.

Our Weather Extremes Are Customary in History

Ralph Alexander provides the facts and data in his GWPF paper Weather Extremes in Historical Context.  Excerpts in italics with my bolds and selected images.

Introduction

This report refutes the popular but mistaken belief that today’s weather extremes are more common and more intense because of climate change, by examining the history of extreme weather events over the past century or so.  Drawing on newspaper archives, it presents multiple examples of past extremes that match or exceed anything experienced in the present day. That so many people are unaware of this fact shows that collective memories of extreme weather are short-lived.

Heatwaves

Heatwaves of the last few decades pale in comparison to those of the 1930s – a period whose importance is frequently downplayed by the media and environmental activists. The evidence shows that the record heat of that time was not confined to the US ‘Dust Bowl’, but extended throughout much of North America, as well as to other countries, such as France, India and Australia. US heatwaves during July 2023, falsely trumpeted by the mainstream media as the hottest month in history, failed to exceed the scorching heat of 1934.

Figure1: US heatwaves in 1930. Left: sample maximum temperatures for selected cities in April heatwave; right: exceptionally warm July heatwave in New York city.

Figure5: Observed changes in heatwaves in the contiguous US, 1901–2018. Source: CSSR.99

Heatwaves lasting a week or longer in the 1930s were not confined to North America; the Southern Hemisphere baked too. Adelaide, on Australia’s south coast, experienced a heatwave at least 11 days long in 1930, and Perth on the west coast saw a 10-day spell in 1933.  In August 1930, Australian and New Zealand (and presumably French) newspapers recounted a French heatwave that month, in which the temperature soared to a staggering 50°C (122°F) in the Loire valley – besting a purported record of 46°C (115°F) set in southern France in 2019. Many more examples exist of the exceptionally hot 1930s all over the globe. Even with modern global warming, there’s nothing unprecedented about current heatwaves, either in frequency or magnitude.

Floods

Major floods today are no more common nor deadly or disruptive than any of the thousands of floods in the past, despite heavier precipitation in a warming world (which has increased flash flooding in some regions).  Many of the world’s countries regularly experience major floods, especially China, India and Pakistan. A significant 1931 flood in China covered a far greater area and affected many more people than the devastating 2022 floods in Pakistan.

Figure 8: Disastrous Yangtze River flood in China, 1931.

Figure 10: Annual number of deaths from major floods in Pakistan, 1950 to 2012. Source: M.J. Paulikas and M.K. Rahman.100

The Pakistan floods of 2022 were the nation’s sixth since 1950 to kill over 1,000 people, although the death toll from the 2022 floods was a comparable 1,739. Major floods which killed as many as 3,100 people afflicted the country in 1950, 1955, 1956, 1957, 1959, throughout the 1970s and in more recent years.

Monsoonal rains in 1950 led to flooding that killed an estimated 2,900 people across the country and caused the Ravi River in northeastern Pakistan to burst its banks; 10,000 villages were decimated and 900,000 people made homeless.  In 1973, one of Pakistan’s worst-ever floods followed intense rainfall of 325 mm (13 inches) in Punjab (which means ‘Five Rivers’) province, affecting more than 4.8 million people out of a total population of about 65 million.

Droughts

Severe droughts have been a continuing feature of the Earth’s climate for millennia, despite the brouhaha in the mainstream media over the extended drought in Europe during the summer of 2022. Not only was the European drought not unprecedented, but there have been numerous longer and drier droughts throughout history, including during the past century.

Figure 12: Famine following drought in India, 1966–67

Figure14: Percentage of the US in drought 1895–2015. Based on the Palmer Drought Severity Index. Source: NOAA/NCEI.101

As an illustration that the 1930s and 1950s were not the only decades over the past century in which the US experienced significant droughts, Figure 14 depicts observational data showing the area of the contiguous US in drought from 1895 up until 2015. As can be seen, the long-term pattern in the US is featureless, despite global warming. Reconstructions of ancient droughts using tree rings or pollen as proxies reveal that historical droughts were even longer and more severe than those described here, many lasting for decades – so-called ‘megadroughts.’

Figure13: Texas drought, 1950–57. Left top photo: car being towed after becoming stuck in parched riverbed; left bottom photo: once lakeside cabins on shrinking Lake Waco; right top photo: dry lakebed; right bottom: newspaper excerpt.

Hurricanes

Hurricanes overall actually show a decreasing trend around the globe, and the frequency of their landfalling has not changed for at least 50 years. The deadliest US hurricane in recorded history, which killed an estimated 8–12,000 people, struck Galveston, Texas in 1900. As a comparison, the death toll of 2022’s Category 5 Hurricane Ian, which ldeluged much of Florida with a storm surge as high as Galveston’s, was just 156.

Figure 17: Annual number of North Atlantic hurricanes, 1851–2022. Source: NOAA Hurricane Research Division103 and Paul Homewood.104

Hurricanes have been a fact of life for Americans in and around the Gulf of Mexico since Galveston and before. The death toll has fallen over time, with improvements in planning and engineering to safeguard structures, and the development of early warning systems to allow evacuation of threatened communities. Nevertheless, the frequency of North Atlantic hurricanes has been essentially unchanged since 1851, as shown in Figure 17. The apparent heightened hurricane activity over the last 20 years, particularly in 2005 and 2020, simply reflects improvements in observational capabilities since 1970, and is unlikely to be a true climate trend, say a team of hurricane experts. The incidence of major North Atlantic hurricanes in recent decades is no higher than that in the 1950s and 1960s, when the Earth was actually cooling, unlike today.

Figure22: Hurricane Camille, 1969.

These are just a handful of hurricanes from our past, all as massive and deadly as Category 5 Hurricane Ian, which in 2022 deluged Florida with a storm surge as high as Galveston’s and rainfall up to 685 mm (27 inches); 156 were killed. Hurricanes are not on the rise today

Tornadoes

Likewise, there is no evidence that climate change is causing tornadoes to become more frequent and stronger. The annual number of strong (EF3 or greater) US tornadoes has in fact declined dramatically over the last 72 years, and there are ample examples of past tornadoes just as or more violent and deadly than today’s.

Figure26: Super Outbreak of tornadoes, 1974. Left: distribution and approximate path lengths of tornadoes; top right photo: F5 tornado approaching Xenia, Ohio (population 29,000); center right and bottom right photos: consequent wreckage in Xenia.

Figure27: Annual count of EF3 and above tornadoes in the US, 1950–2021. Source: Source: NOAA/NCEI.106, 107

After a flurry of tornadoes swarmed the central US in March 2023, the media quickly fell into the trap of linking the surge to climate change, as often occurs with other forms of extreme weather. But there is no evidence that climate change is causing tornadoes to become more frequent and  stronger, any more than hurricanes are increasing in strength and number.

Wildfires

Wildfires are not increasing either. On the contrary, the area burned annually is diminishing in most countries. The total number of US fires and the area burned in 2022 were both 20% less than in 2007; data before 1983 that mysteriously disappeared recently from a government website shows an even larger historical decline. And, in  spite of popular belief, ignition of wildfires by arson plays a larger role than sustained high temperatures and wind.

Figure30: Wildfires in northern California Left: near Auburn, Mt. Shasta and Yosemite, 1936; right: in Mendocino County, known for its redwood forests, 1945.

Figure32: Global forest area burned by wildfires, 1900–2010 Source: Jia Yang et al.108

Smoke that wafted over the US from extensive Canadian wildfires in 2023 has given credence to the mistaken belief that wildfires are intensifying because of climate change. However, just as with all the other examples of extreme weather, there is no scientific evidence that wildfires today are any more frequent or severe than anything experienced in the past. Although they can be exacerbated by weather extremes, such as heatwaves and droughts, we’ve already seen that those are not on the rise either.

In addition to examples of past weather extremes from newspaper archives, the report concludes with a short section on documented extreme weather events dating back centuries and even millennia.

Conclusion

The perception that extreme weather is increasing in frequency and severity is primarily a consequence of modern technology – the Internet and smart phones – which have revolutionised communication and made us much more aware of such disasters than we were 50 or 100 years ago. The misperception has only been amplified by the mainstream media, eager to promote the latest climate scare. And as psychologists know, constant repetition of a false belief can, over time, create the illusion of truth. But history tells a different story.

There is no charge for content on this site, nor for subscribers to receive email notifications of postings.

The Big Lie Behind DEI

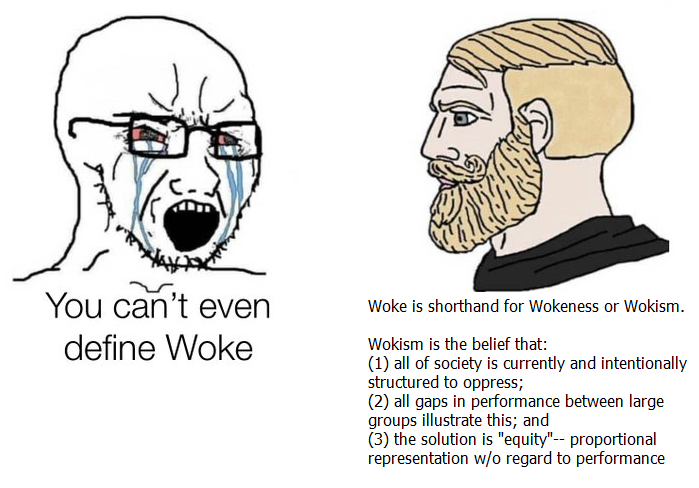
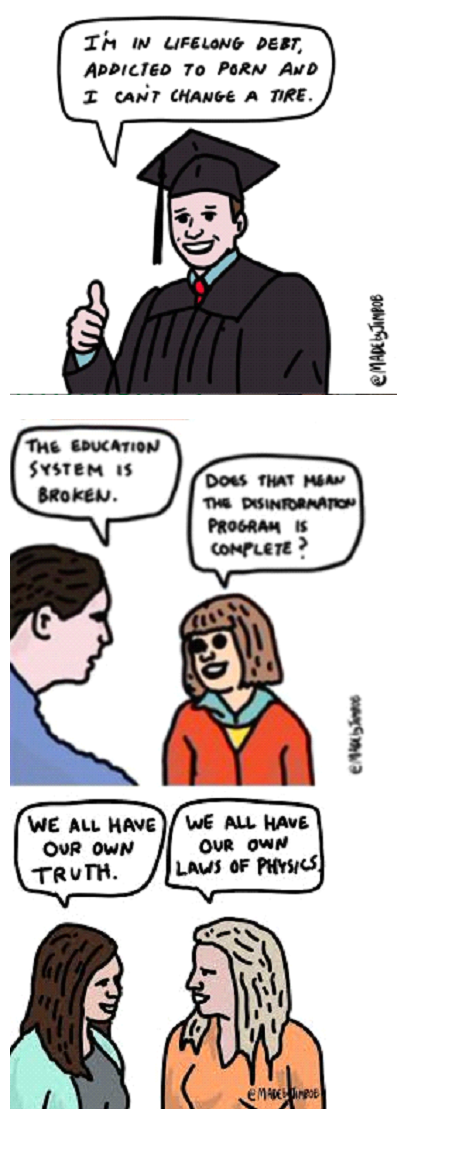
Below is an article describing how the woke industry started and expanded by advancing a fundamental lie about human happiness and social fairness.  The image above calls attention to the notion that sorts individuals into classes and attributes inequalities in status or prosperity to oppression by others. The lie is that any disappointment or disadvantage is the fault of others, ie. privileged oppressors.  Thus is swept away standards of performance, accountability and considerations of individual merit.   As explained below the DEI bureaucracy emerged to reward so-called “protected classes” at the expense of “privileged classes.”

A Brief History of the Diversity Industry

Heather Mac Donald explains the origins and preoccupations of Diversity, Inclusion and Equity (DIE).  Whoops, I mean Diversity, Equity and Inclusion (DEI)  which is now an academic degree you can acquire.  Her Quillette article is Almost Four Decades After Its Birth, The Diversity Industry Thrives on Its Own Failures.

The diversity business originated in 1984, when R. Roosevelt Thomas, a Harvard business school graduate, founded the American Institute for Managing Diversity at Morehouse College. Corporations had been practicing affirmative action for years, but the women and minorities whom employers had hired to meet equal-opportunity obligations weren’t advancing up the career ladder in acceptable numbers. Thomas came up with a novel explanation. The problem wasn’t that preferentially admitted recruits were underqualified; the problem was that their supervisors didn’t know how to “manage diversity.” It was those supervisors who needed remedial training—lots of it—not the affirmative-action beneficiaries themselves.

screen-shot-2021-07-09-at-12.17.46-am

Managerial expectations about merit and performance often reflected cultural prejudices, Thomas and the consultants who followed him insisted. “‘Qualifications’ is a code word in the business world with very negative connotations,” a consultant with the professional-services firm of Towers Perrin (as it was then called) said in 1993. If minorities don’t meet existing employment criteria, then corporations need to expand their definition of what it means to be employable, said Alan Richter, creator of the 1991 board game, The Diversity Game. Promptness, precision, and a cogent communications style were among the attributes that diversity advisors deemed likely expendable.

A lucrative new consulting practice was born, its growth driven by a constant churn in terminology. “Valuing diversity” was different from “managing diversity.” Each newly spawned phrase came with a cadre of high-priced tutors. Lewis Griggs currently offers video trainings in such subjects as “Communicating Across Differences,” “Supervising and Managing Differences,” and “Creating, Managing, Valuing, and Leveraging Diversity,” with each video purporting to contain specialized content appropriate for different parts of an organization.

“Diversity” was eventually joined by “inclusion.” “Equity” was then added, thus yielding today’s DEI (Diversity, Equity, and Inclusion) triumvirate (sometimes also going as “EDI”). The most cutting-edge organizations have lately appended a “B” (for Belonging), as at the Juilliard School in New York City. Distinguishing these terms is a core function of diversity training—and now, at Bentley, of diversity scholarship. The university’s new DEI major, the Chronicle of Higher Education reports, will help graduates understand the “nuances of and differences between diversity, equity, inclusion, and justice.”

Even by 1993, half of Fortune 500 companies had a designated diversity officer, and 40 percent of American companies had instituted diversity training. Diversity conferences were occurring regularly, attracting government and business attendees. And yet many reporters, academics, corporate consultants, and activists still insist that managers not only fail to “value diversity,” but remain complicit in creating a dangerous environment for women and racial minorities.

Example: Levi Strauss & Co., which was recognized on Forbes’s list of “Best Employers for Diversity” in 2019. The company itself boasts: “In the 1960s, we integrated our factories a decade before it was required by law. In the early 1980s, we joined the fight against HIV/AIDS early on. Furthermore, our president and CEO, Chip Bergh, was one of the first company leaders to join the CEO Action for Diversity & Inclusion™ [in 2017], and has been on the front lines of efforts to protect Dreamers knowing that diversity and inclusivity makes our company better and our country stronger (after all, Levi Strauss himself was an immigrant).”

And yet the situation for minority employees at Levi Strauss is still so dire that the company has been hosting racially segregated healing sessions with professional mental health experts. As the Washington Free Beacon recently reported, its chief executive for DEI is trying to provide a “safe space for employees to express themselves” without feeling “triggered.”

Bentley University itself has yet to yield dividends from its longstanding diversity efforts. The school has been “working for decades on issues, challenges, and opportunities” pertaining to diversity, according to its Office of Diversity and Inclusion. Over 900 faculty and administrators have attended two-day diversity retreats; numerous committees, departments, and offices have focused on improving the school’s “diversity climate.” Bentley even has its own diversity consulting outfit, the Center for Women and Business, which advises employees and managers on such diversity pitfalls as being a mere “performative ally” of oppressed colleagues (as opposed to an active ally).

And yet, despite this effort, a Bentley Racial Justice Task Force recently found that the campus still did not understand how “race and racism” operate at the university. So difficult is it to be a diverse member of Bentley that the task force, formed in July 2020, began with a moment of “restoration,” providing to all “those who had been traumatized” at the school a “time to heal” and a time to “process the pain of racial injustice.”

One of Bentley’s biggest failings, according to the task force, has been its “false confidence” in “objectivity and meritocracy.” These are the norms of a “historically and predominantly white institution (HWI/PWI),” per the task force members. Typical of HWIs/PWIs, Bentley does not pay sufficient attention to the “systemic inequality” that such white norms engender. Equally dismaying, many students and professors apparently would rather study subjects other than racism, the task force lamented, thereby betraying their “lack of understanding about why the study of race is critical to the creation of a full academic experience.”

Diversity industry proponents would argue that white supremacy is simply too ingrained in America’s institutions to be rooted out within a mere three to four decades of diversity work.

But another possible reason why diversity training has not met its stated goals is that the field is intellectually bankrupt: Its practitioners peddle empty verbiage to fix a problem that is largely imaginary. I asked Bentley’s press office what the difference is between “diversity, equity, and inclusion.” The answer was a dodge: “Rather than give students one particular view of diversity, equity, inclusion and justice, Bentley’s DEI major encourages students to compare and contrast approaches to diversity, equity, inclusion and justice from across disciplines and perspectives and show how they intersect with one another.” Other questions—how the school defines a “real discipline,” what are the core texts of this new discipline, and why Bentley’s decades of diversity work have not lessened the school’s purported racism—were ignored entirely.

Bentley sociologist Gary David says that “more and more studies have shown” that diversity training and DEI perspectives make “good business sense.” But this oft-asserted claim rests on a few studies of dubious experimental design, lacking control groups. The one thing diversity trainees reliably learn is how to answer post-training survey questions “in the way the training said they ‘should,’” reports sociologist Musa al-Gharbi. As for actually changing behaviors in a diversity-approved direction, the training is not only ineffective, it is often counterproductive, according to al-Gharbi.

race-card

Far from being institutionally racist, Bentley University, like virtually every other American college today, is filled with well-meaning adults who want all their students to succeed. Corporations, law firms, Big Tech, and government agencies are bending over backwards to hire and promote as many underrepresented minorities (i.e., blacks and Hispanics) as possible. If the number of those minorities in a college or business organization is not proportional to their population share, that underrepresentation is due first and foremost to the academic skills gap. Mention of the skills gap is taboo in diversity circles, but it is real—repeatedly documented by the National Assessment of Educational Progress exams, the SAT, the LSAT, the GREs, the GMAT, and the MCAT—and it is consequential.

Hiring based on any extraneous selection criterion inevitably lowers the average qualifications of the resulting employee group. Hiring based on race entails a particularly significant deviation from a meritocratic ideal, since the only reason why color-conscious hiring is implemented in the first place is that merit hiring often fails to produce a critical mass of black and Hispanic employees. In essence, the diversity conceit is a perpetual motion machine: If underqualified diversity hires are promoted out of diversity pressure, resentment and obfuscation follow. If they hit a glass ceiling, accusations of bias are inevitable. In either situation, a diversity consultant is waiting in the wings to teach managers that their expectations and standards are racist.

university lightening

The increasing power of college diversity bureaucrats over academic affairs since the 1990s has been stunning. Diversity vice-chancellors oversee faculty hiring searches, mandate quotas regarding whom search committees may interview, and sometimes even mandate quotas regarding whom they must hire. Chief inclusion officers track departmental race and sex demographics, pressuring department chairs to correct diversity deficits. Associate provosts for diversity coordinate campaigns for required courses on identity and grievance within the curriculum. Deans of inclusion teach students to recognize their place on the great totem pole of victimization. Vice presidents for equity monitor campus speech, on the lookout for punishable microaggressions. Senior advisors on race and community lead crusades against faculty who have allegedly threatened the safety of campus victim groups through non-orthodox statements regarding race and sex.

Now that the fictions underpinning this enterprise are being enshrined as an academic discipline, the possibility that the university will return to its status as an institution dedicated to the unfettered search for knowledge—and even, dare one say it, objectivity and meritocracy—will grow yet more remote.

Postscript:  When Graduates from DEI Institutions Go to Workplaces

A recent Newsweek articles reports Gen Z Is Toxic for Companies, Employers Believe.  Excerpts in italics with my bolds.

Companies are struggling to operate as Gen Z enters the workforce at higher rates, and a growing majority of employers say the younger generation is toxic for their business.

That’s the latest from a new Freedom Economy Index report conducted by PublicSquare and RedBalloon this month. In the survey, 68 percent of small business owners said Gen Zers were the “least reliable” of all their employees. And 71 percent said these younger workers were the most likely to have a workplace mental health issue.

One of the surveyed employers spoke of Gen Z’s “absolute delusion, complete lack of common sense, and zero critical reasoning or basic analytical skills.”

The criticism for Gen Z workers was in full force, as less than 4 percent said Gen Z was the generation that most aligns with their workplace culture, and 62 percent said Gen Z was the most likely to create division and toxicity in the workplace.

Another employer noted the generation’s tendency for “expecting promotions for simply showing up every day.”

Footnote:  Boeing Learning the Hard Way About DEI Hiring

There is no charge for content on this site, nor for subscribers to receive email notifications of postings.

Arctic Ice Marches Upward 2024

The animation shows end of March Arctic ice extents on day 91 over the last 19 years (length of MASIE dataset). Of course central Arctic basins are frozen solid, and the fluctuations are visible on the marginal basins both the Atlantic side (right) and the Pacific (left). Note the higher extents in 2012, followed by lesser ice, now overcome by 2024.

The graph below shows Monthly averages for March since 2007.  March is the maximum month in the annual cycle in contrast to September being the minimum Arctic ice extents. Note the low 2007 extents followed by several years over15M km2, then lesser extents 2015 to 2018, and increasing extents up to 2024 nearly averaging 15M for the month.


The graph below shows March daily ice extents for 2024 compared to 18 year averages, and some years of note.


The black line shows during March on average Arctic ice extents nearly reach 15 Wadhams (15M km2) on Day 62, March 2.  A slow decline is normal until Day 91, March 31.  However, that period in 2024 saw Arctic ice go over 15M on day 68 and remain there until day 79. Afterward both MASIE and SII show above average extents to month end.  2006 was the first year in this dataset and ended March ~800k km2 in deficit to average.  2021 and 2023 were ~200k below average on Day 91 while 2024 ended 266k km2 surplus ice.   As usual in transitional months like March and September, SII (Sea Ice Index) shows a similar pattern with generally lower extents.

Why is this important?  All the claims of global climate emergency depend on dangerously higher temperatures, lower sea ice, and rising sea levels.  The lack of additional warming prior to 2023 El Nino is documented in a post UAH February 2024: SH Saves Global Warming.

The lack of acceleration in sea levels along coastlines has been discussed also.  See USCS Warnings of Coastal Flooding

Also, a longer term perspective is informative:

post-glacial_sea_level
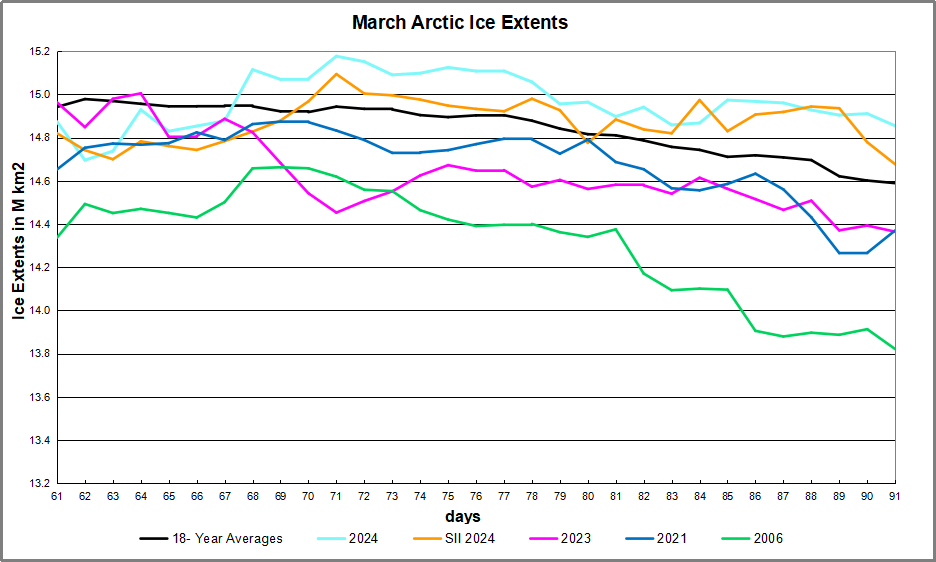
The table below shows the distribution of Sea Ice on day 91 across the Arctic Regions, on average, this year and 2006.

Region 2024091 Day 91 ave 2024-Ave. 2006091 2024-2006
 (0) Northern_Hemisphere 14854967 14589377 265590 13821470 1033497
 (1) Beaufort_Sea 1070983 1070226 758 1068683 2301
 (2) Chukchi_Sea 966006 963401 2606 959091 6915
 (3) East_Siberian_Sea 1087137 1086151 987 1084120 3017
 (4) Laptev_Sea 897845 896053 1792 896510 1335
 (5) Kara_Sea 935023 919656 15367 910487 24536
 (6) Barents_Sea 845789 657875 187914 622588 223201
 (7) Greenland_Sea 771533 661909 109624 601310 170223
 (8) Baffin_Bay_Gulf_of_St._Lawrence 1238205 1384413 -146208 1003875 234330
 (9) Canadian_Archipelago 854860 853089 1772 851691 3169
 (10) Hudson_Bay 1260903 1255353 5551 1240389 20514
 (11) Central_Arctic 3248013 3235452 12561 3239349 8664
 (12) Bering_Sea 724493 703487 21006 658979 65514
 (13) Baltic_Sea 50165 61636 -11471 114622 -64457
 (14) Sea_of_Okhotsk 900660 831057 69602 558027 342633

The overall surplus to average is 266k km2, (2%).  The only major deficit is in Baffin Bay, more than offset by surpluses everywhere, especially in Okhotsk, Barents and Greenland seas.  Note Arctic ice yesterday was more than a Wadham greater than the same day in 2006.

bathymetric_map_arctic_ocean

Illustration by Eleanor Lutz shows Earth’s seasonal climate changes. If played in full screen, the four corners present views from top, bottom and sides. It is a visual representation of scientific datasets measuring Arctic ice extents.