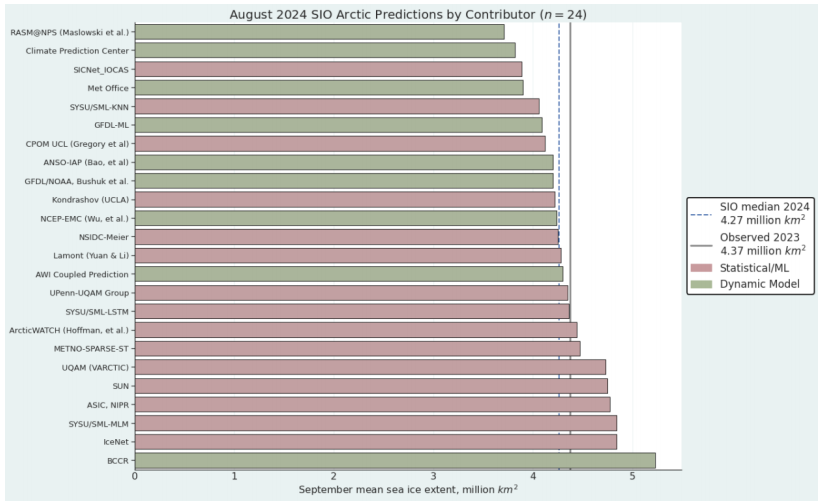
Figure 1. Distribution of SIO contributors for August estimates of September 2024 pan-Arctic sea-ice extent. No Heuristic methods were submitted in August. “Sun” is a public/citizen contribution. Image courtesy of Matthew Fisher, NSIDC.
2024: August Report from Sea Ice Prediction Network
The August 2024 Outlook received 24 pan-Arctic contributions (Figure 1). This year’s median
forecasted value for pan-Arctic September sea-ice extent is 4.27 million square kilometers with
an interquartile range of 4.11 to 4.54 million square kilometers. This is lower than the 2022 (4.83
million square kilometers) and 2023 (4.60 million square kilometers) August median forecasts
for September. . .This reflects relatively rapid ice loss during the month of July, resulting in August
Outlooks revising estimates downward. The lowest sea-ice extent forecast is 3.71 million square
kilometers, from the RASM@NPS submission); the highest sea-ice extent forecast is 5.23
million square kilometers, submitted by BCCR.
These are predictions for the September 2024 monthly average ice extent as reported by NOAA Sea Ice Index (SII). This post provides a look at the 2024 Year To Date (YTD) based on monthly averages comparing MASIE and SII datasets. (18 year average is 2006 to 2023 inclusive).
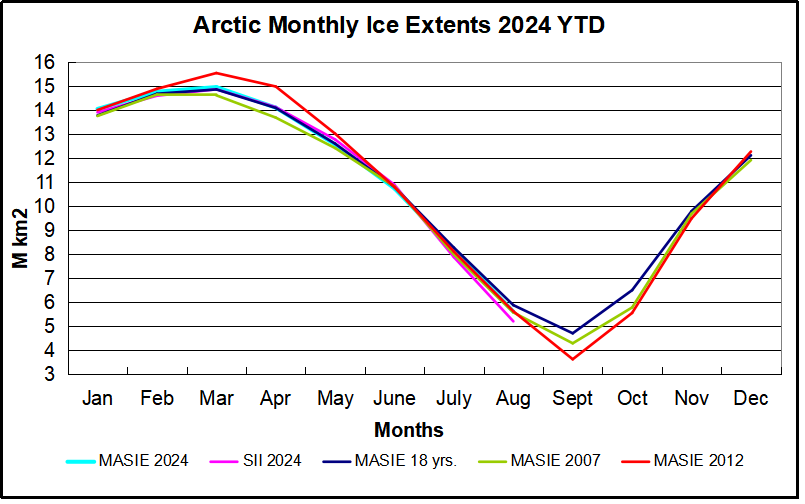
The graph puts 2024 into recent historical perspective. Note how 2024 was slightly above the 18-year average for the first 5 months, then tracked slightly lower to average through August. The outlier 2012 provided the highest March maximum as well as the lowest September minimum, coinciding with the Great Arctic Cyclone that year. 2007 began the period with the lowest minimum except for 2012. SII 2024 started slightly higher than MASIE the first 3 months, then ran the same as MASIE until dropping in August 400k km2 below MASIE 2024 and also lower than 2007 and 2012.
The table below provides the monthly Arctic ice extent averages for comparisons (all are M km2)
| Monthly | MASIE 2024 | SII 2024 | MASIE -SII | MASIE 2024-18 YR AVE | SII 2024-18 YR AVE | MASIE 2024-2007 |
| Jan | 14.055 | 13.917 | 0.139 | 0.280 | 0.333 | 0.293 |
| Feb | 14.772 | 14.605 | 0.167 | 0.096 | 0.152 | 0.121 |
| Mar | 14.966 | 14.873 | 0.093 | 0.111 | 0.199 | 0.344 |
| Apr | 14.113 | 14.131 | -0.018 | 0.021 | 0.118 | 0.418 |
| May | 12.577 | 12.783 | -0.207 | -0.038 | 0.123 | 0.150 |
| June | 10.744 | 10.895 | -0.151 | -0.072 | 0.024 | -0.082 |
| July | 8.181 | 7.884 | 0.297 | -0.107 | -0.160 | 0.188 |
| Aug | 5.617 | 5.214 | 0.404 | -0.267 | -0.423 | 0.033 |
The first two data columns are the 2024 YTD shown by MASIE and SII, with the MASIE surpluses in column three. Column four shows MASIE 2024 compared to MASIE 18 year averages, while column five shows SII 2024 compared to SII 18 year averages. YTD August MASIE and SII are below their averages, SII by nearly half a Wadham. The last column shows MASIE 2024 holding surpluses over 2007 most of the months, and nearly the same in August.
Summary
The experts involved in SIPN are expecting SII 2024 September to be much lower than 2023 and 2022, based largely on the large deficits SII is showing in July and August. The way MASIE is going, this September looks to be lower than its average, but much higher than SII. While the daily minimum for the year occurs mid September, ice extent on September 30 is typically slightly higher than on September 1.
Footnote:
Some people unhappy with the higher amounts of ice extent shown by MASIE continue to claim that Sea Ice Index is the only dataset that can be used. This is false in fact and in logic. Why should anyone accept that the highest quality picture of ice day to day has no shelf life, that one year’s charts can not be compared with another year? Researchers do this, including Walt Meier in charge of Sea Ice Index. That said, I understand his interest in directing people to use his product rather than one he does not control. As I have said before:
MASIE is rigorous, reliable, serves as calibration for satellite products, and continues the long and honorable tradition of naval ice charting using modern technologies. More on this at my post Support MASIE Arctic Ice Dataset

MASIE: “high-resolution, accurate charts of ice conditions”
Walt Meier, NSIDC, October 2015 article in Annals of Glaciology.

One comment